. 2016 Dec 22:7:13874.
doi: 10.1038/ncomms13874.

p120-catenin prevents multinucleation through control of MKLP1-dependent RhoA activity during cytokinesis

Affiliations

p120-catenin prevents multinucleation through control of MKLP1-dependent RhoA activity during cytokinesis

Robert A H van de Ven et al. Nat Commun. .

Erratum in

Abstract

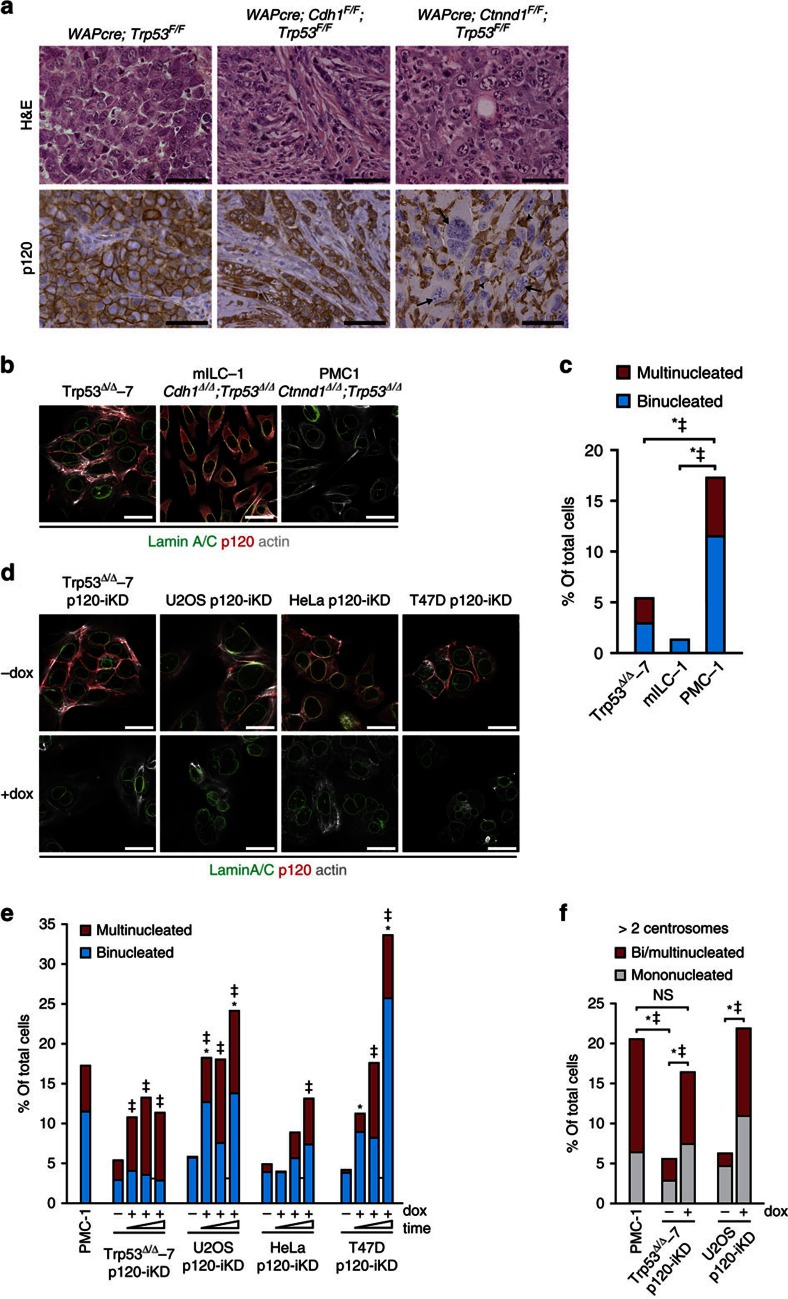
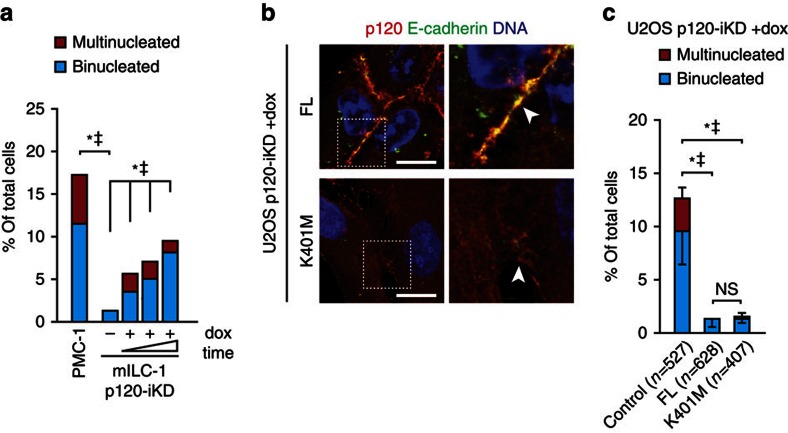
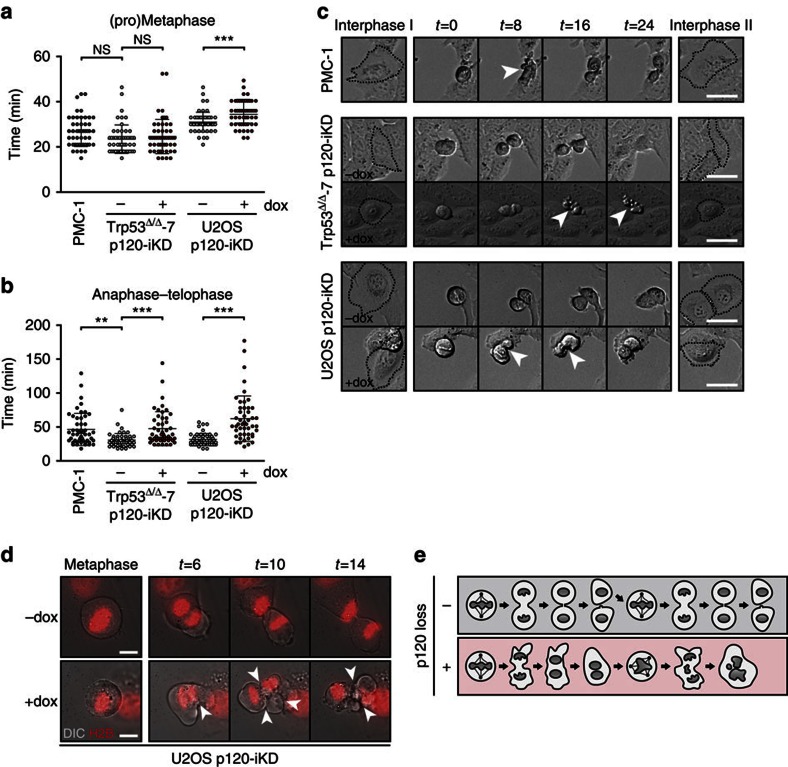
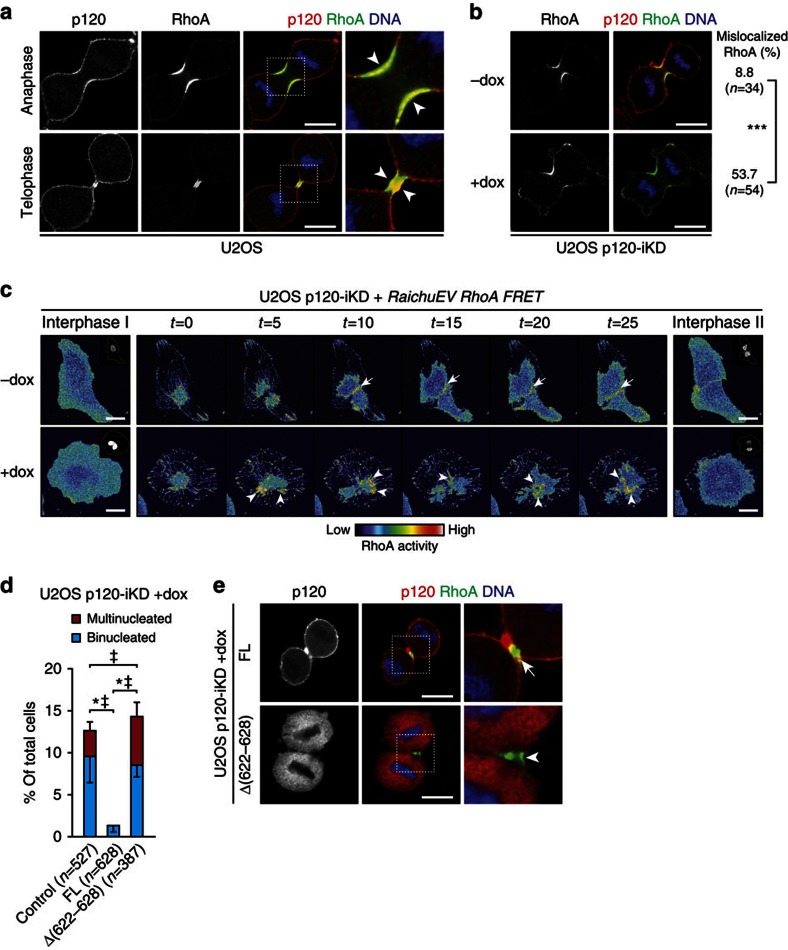
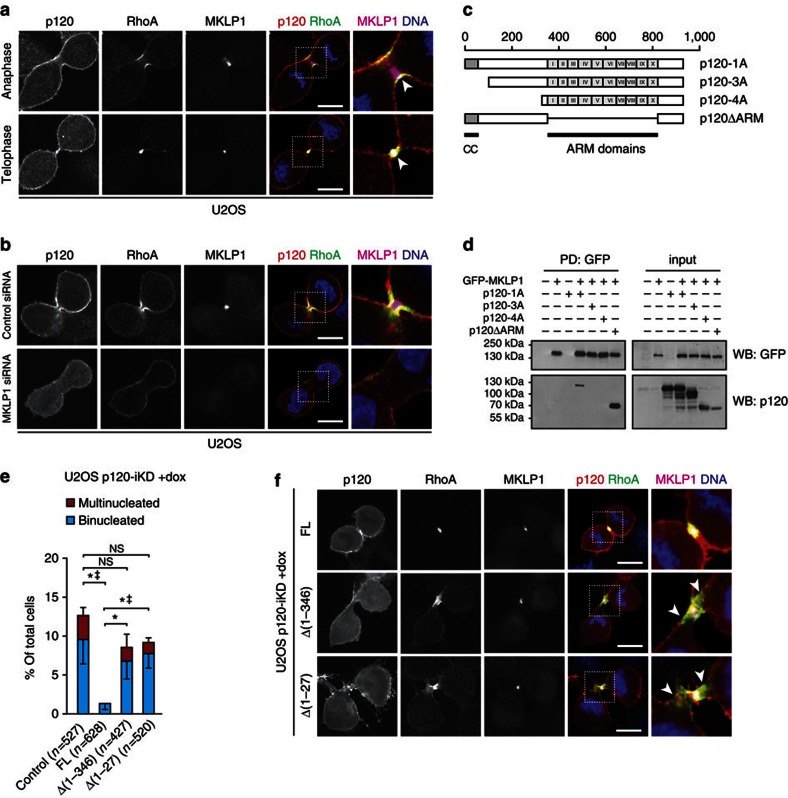
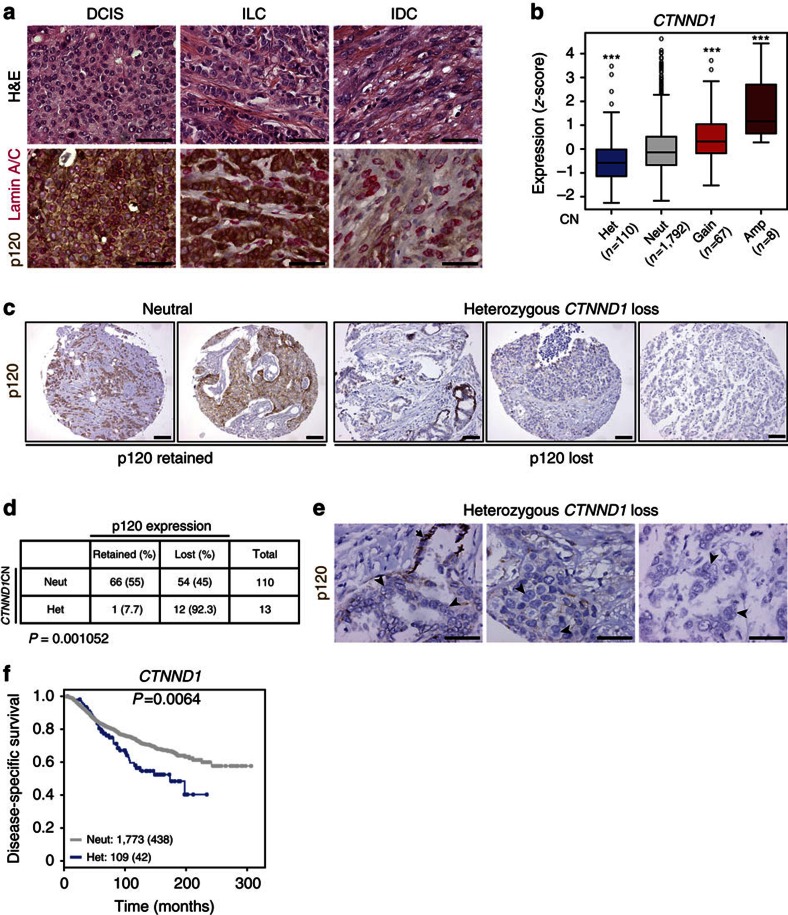
Spatiotemporal activation of RhoA and actomyosin contraction underpins cellular adhesion and division. Loss of cell-cell adhesion and chromosomal instability are cardinal events that drive tumour progression. Here, we show that p120-catenin (p120) not only controls cell-cell adhesion, but also acts as a critical regulator of cytokinesis. We find that p120 regulates actomyosin contractility through concomitant binding to RhoA and the centralspindlin component MKLP1, independent of cadherin association. In anaphase, p120 is enriched at the cleavage furrow where it binds MKLP1 to spatially control RhoA GTPase cycling. Binding of p120 to MKLP1 during cytokinesis depends on the N-terminal coiled-coil domain of p120 isoform 1A. Importantly, clinical data show that loss of p120 expression is a common event in breast cancer that strongly correlates with multinucleation and adverse patient survival. In summary, our study identifies p120 loss as a driver event of chromosomal instability in cancer.


Conflict of interest statement

The authors declare no competing financial interests.

Figures

Figure 1
Figure 1. Loss of p120 induces multinucleation and chromosomal instability.
(a) Mammary-specific conditional female mice mutant for p120 and p53 (WAPcre;Ctnnd1F/F;Trp53F/F), E-cadherin and p53 (WAPcre;Cdh1F/F;Trp53F/F) or p53 alone (WAPcre;Trp53F/F) were stained for p120. Note the overt multinucleation in the p120 knockout mammary carcinoma cells (arrow) and the prominent influx of p120 expressing immune cells (macrophages; arrow head). Tissue architecture and nuclear morphology were visualized by H&E stainings. Scale bar, 50 μm. (b) Immunofluorescence (IF) imaging of cell lines (Trp53Δ/Δ-7, mILC-1 and PMC-1) derived from the corresponding tumours shown in a. Scale bar, 10 μm. (c) Quantification of bi- and multinucleation in the cell lines shown in b. Statistical significance was determined using the χ2-test. *P<0.05/P<0.05 (binucleation and multinucleation, respectively). (d) Control (-dox) and dox-treated (+dox) mouse and human cancer cell lines transduced with an inducible p120KD were stained for p120 and Lamin A/C. Scale bar, 10 μm. (e) Quantification of bi- and multinucleation of the p120-iKD cell lines shown in d over three consecutive passages in the absence or presence of dox. At least 200 control and dox-treated cells were analysed every passage. (f) Quantification of centrosome numbers in interphase PMC-1, Trp53Δ/Δ-7 p120-iKD and U2OS p120-iKD cells. Centrosome numbers were determined by IF staining for γ-tubulin. Statistical significance in c,e and f was determined using the χ2-test. *P<0.05/P<0.05 (binucleation and multinucleation respectively). NS, not significant.
Figure 2
Figure 2. Multinucleation induced by p120 loss occurs independent of cadherin association.
(a) Quantification of bi- and multinucleation in control and dox-treated E-cadherin-deficient mILC-1 p120-iKD cells over three consecutive passages of dox-treated in the presence of dox. Statistical significance was determined using the χ2-test. *P<0.05/P<0.05 (binucleation and multinucleation respectively). (b) IF of p120 and E-cadherin in dox-treated U2OS p120-iKD cells reconstituted with FL p120-1A or p120-1A K401M. Right panels show magnifications of representative areas denoted by the dotted squares. Scale bar, 10 μm. (c) Quantification of bi- and multinucleation in dox-treated U2OS p120-iKD reconstituted with empty vector (control), p120-1A FL or p120-1A K401M. Statistical significance was determined using the Student’s t-test. Shown are data from three independent experiments. Results are expressed as mean±s.d. *P<0.05/P<0.05 (binucleation and multinucleation, respectively).
Figure 3
Figure 3. Loss of p120 induces cytokinesis defects.
(a,b) Quantifications of the length of (a) early mitosis (pro-metaphase and metaphase) and (b) late mitosis/cytokinesis (anaphase and telophase) in PMC-1, control and dox-treated Trp53Δ/Δ-7 p120-iKD and U2OS p120-iKD cell lines. Statistical significance was determined using the Student’s t-test. *P<0.05, **P<0.01, ***P<0.001. (c) Time-lapse imaging of PMC-1, and control and dox-treated Trp53Δ/Δ-7 p120-iKD and U2OS p120-iKD cells. Shown are 10X DIC images. Scale bar, 25 μm. (d) High-magnification time-lapse imaging of H2B-mCherry expressing control and dox-treated U2OS p120-iKD. Shown are × 100 images. Arrowheads depict severe membrane deformation in dox-treated anaphase cells leading to cytokinesis failure. Scale bar, 10 μm. (e) Loss of p120 induces binucleation through cytokinesis defects during anaphase. During subsequent cell divisions, this can give rise to chromosomal instability and aneuploidy in cancer cells due to the presence of extra centrosomes.
Figure 4
Figure 4. p120 regulates RhoA activity on the equatorial cortex during cytokinesis.
(a) IF for p120 and RhoA in anaphase and telophase U2OS cells. Note the accumulation of p120 and co-localization on the equatorial cortex (arrowheads). Right panels show magnifications of representative areas denoted by the dotted squares. Scale bar, 10 μm. (b) IF for p120 and RhoA in control and dox-treated U2OS p120-iKD cells. Scale bar, 10 μm. Quantifications show the percentage of control and dox-treated U2OS p120-iKD cells with RhoA-positive membrane protrusions during anaphase. ***P<0.001. Statistical significance was determined using the χ2-test. (c) Time-lapse stills of control and dox-treated U2OS p120-iKD cells expressing the RaichuEV RhoA FRET probe. Note the focused RhoA zone in control cells (upper panels; arrows), whereas RhoA activity is non-focused and oscillates in dox-treated U2OS p120-iKD cells leading to cytokinesis failure (lower panels; arrowheads). Insets show H2B-mCherry channels. Scale bar, 20 μm. (d) Quantification of bi- and multinucleation in dox-treated U2OS p120-iKD reconstituted with empty vector (control), FL p120-1A or the RhoA-binding mutant p120-1AΔ[622–628]. Statistical significance was determined using the Student’s t-test. Shown are the data from three independent experiments. Results are expressed as mean±s.d. *P<0.05/P<0.05 (binucleation and multinucleation, respectively). (e) IF for p120 and RhoA in dox-treated U2OS p120-IKD cells reconstituted with FL p120-1A or p120-1AΔ[622–628]. Note the absence of co-localization of RhoA and p120 in p120-1AΔ[622–628]-expressing cells (arrowhead) compared with cells reconstituted with p120-A FL (arrow). Scale bar, 10 μm.
Figure 5
Figure 5. p120 interacts with MKLP1 to regulate focused RhoA activity during cytokinesis.
(a) IF for p120, RhoA and MKLP1 in anaphase and telophase U2OS. Note the co-localization of p120, RhoA and MKLP1 at the equatorial cortex (arrowheads). Right panels show representative magnifications of representative areas denoted by the dotted squares. Scale bar, 10 μm. (b) IF for p120, RhoA and MKLP1 in U2OS cells transfected with control and MKLP1-specific siRNAs. Right panels show magnifications of representative areas denoted by the dotted squares. Scale bar, 10 μm. (c) Overview of the different p120 constructs used. CC=coiled-coil domains, ARM=Armadillo. Scale bar denotes the amino acid position. (d) Western blot showing the co-immunoprecipitations for GFP-MKLP1 and p120 constructs described in c. (e) Quantification of bi- and multinucleation in dox-treated U2OS p120-iKD reconstituted with empty vector (control), FL p120-1A, p120-1AΔ[1–346], and p120-1AΔ[1–27]. Statistical significance was determined using the Student’s t-test. Shown are the data from three independent experiments. Results are expressed as mean±s.d. *P<0.05/P<0.05 (binucleation and multinucleation, respectively). (f) IF for p120, RhoA and MKLP1 in dox-treated U2OS p120-iKD cells reconstituted with FL p120-1A, p120-1AΔ[1–346] and p120-1AΔ[1–27]. Note the broadened RhoA zone in cells reconstituted with p120-1AΔ[1–346] and p120-1AΔ[1–27] (arrowheads). Scale bar, 10 μm.
Figure 6
Figure 6. Heterozygous CTNND1 loss correlates with loss of expression and decreased patient survival.
(a) Immunohistochemistry (IHC) showing p120 and LaminA/C expression in human ductal carcinoma in situ (DCIS), invasive lobular carcinoma (ILC) and invasive ductal carcinoma (IDC). Scale bar, 50 μm. (b) Box plot showing the relation between CTNND1 copy-number status (CN) and p120 mRNA expression. Shown are heterozygous (het), neutral (neut), gain and amplified (amp) CN status. Statistical significance was determined using pair-wise Tukey’s testing with the neutral copy-number group. ***P<0.001. (c)Tissue micro-array (TMA) cores of human breast cancer were stained and scored for p120. Shown are representative images of tumours neutral and heterozygous for CTNND1 that were scored as positive (retained) or negative (lost) for p120 protein expression. Scale bar, 100 μm. (d) Quantification of p120 expression correlated to CTNND1 copy number (CN) of TMA cores of human mammary carcinomas. Significance was determined using the Fisher’s exact test. (e) IHC showing p120 expression in human breast carcinomas with heterozygous genomic loss of CTNND1. Note the abnormal nuclear morphology in p120-deficient tumour cells (arrowheads) compared with p120 expressing cells (arrow). Scale bar, 50 μm. (f) Kaplan–Meier curve showing disease-specific survival of breast cancer patients displaying neutral CTNND1 CN (grey; n=1,773) or heterozygous loss of CTNND1 (blue; n=109). Statistical significance was determined using the log-rank test. Censored events are shown as dots and depicted between parentheses.

Similar articles

Cited by

References

    1. Lengauer C., Kinzler K. W. & Vogelstein B. Genetic instability in colorectal cancers. Nature 386, 623–627 (1997). - PubMed
    1. Storchova Z. & Kuffer C. The consequences of tetraploidy and aneuploidy. J. Cell Sci. 121, 3859–3866 (2008). - PubMed
    1. Ganem N. J., Godinho S. A. & Pellman D. A mechanism linking extra centrosomes to chromosomal instability. Nature 460, 278–282 (2009). - PMC - PubMed
    1. Krajcovic M. et al.. A non-genetic route to aneuploidy in human cancers. Nat. Cell Biol. 13, 324–330 (2011). - PMC - PubMed
    1. Hernando E. et al.. Rb inactivation promotes genomic instability by uncoupling cell cycle progression from mitotic control. Nature 430, 797–802 (2004). - PubMed

Publication types