

Intratumoral Th2 predisposition combines with an increased Th1 functional phenotype in clinical response to intravesical BCG in bladder cancer
- PMID: 28005163
- PMCID: PMC5359386
- DOI: 10.1007/s00262-016-1945-z
Intratumoral Th2 predisposition combines with an increased Th1 functional phenotype in clinical response to intravesical BCG in bladder cancer
Abstract
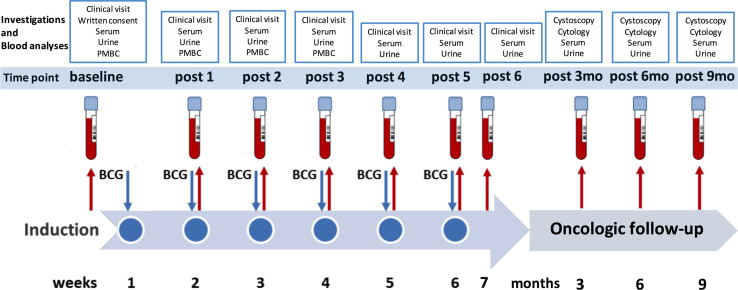
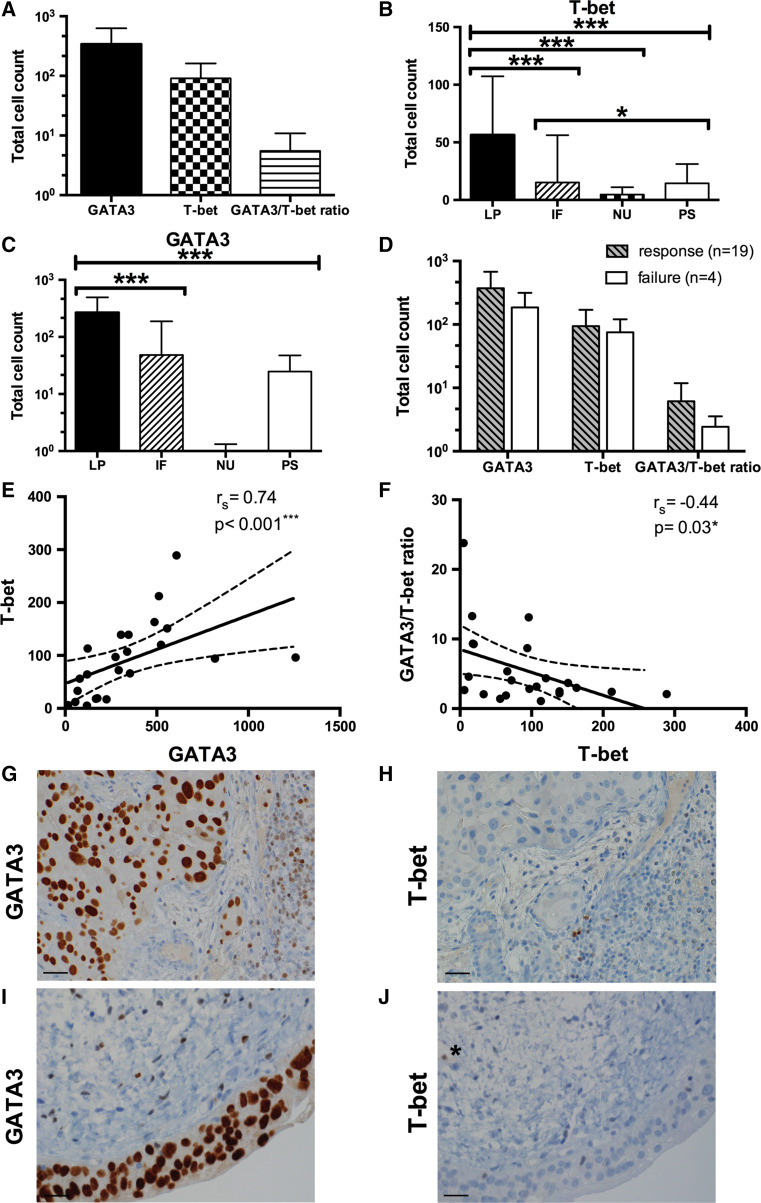
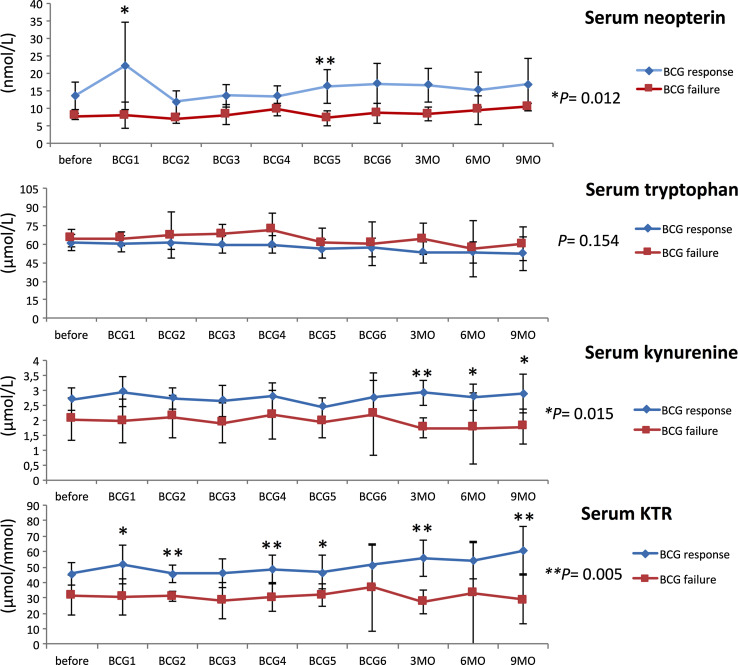
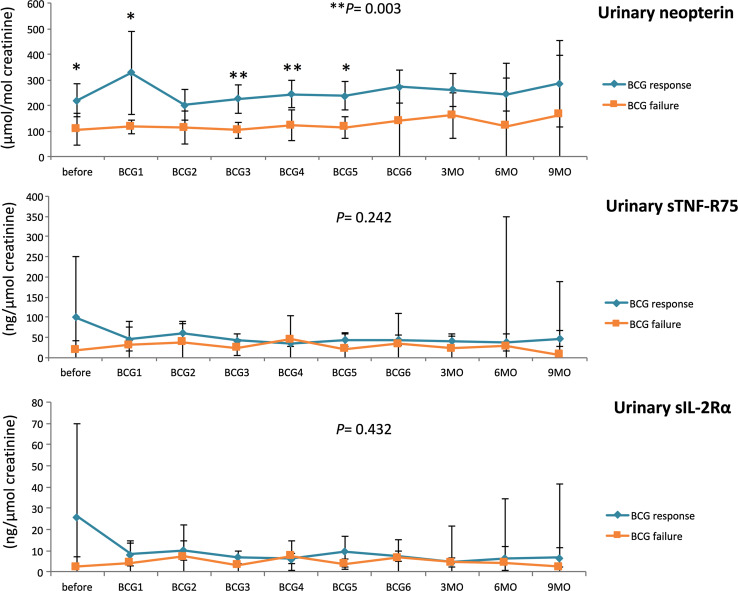
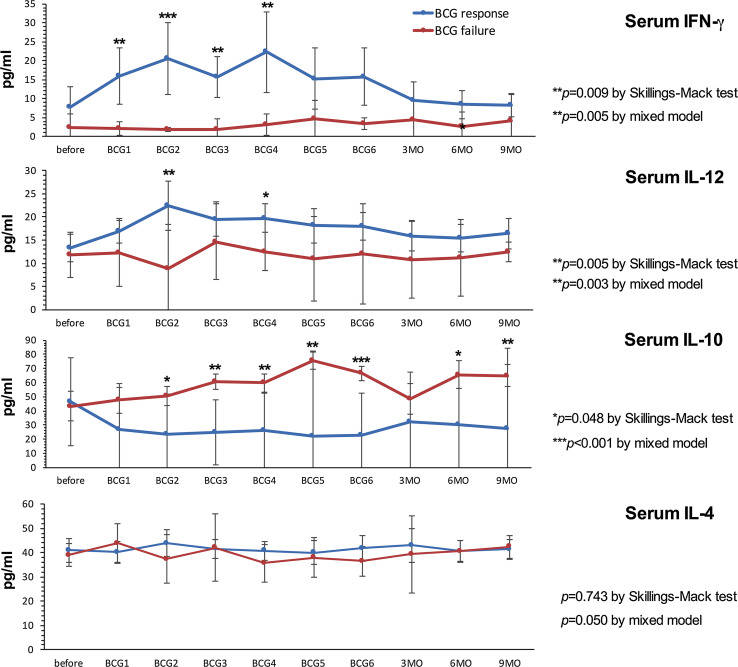
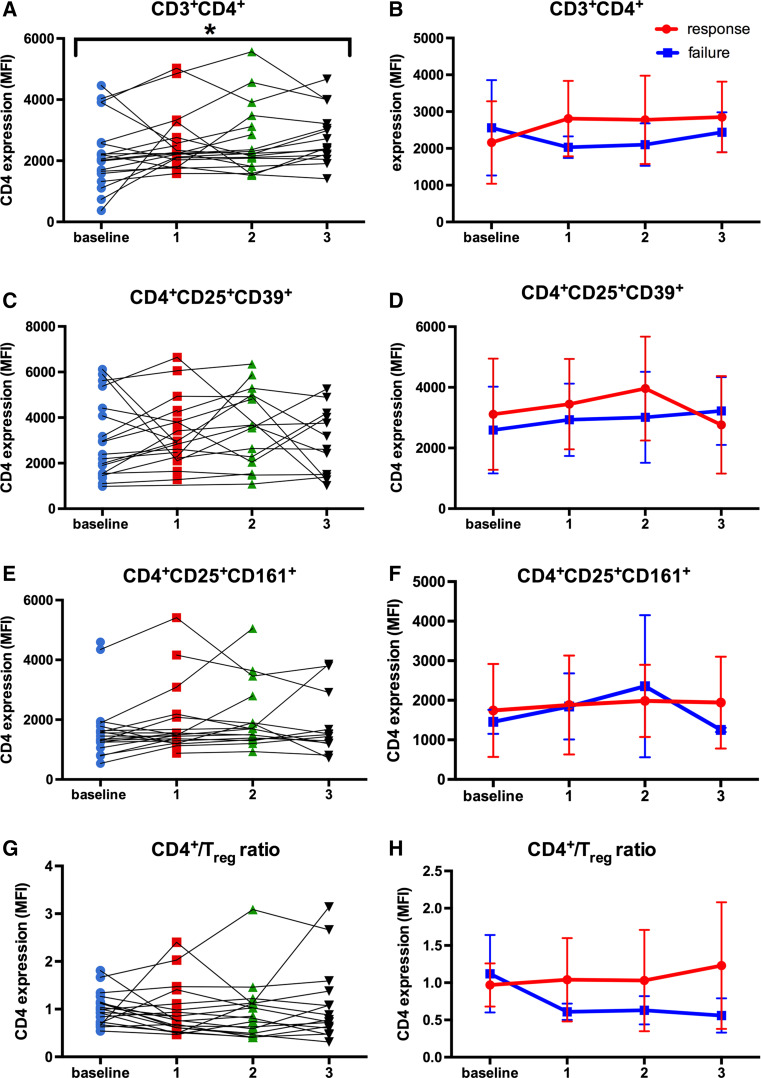
Th1-type immunity is considered to be required for efficient response to BCG in bladder cancer, although Th2 predisposition of BCG responders has recently been reported. The aim was to evaluate the relationship of Th1 and Th2 components in 23 patients undergoing BCG treatment. Peripheral blood, serum and urine samples were prospectively collected at baseline, during and after BCG. Th1 (neopterin, tryptophan, kynurenine, kynurenine-to-tryptophan ratio (KTR), IL-12, IFN-γ, soluble TNF-R75 and IL-2Rα) and Th2 (IL-4, IL-10) biomarkers as well as CD4 expression in T helper (Th), effector and regulatory T cells were determined. Local immune cell subsets were measured on formalin-fixed, paraffin-embedded cancer tissue by immunohistochemistry to examine expression of transcription factors that control Th1 (T-bet) and Th2-type (GATA3) immunity. We confirmed a Th2 predisposition with a mean GATA3/T-bet ratio of 5.51. BCG responders showed significantly higher levels of urinary (p = 0.003) and serum neopterin (p = 0.012), kynurenine (p = 0.015), KTR (p = 0.005), IFN-γ (p = 0.005) and IL-12 (p = 0.003) during therapy, whereas levels of IL-10 decreased significantly (p < 0.001) compared to non-responders. GATA3/T-bet ratio correlated positively with serum neopterin (p = 0.008), IFN-γ (p = 0.013) and KTR (p = 0.018) after the first BCG instillation. We observed a significant increase in CD4 expression in the Th cell population (p < 0.05), with only a modest tendency toward higher frequency in responders compared to non-responders (p = 0.303). The combined assessment of GATA3/T-bet ratio, neopterin and KTR may be a useful biomarker in predicting BCG response. Th2-promoting factors such as GATA3 may trigger Th1-type immune responses and thus contribute to the BCG success.
Keywords: BCG; Bladder cancer; GATA3; Neopterin; T cells; T-bet.
Conflict of interest statement
There are no competing financial interests to disclose.
Figures
Similar articles
-
Serum Th1 and Th2 cytokine balance in patients of superficial transitional cell carcinoma of bladder pre- and post-intravesical combination immunotherapy.Immunopharmacol Immunotoxicol. 2010 Jun;32(2):348-56. doi: 10.3109/08923970903300151. Immunopharmacol Immunotoxicol. 2010. PMID: 20105083 Clinical Trial.
-
Predicting response to bacillus Calmette-Guérin (BCG) in patients with carcinoma in situ of the bladder.Urol Oncol. 2014 Jan;32(1):45.e23-30. doi: 10.1016/j.urolonc.2013.06.008. Epub 2013 Sep 18. Urol Oncol. 2014. PMID: 24055426 Free PMC article.
-
Importance of urinary interleukin-18 in intravesical immunotherapy with bacillus calmette-guérin for superficial bladder tumors.Urol Int. 2005;75(2):114-8. doi: 10.1159/000087163. Urol Int. 2005. PMID: 16123563
-
Th1 cytokine-secreting recombinant Mycobacterium bovis bacillus Calmette-Guérin and prospective use in immunotherapy of bladder cancer.Clin Dev Immunol. 2011;2011:728930. doi: 10.1155/2011/728930. Epub 2011 Sep 15. Clin Dev Immunol. 2011. PMID: 21941579 Free PMC article. Review.
-
IMMUNOTHERAPY OF BLADDER CANCER. BCG VACCINE: PRINCIPLES OF ACTION, EFFICACY AND SAFETY.Eksp Klin Farmakol. 2016;79(10):34-43. Eksp Klin Farmakol. 2016. PMID: 30085482 Review. English, Russian.
Cited by
-
Expression of ADAM Proteases in Bladder Cancer Patients with BCG Failure: A Pilot Study.J Clin Med. 2021 Feb 14;10(4):764. doi: 10.3390/jcm10040764. J Clin Med. 2021. PMID: 33672843 Free PMC article.
-
Combined assessment of peritumoral Th1/Th2 polarization and peripheral immunity as a new biomarker in the prediction of BCG response in patients with high-risk NMIBC.Oncoimmunology. 2019 Apr 13;8(8):1602460. doi: 10.1080/2162402X.2019.1602460. eCollection 2019. Oncoimmunology. 2019. PMID: 31413912 Free PMC article.
-
Bladder cancer, a unique model to understand cancer immunity and develop immunotherapy approaches.J Pathol. 2019 Oct;249(2):151-165. doi: 10.1002/path.5306. Epub 2019 Jun 24. J Pathol. 2019. PMID: 31102277 Free PMC article. Review.
-
Prediction of BCG responses in non-muscle-invasive bladder cancer in the era of novel immunotherapeutics.Int Urol Nephrol. 2019 Jul;51(7):1089-1099. doi: 10.1007/s11255-019-02183-5. Epub 2019 Jun 1. Int Urol Nephrol. 2019. PMID: 31154583 Review.
-
Identification of the prognostic value of Th1/Th2 ratio and a novel prognostic signature in basal-like breast cancer.Hereditas. 2023 Jan 25;160(1):2. doi: 10.1186/s41065-023-00265-0. Hereditas. 2023. PMID: 36694223 Free PMC article.
References
-
- Babjuk M, Burger M, Zigeuner R, Shariat SF, van Rhijn BW, Compérat E, Sylvester RJ, Kaasinen E, Böhle A, Palou Redorta J, Rouprêt M, European Association of Urology EAU guidelines on non-muscle-invasive urothelial carcinoma of the bladder: update 2013. Eur Urol. 2013;64(4):639–653. doi: 10.1016/j.eururo.2013.06.003. - DOI - PubMed
-
- Morales A, Eidinger D, Bruce AW. Intracavitary Bacillus Calmette-Guerin in the treatment of superficial bladder tumors. J Urol. 1976;116(2):180–183. - PubMed
MeSH terms
Substances
LinkOut - more resources
Full Text Sources
Other Literature Sources
Medical
Research Materials
