. 2016 Dec;36 Suppl 1(Suppl 1):S2-S11.
doi: 10.1097/IAE.0000000000001287.

SWEPT-SOURCE OPTICAL COHERENCE TOMOGRAPHY ANGIOGRAPHY REVEALS CHORIOCAPILLARIS ALTERATIONS IN EYES WITH NASCENT GEOGRAPHIC ATROPHY AND DRUSEN-ASSOCIATED GEOGRAPHIC ATROPHY

Affiliations

SWEPT-SOURCE OPTICAL COHERENCE TOMOGRAPHY ANGIOGRAPHY REVEALS CHORIOCAPILLARIS ALTERATIONS IN EYES WITH NASCENT GEOGRAPHIC ATROPHY AND DRUSEN-ASSOCIATED GEOGRAPHIC ATROPHY

Eric M Moult et al. Retina. 2016 Dec.

Abstract

Purpose: To investigate choriocapillaris (CC) alteration in patients with nascent geographic atrophy (nGA) and/or drusen-associated geographic atrophy (DAGA) using swept-source optical coherence tomography angiography (OCTA).

Methods: A 1,050-nm wavelength, 400 kHz A-scan rate swept-source optical coherence tomography prototype was used to perform volumetric swept-source optical coherence tomography angiography over 6 mm × 6 mm fields of view in patients with nGA and/or DAGA. The resulting optical coherence tomography (OCT) and OCTA data were analyzed using a combination of en face and cross-sectional techniques. Variable interscan time analysis (VISTA) was used to differentiate CC flow impairment from complete CC atrophy.

Results: A total of 7 eyes from 6 patients (mean age: 73.8 ± 5.7 years) were scanned. Seven areas of nGA and three areas of DAGA were identified. Analysis of cross-sectional OCT and OCTA images identified focal alterations of the CC underlying all seven areas of nGA and all three areas of DAGA. En face OCTA analysis of the CC revealed diffuse CC alterations in all eyes. Variable interscan time analysis processing suggested that the observed CC flow alterations predominantly corresponded to flow impairment rather than complete CC atrophy.

Conclusion: The OCTA imaging of the CC revealed focal CC flow impairment associated with areas of nGA and DAGA, as well as diffuse CC flow impairment throughout the imaged field. En face OCT analysis should prove useful for understanding the pathogenesis of nGA and DAGA and for identifying the formation of nGA and DAGA as endpoints in therapeutic trials.


Conflict of interest statement

There are no conflicting relationships for any other author.

Figures
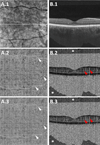
Figure 1
Figure 1
En face and cross-sectional optical coherence tomography (OCT) and OCT angiography (OCTA) data from a 45 year old normal control. (A.1) En face mean projection of the OCT volume through the 330 µm immediately below the segmented Bruch’s membrane. (A.2) En face mean projection of the ~1.5 ms interscan time OCTA volume through the ~90 µm immediately below the segmented Bruch’s membrane. (A.3) En face mean projection of the ~3.0 ms interscan time OCTA volume over the same depths as in A.2. (B.1) OCT B-scan taken from the dashed white arrow in A.1. (B.2) ~1.5 ms interscan time OCTA B-scan taken at the same location. (B.3) ~3.0 ms interscan time OCTA B-scan taken at the same location. Note that since the OCTA data are not thresholded, there is necessarily a high decorrelation signal in the regions of low OCT signal, in particular in the vitreous and deep choroid. The grid-like pattern that appears in the en face OCTA images A.2 and A.3, and consists of vertically and horizontally oriented stripes of relative brightness, is a residual motion artifact that is not completely eliminated in the process of merging two orthogonally acquired volumes. The brightness variation, marked with the asterisks, occurring in the OCTA B-scans is also an artifact of volume merging, occurring in regions only covered by one of the two orthogonally acquired volumes. Finally, note that OCTA decorrelation tails, also referred to as projection artifacts, are present in both the en face (white arrows) and cross-sectional (red arrows) OCTA images.
Figure 2
Figure 2
This figure illustrates the diffuse CC flow impairment apparent in en face OCTA images of eyes with nGA and/or DAGA lesions. Note that the CC flow impairment is more apparent in the 1.5 ms interscan time OCTA (fourth row) than the 3.0 ms interscan time OCTA (fifth row). Focal, lesion-associated CC alteration is present, but only manifest underlying certain lesions (most prominently L1 and L5); focal CC alteration is most evident with cross-sectional analysis, as shown in Figure 3. (A.1–A.5) 65 year old male; (B.1–B.5) fellow eye of same patient; (C.1–C.5) 74 year old female; (D.1–D.5) 73 year old female; (E.1–E.5) 75 year old male. For each patient, the first column is the color fundus photograph, cropped over the 6 mm × 6 mm region corresponding to the OCT field; the second column is the FAF, cropped over the 6 mm × 6 mm region corresponding to the OCT field; the third column is the en face mean projection of the OCT volume through the 330 µm immediately below the segmented Bruch’s membrane; the fourth column is the en face mean projection of the ~1.5 ms interscan time OCTA volume through the ~90 µm immediately below the segmented Bruch’s membrane; and the fifth column is the en face mean projection of the ~3.0 ms interscan time OCTA volume through the same depth. All OCT and OCTA images correspond to a 6 mm × 6 mm field of view. Note that the black rectangles appearing in the en face OCT and OCTA images are motion artifacts, and correspond to regions where there was no reliable OCT signal from either of the merged volumes. The black arrow head points to the lesion identified as having atrophy on fundus photography; yellow arrow heads point to lesions identified as having no atrophy on fundus photography. White arrow heads correspond to lesions identified as having hypo-autofluorescence on FAF; the red arrow head corresponds to the lesion identified as having mixed-autofluorescence on FAF; the green arrow head corresponds to the lesion identified as having hyper-autofluorescence on FAF; and the blue arrow head corresponds to the lesion identified as having normal autofluorescence on FAF. The dashed white arrows in the third column, labelled L1–L7, intersect the identified nGA and DAGA lesions, and are from where the cross-sectional images of Figure 3 were extracted. Underlined lettering indicates the DAGA lesions; the others are nGA lesions. Note that in (A–D).3, the nGA and DAGA lesions are easily visualized as a well-defined focal region of increased light penetration. In E.3, the lesion is still visible as an area of increased light penetration, but its contrast from the rest of the field is lower than in the other cases. In all cases, there is diffuse CC alteration. Furthermore, increasing the interscan time from ~1.5 ms to ~3.0 ms increases the OCTA signal in all cases, suggesting that we are observing CC flow impairment, rather than total CC atrophy.
Figure 3
Figure 3
This figure illustrates the focal CC flow impairment underlying nGA and DAGA lesions. Each row, L1–L7, was extracted from the corresponding dashed arrow in Figure 2. Underlined lettering indicates the DAGA lesions; the others are nGA lesions. The first column shows the OCT B-scan; the second the ~1.5 ms interscan time OCTA B-scan; and the third the ~3.0 ms interscan time OCTA B-scan. Columns four through six show enlargements of the dashed white boxes shown in columns one through three, respectively. Close examination of the OCTA cross-sections reveals low OCTA signal associated with the regions of nGA and DAGA. Visualizing this alteration is complicated in L2 and L7. In L2, OCTA decorrelation tails from an overlying retinal vessel obfuscate the central region of the CC flow impairment; this can been seen by tracing down the decorrelation tail in L2.2, and L2.3, and by noting the characteristic decorrelation streak appearing in the RPE region, indicated by the arrowheads in L2.5 and L2.6. In the case of L7, we can see a larger choroidal vessel, indicated by the asterisk in L7.4, lying directly beneath the lesion of interest. This larger vessel causes an increase in the OCTA signal, limiting the depth persistence of the CC alteration to only a few pixels. Both of these complications are considered in more detail in the Discussion section of this paper.
Figure 4
Figure 4
This figure illustrates how underlying choroidal vasculature can complicate OCTA analysis of the CC. Top row corresponds to 6 mm × 6 mm en face OCT and OCTA images from the same eye as in Figure 2, row C; bottom row corresponds to enlargements of the dashed white boxes shown in the top row. (A) En face mean projection of the OCT volume through the 330 µm immediately below the segmented Bruch’s membrane (same as Figure 2, subpanel C.3); (B) en face mean projection of the ~1.5 ms interscan time OCTA volume through the ~90 µm immediately below the segmented Bruch’s membrane (same as Figure 2, subpanel C.4); (C) single, 4.4 µm en face slice of the OCT volume, located ~90 µm below the segmented Bruch’s membrane; and (D) single, 4.4 µm en face slice of the ~1.5 ms interscan time OCTA volume, located ~90 µm below the segmented Bruch’s membrane. In (B–D).2, two choroidal vessels are visible in the region underlying the lesion (arrow heads). These vessels are not visible in (A.2), underscoring that en face OCT projection is less influenced by the underlying choroidal vessels than en face OCTA projection. The asterisk marks an area of decreased OCTA signal.

Similar articles

Cited by

References

    1. Rein DB, Wittenborn JS, Zhang X, et al. Forecasting age-related macular degeneration through the year 2050: The potential impact of new treatments. Archives of Ophthalmology. 2009;127:533–540. - PubMed
    1. Sarks JP, Sarks SH, Killingsworth MC. Evolution of Geographic Atrophy of the Retinal-Pigment Epithelium. Eye. 1988;2:552–577. - PubMed
    1. McLeod DS, Grebe R, Bhutto I, et al. Relationship between RPE and Choriocapillaris in Age-Related Macular Degeneration. Investigative Ophthalmology & Visual Science. 2009;50:4982–4991. - PMC - PubMed
    1. Mullins RE, Johnson MN, Faidley EA, et al. Choriocapillaris Vascular Dropout Related to Density of Drusen in Human Eyes with Early Age-Related Macular Degeneration. Investigative Ophthalmology & Visual Science. 2011;52:1606–1612. - PMC - PubMed
    1. Bhutto I, Lutty G. Understanding age-related macular degeneration (AMD): Relationships between the photoreceptor/retinal pigment epithelium/Bruch's membrane/choriocapillaris complex. Molecular Aspects of Medicine. 2012;33:295–317. - PMC - PubMed