

Far from Naturalness: How Much Does Spatial Ecological Structure of European Tree Assemblages Depart from Potential Natural Vegetation?
- PMID: 28005931
- PMCID: PMC5179244
- DOI: 10.1371/journal.pone.0165178
Far from Naturalness: How Much Does Spatial Ecological Structure of European Tree Assemblages Depart from Potential Natural Vegetation?
Abstract
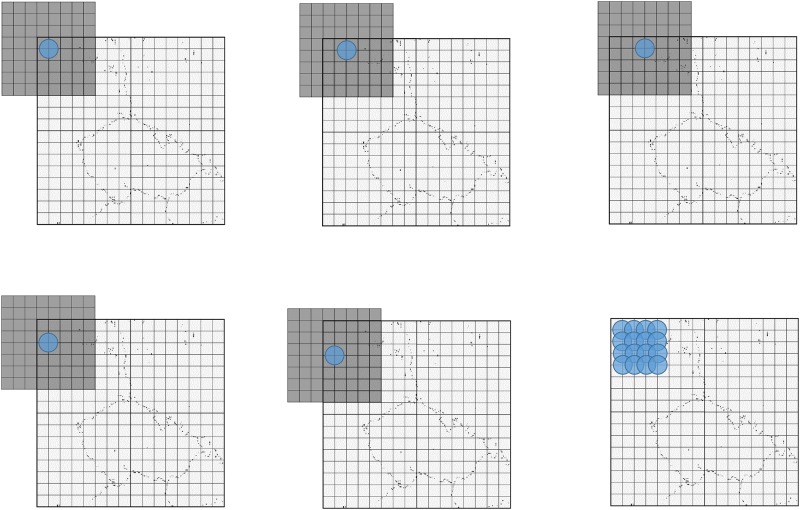
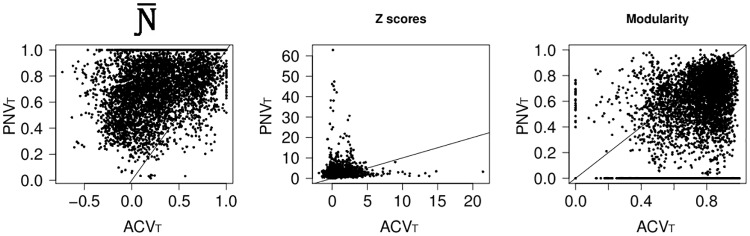
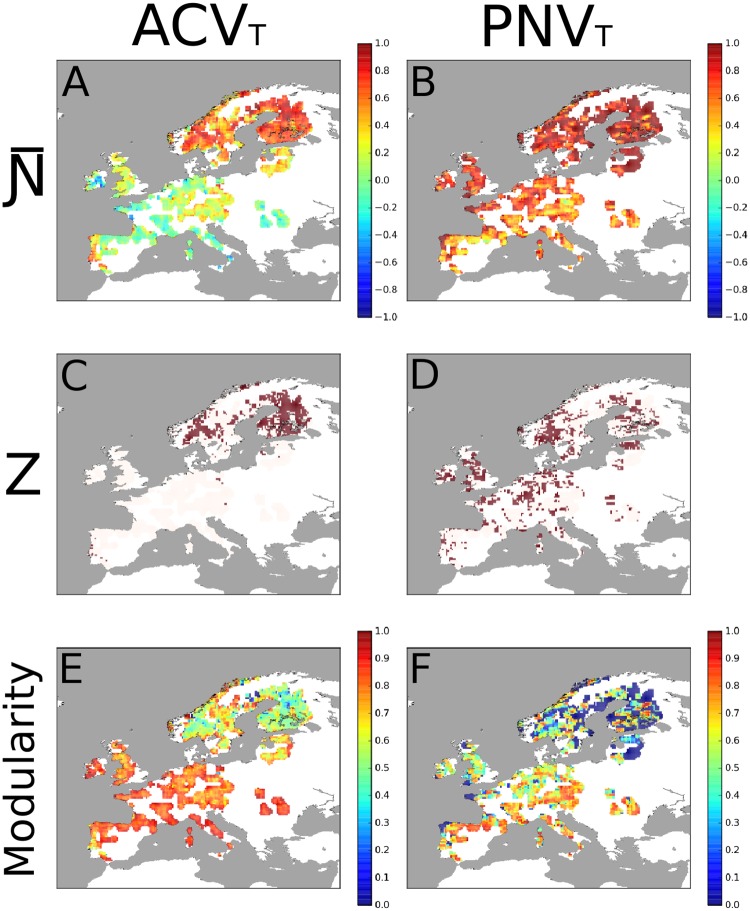
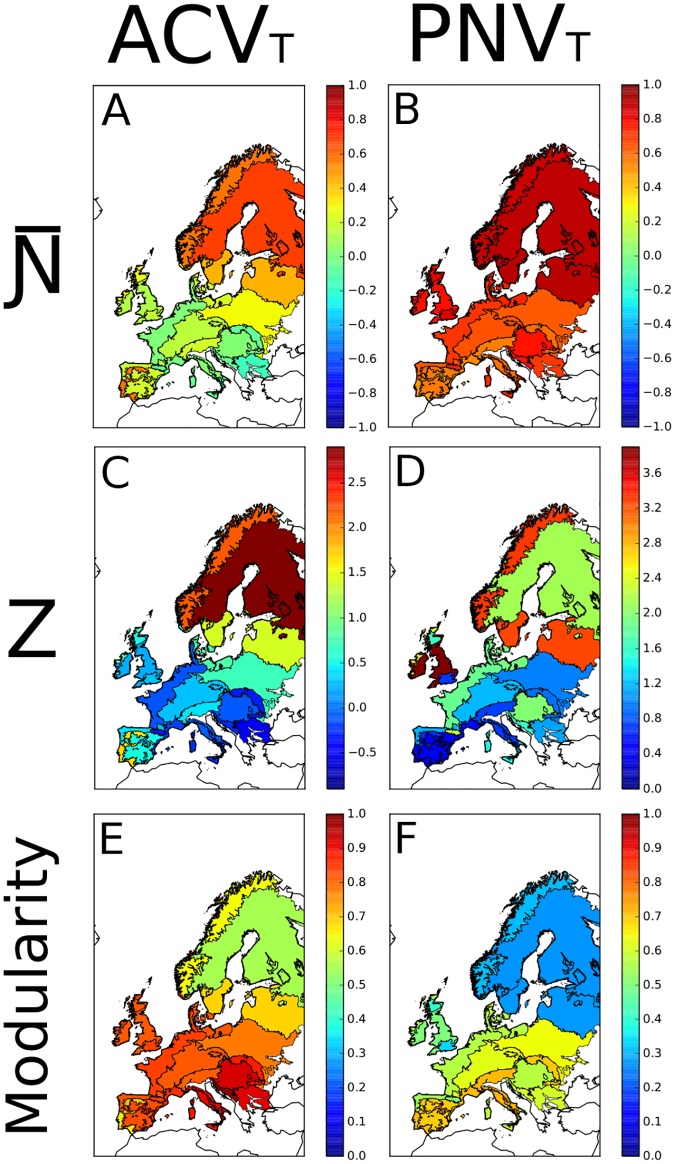
Contemporaneous plant communities may retain a mark of past disturbances in their ecological patterns. However, unraveling the history of disturbance on natural systems at a large scale is often unfeasible, due to the complexity of the factors involved and lack of historical data. Here we aim at demonstrating how comparing observed spatial structure of tree assemblages with that expected in a hypothetical, undisturbed scenario can shed light on how natural European forests are. Borrowing an analytical approach developed in the field of network analysis, we assessed how much the observed ecological patterns of nestedness (i.e. positive co-occurrence), segregation (i.e. negative co-occurrence), and modularity in tree assemblages deviate from randomness, and from those projected by Potential Natural Vegetation (PNV) geobotanical expert assessments. We found clear evidence that European forests are far from a natural condition, showing only moderate signals (especially at higher latitudes) of the ecological spatial structure typical of undisturbed vegetation (i.e. nestedness). Our results highlight how taking into account spatial structure along with diversity can be a fundamental tool to address this problem and assess the degree of naturalness in species assemblages.
Conflict of interest statement
The authors have declared that no competing interests exist.
Figures
Similar articles
-
Landscape development, forest fires, and wilderness management.Science. 1974 Nov 8;186(4163):487-95. doi: 10.1126/science.186.4163.487. Science. 1974. PMID: 17790369
-
Influence of matrix type on tree community assemblages along tropical dry forest edges.Am J Bot. 2014 May;101(5):820-9. doi: 10.3732/ajb.1300396. Epub 2014 May 13. Am J Bot. 2014. PMID: 24824835
-
Waxing and waning of forests: Late Quaternary biogeography of southeast Africa.Glob Chang Biol. 2018 Jul;24(7):2939-2951. doi: 10.1111/gcb.14150. Epub 2018 Apr 27. Glob Chang Biol. 2018. PMID: 29700905
-
[A review on disturbance ecology of forest].Ying Yong Sheng Tai Xue Bao. 2004 Oct;15(10):1703-10. Ying Yong Sheng Tai Xue Bao. 2004. PMID: 15624796 Review. Chinese.
-
The ecology, distribution, conservation and management of large old trees.Biol Rev Camb Philos Soc. 2017 Aug;92(3):1434-1458. doi: 10.1111/brv.12290. Epub 2016 Jul 7. Biol Rev Camb Philos Soc. 2017. PMID: 27383287 Review.
Cited by
-
Accounting for forest condition in Europe based on an international statistical standard.Nat Commun. 2023 Jun 22;14(1):3723. doi: 10.1038/s41467-023-39434-0. Nat Commun. 2023. PMID: 37349309 Free PMC article.
-
EU-Trees4F, a dataset on the future distribution of European tree species.Sci Data. 2022 Feb 3;9(1):37. doi: 10.1038/s41597-022-01128-5. Sci Data. 2022. PMID: 35115529 Free PMC article.
-
EU-Forest, a high-resolution tree occurrence dataset for Europe.Sci Data. 2017 Jan 5;4:160123. doi: 10.1038/sdata.2016.123. Sci Data. 2017. PMID: 28055003 Free PMC article.
-
Archetypal typology of European forest ecosystems integrating management intensity and naturalness.Ambio. 2024 Nov;53(11):1587-1598. doi: 10.1007/s13280-024-02050-3. Epub 2024 Jul 11. Ambio. 2024. PMID: 38992337 Free PMC article.
References
-
- Brown JH. Macroecology. Chicago: University of Chicago Press; 1995.
-
- Gaston KJ, Blackburn TM. Pattern and Process in Macroecology. Oxford: Blackwell Scientific Publications; 2000.
-
- Lomolino MV, Riddle BR, Whittaker RJ, Brown JH. Biogeography, 4th edition Sunderland (MA): Sinauer Associates, Inc.; 2010.
-
- Verhoef HA, Morin PJ. Community ecology: processes, models, and applications. Oxford: Oxford University Press; 2010.
-
- Diez JM, Pulliam HR. Hierarchical analysis of species distributions and abundance across environmental gradients. Ecology. 2007;88: 3144–3152. - PubMed
MeSH terms
LinkOut - more resources
Full Text Sources
Other Literature Sources
Miscellaneous
