

Alterations of the Blood-Brain Barrier and Regional Perfusion in Tumor Development: MRI Insights from a Rat C6 Glioma Model
- PMID: 28005983
- PMCID: PMC5179246
- DOI: 10.1371/journal.pone.0168174
Alterations of the Blood-Brain Barrier and Regional Perfusion in Tumor Development: MRI Insights from a Rat C6 Glioma Model
Abstract
Objectives: Angiogenesis and anti-angiogenetic medications play an important role in progression and therapy of glioblastoma. In this context, in vivo characterization of the blood-brain-barrier and tumor vascularization may be important for individual prognosis and therapy optimization.
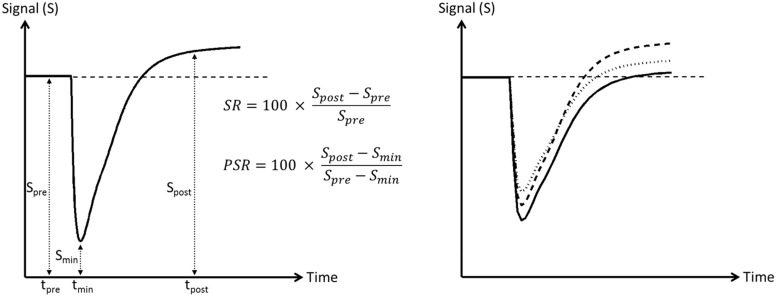
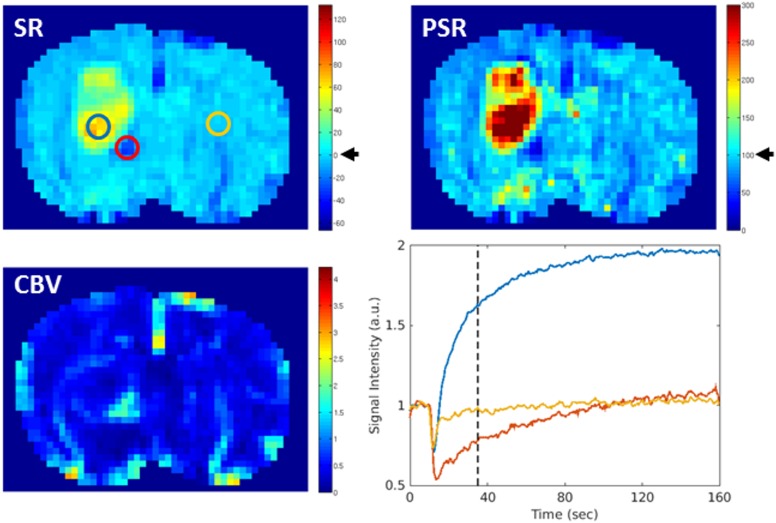
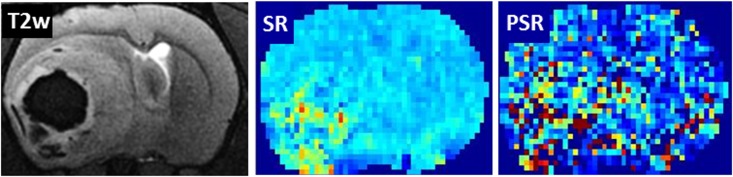
Methods: We analyzed perfusion and capillary permeability of C6-gliomas in rats at different stages of tumor-growth by contrast enhanced MRI and dynamic susceptibility contrast (DSC) MRI at 7 Tesla. The analyses included maps of relative cerebral blood volume (CBV) and signal recovery derived from DSC data over a time period of up to 35 days after tumor cell injections.
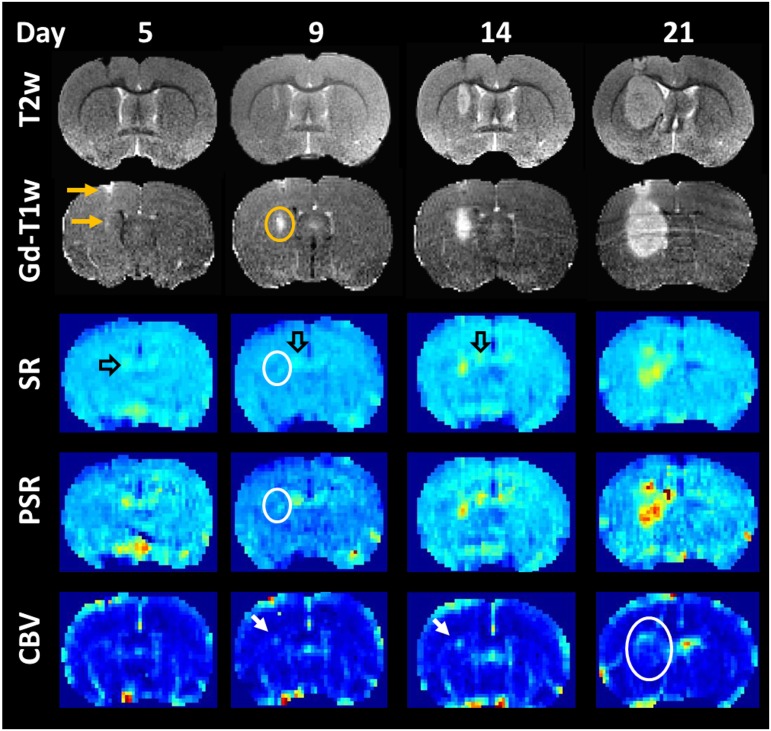
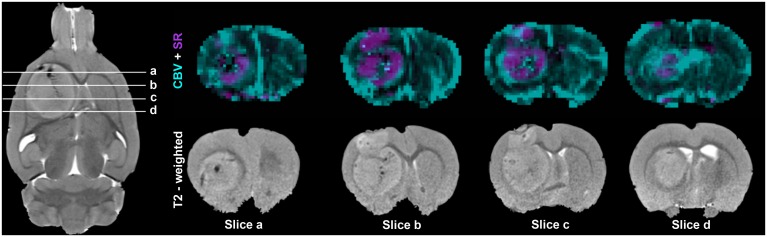
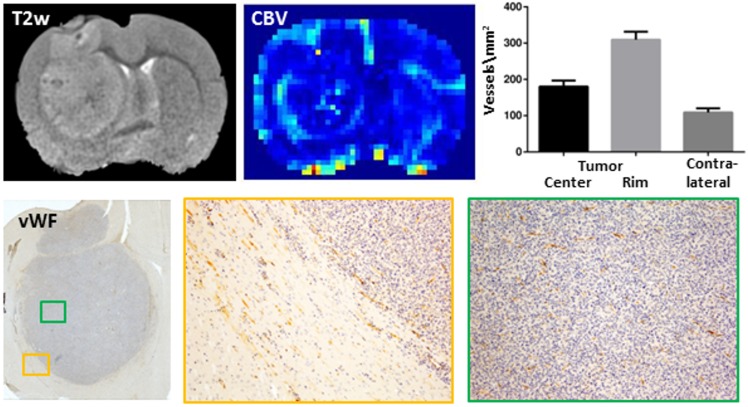
Results: In all rats tumor progression was accompanied by temporal and spatial changes in CBV and capillary permeability. A leakage of the blood-brain barrier (slow contrast enhancement) was observed as soon as the tumor became detectable on T2-weighted images. Interestingly, areas of strong capillary permeability (fast signal enhancement) were predominantly localized in the center of the tumor. In contrast, the tumor rim was dominated by an increased CBV and showed the highest vessel density compared to the tumor center and the contralateral hemisphere as confirmed by histology.
Conclusion: Substantial regional differences in the tumor highlight the importance of parameter maps in contrast or in addition to region-of-interest analyses. The data vividly illustrate how MRI including contrast-enhanced and DSC-MRI may contribute to a better understanding of tumor development.
Conflict of interest statement
The authors have declared that no competing interests exist.
Figures
Similar articles
-
Dynamic contrast-enhanced and dynamic susceptibility contrast perfusion MR imaging for glioma grading: Preliminary comparison of vessel compartment and permeability parameters using hotspot and histogram analysis.Eur J Radiol. 2016 Jun;85(6):1147-56. doi: 10.1016/j.ejrad.2016.03.020. Epub 2016 Mar 22. Eur J Radiol. 2016. PMID: 27161065
-
Biopsy targeting gliomas: do functional imaging techniques identify similar target areas?Invest Radiol. 2010 Dec;45(12):755-68. doi: 10.1097/RLI.0b013e3181ec9db0. Invest Radiol. 2010. PMID: 20829706
-
Dynamic contrast-enhanced susceptibility-weighted perfusion MRI (DSC-MRI) in a glioma model of the rat brain using a conventional receive-only surface coil with a inner diameter of 47 mm at a clinical 1.5 T scanner.J Neurosci Methods. 2008 Jul 30;172(2):168-72. doi: 10.1016/j.jneumeth.2008.04.022. Epub 2008 May 2. J Neurosci Methods. 2008. PMID: 18538856
-
[Perfusion measurement using the T2* contrast media dynamics in neuro-oncology. Physical basics and clinical applications].Radiologe. 2005 Jul;45(7):618-32. doi: 10.1007/s00117-004-1048-2. Radiologe. 2005. PMID: 15098092 Review. German.
-
Measurements of tumor vascular leakiness using DCE in brain tumors: clinical applications.NMR Biomed. 2013 Aug;26(8):1042-9. doi: 10.1002/nbm.2994. Epub 2013 Jul 7. NMR Biomed. 2013. PMID: 23832526 Review.
Cited by
-
C6 cell line: the gold standard in glioma research.Hippokratia. 2018 Jul-Sep;22(3):105-112. Hippokratia. 2018. PMID: 31641331 Free PMC article. Review.
-
Angiogenesis in human brain tumors: screening of drug response through a patient-specific cell platform for personalized therapy.Sci Rep. 2018 Jun 8;8(1):8748. doi: 10.1038/s41598-018-27116-7. Sci Rep. 2018. PMID: 29884885 Free PMC article.
-
Anti-Tumoral and Anti-Angiogenic Effects of Low-Diluted Phenacetinum on Melanoma.Front Oncol. 2021 Mar 3;11:597503. doi: 10.3389/fonc.2021.597503. eCollection 2021. Front Oncol. 2021. PMID: 33747916 Free PMC article.
-
Construction and imaging of a neurovascular unit model.Neural Regen Res. 2022 Aug;17(8):1685-1694. doi: 10.4103/1673-5374.332131. Neural Regen Res. 2022. PMID: 35017415 Free PMC article. Review.
-
Image and motor behavior for monitoring tumor growth in C6 glioma model.PLoS One. 2018 Jul 26;13(7):e0201453. doi: 10.1371/journal.pone.0201453. eCollection 2018. PLoS One. 2018. PMID: 30048545 Free PMC article.
References
-
- Chinot OL, de La Motte Rouge T., Moore N, Zeaiter A, Das A, Phillips H et al. (2011) AVAglio: Phase 3 trial of bevacizumab plus temozolomide and radiotherapy in newly diagnosed glioblastoma multiforme. Adv Therapy 28(4):334–40. - PubMed
MeSH terms
Substances
LinkOut - more resources
Full Text Sources
Other Literature Sources
Medical
