. 2016 Dec 22;8(1):135.
doi: 10.1186/s13073-016-0390-0.

iCAGES: integrated CAncer GEnome Score for comprehensively prioritizing driver genes in personal cancer genomes

Affiliations

iCAGES: integrated CAncer GEnome Score for comprehensively prioritizing driver genes in personal cancer genomes

Chengliang Dong et al. Genome Med. .

Abstract

Cancer results from the acquisition of somatic driver mutations. Several computational tools can predict driver genes from population-scale genomic data, but tools for analyzing personal cancer genomes are underdeveloped. Here we developed iCAGES, a novel statistical framework that infers driver variants by integrating contributions from coding, non-coding, and structural variants, identifies driver genes by combining genomic information and prior biological knowledge, then generates prioritized drug treatment. Analysis on The Cancer Genome Atlas (TCGA) data showed that iCAGES predicts whether patients respond to drug treatment (P = 0.006 by Fisher's exact test) and long-term survival (P = 0.003 from Cox regression). iCAGES is available at http://icages.wglab.org .

Keywords: Cancer genomics; Machine learning; Precision medicine; Precision oncology; TCGA.


Figures
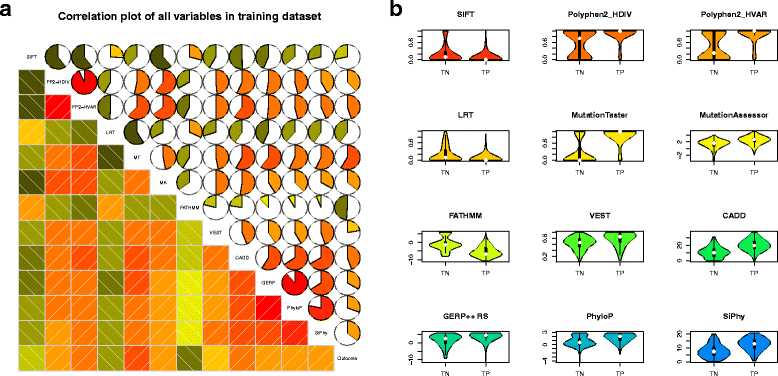
Fig. 1
Fig. 1
Analysis of each predictor selected for the radial SVM modeling for iCAGES variant score. a Correlation diagrams illustrating the pairwise Pearson correlation between all predictors and outcome variable in the training dataset. The color and size of the shaded region in the pie charts at the upper right indicate the level of correlation, with red and larger proportions of the shaded region indicating higher positive correlation. b Violin plots of scores from different predictors (different colors) in the training dataset in the TP (deleterious) and TN (neutral) groups. Each plot shows the median (indicated by the small white dot), the first through the third interquartile range (the thick, solid vertical band), and the density (different colors) of the predictor scores in each group
Fig. 2
Fig. 2
The iCAGES package as three layers. The input file contains all variants identified from the patient; it can be either in ANNOVAR input format or in VCF format. The first layer of iCAGES prioritizes mutations. It computes three different feature scores for annotating the gene, including the radial SVM score for each of its point coding mutations, CNV normalized peak score for each of its structural variations, and FunSeq2 score for each of its point non-coding mutations. The second layer of iCAGES prioritizes cancer driver genes. It takes three feature scores from the first layer, generates the corresponding Phenolyzer score for each mutated gene and computes a LR score for this gene (iCAGES gene score). The final level of iCAGES prioritizes targeted drugs. It first queries the DGIdb and FDA drug database for potential drugs that interact with mutated genes and their neighbors. Next, it calculates the joint probability for each drug being the most effective (iCAGES drug score) from three feature scores, which are iCAGES gene scores for its direct/indirect target, normalized BioSystems probability measuring the maximum relatedness of a drug’s direct target with each mutated gene (final target), and PubChem active probability measuring the bioactivity of the drug. The final output of iCAGES consists of three major elements, a prioritized list of mutations, a prioritized list of genes with their iCAGES gene scores, as well as a prioritized list of targeted drugs with their iCAGES drug scores
Fig. 3
Fig. 3
Performance of the first layer of iCAGES. a Performance of the radial SVM score evaluated on the COSMIC version 68 testing dataset (testing dataset I). A higher AUC score indicates better performance. The 95% CI was computed with 2000 stratified bootstrap replicates. b Performance of the radial SVM score evaluated on Cancer Gene Census genes from COSMIC version 68 testing dataset (testing dataset II)
Fig. 4
Fig. 4
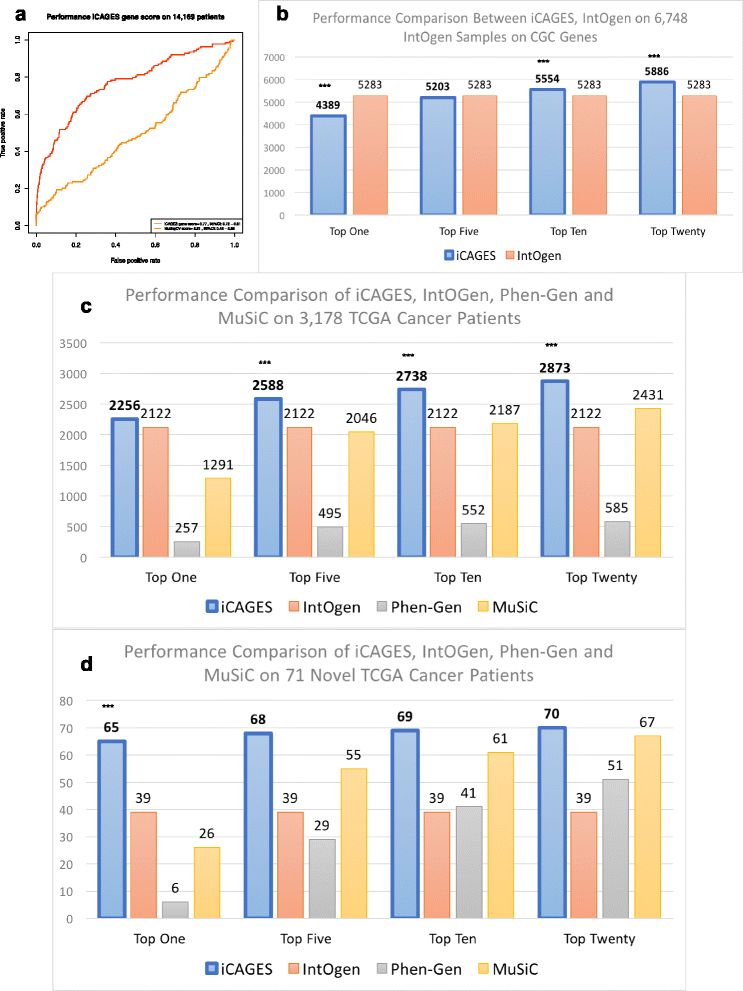
Performance of the second layer of iCAGES. a Performance of the iCAGES score compared to MutSigCV, evaluated on 14,169 TCGA patients. A higher AUC score indicates better performance. The 95% CI was computed with 2000 stratified bootstrap replicates (testing dataset I). b Performance of iCAGES compared to IntOgen, evaluated on data from 6748 patients used in the Rubio-Perez et al. study. Each bar represents the number of patients whose cancer driver gene can be identified by iCAGES or by IntOgen. Top One, Top Five, Top Ten and Top Twenty refer to using the top gene, top five genes, top ten genes, and top 20 genes from prediction, respectively. A significant advantage of iCAGES compared to other tools is indicated with ***P ≤ 0.0001 (Bonferroni correction; testing dataset II). c Performance of iCAGES compared to IntOgen, Phen-Gen, and MuSiC evaluated on data from 3178 patients used in the Kandoth et al. study (testing dataset III). d Performance of iCAGES compared to IntOgen, Phen-Gen, and MuSiC evaluated on data from 71 patients used in the Kandoth et al. study but not in the Rubio-Perez et al. study (testing dataset IV)
Fig. 5
Fig. 5
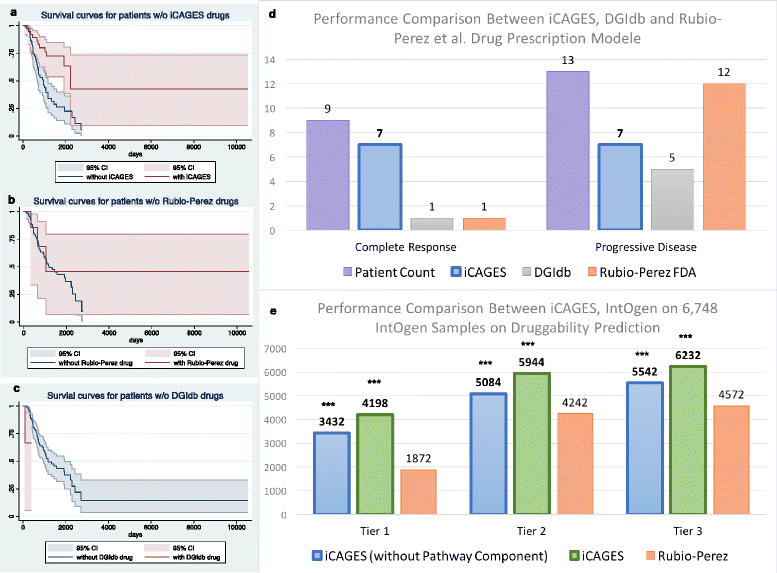
Performance of the third layer of iCAGES. ac Kaplan–Meier survival curve for 124 TCGA patients with targeted therapy with unknown response whose data were also used in the Rubio-Perez et al. study (testing dataset I). a Red and blue curves represent patients whose treatments do and do not contain iCAGES-predicted first tier drugs, respectively. Red and blue areas represent the 95% confidence interval for the survival curve. b Red and blue curves represent patients whose treatments do and do not contain Rubio-Perez et al.-predicted drugs, respectively. c Red and blue curves represent patients whose treatments do and do not contain DGIdb-predicted drugs. d Number of TCGA patients with targeted therapy with complete response or progressive disease who received correct iCAGES-predicted drugs (blue), DGIdb drugs (gray), Rubio-Perez et al. tier one drugs (orange). e Number of patients used in Rubio-Perez et al. study who can potentially benefit from iCAGES (without pathway component from BioSystem) predicted drugs from three tiers (blue), iCAGES-predicted drugs (green), Rubio-Perez et al.-predicted drugs (orange). Significant advantage of iCAGES compared to other tools is indicated as ***P ≤ 0.0001 and Bonferroni correction (testing dataset III)
Fig. 6
Fig. 6
The web interface of iCAGES, as demonstrated using data from Imielinski et al. a The submission page for iCAGES. Users can enter data with the VCF format (default) or with ANNOVAR input format used in the ANNOVAR package. b Dynamic form for advanced users. Users can click “Advanced Options” and enter additional information, such as structural variations in BED format, cancer subtype, and drugs that this patient has been using. c Bubble plot output of the iCAGES package. The size of the bubbles indicates the weight of the iCAGES score and different colors indicate the category of the gene. Red, blue, and green indicate that this gene belongs to the Cancer Gene Census, the KEGG cancer pathway, or neither category, respectively. Pink bubbles that are connected to blue, green or red bubbles indicate targeted drugs. d The corresponding bar plot of the output. The length of the bar indicates the weight of the iCAGES score and different colors indicate the category of the gene

References

    1. Stratton MR, Campbell PJ, Futreal PA. The cancer genome. Nature. 2009;458(7239):719–24. doi: 10.1038/nature07943. - DOI - PMC - PubMed
    1. Greenman C, Stephens P, Smith R, Dalgliesh GL, Hunter C, Bignell G, Davies H, Teague J, Butler A, Stevens C, et al. Patterns of somatic mutation in human cancer genomes. Nature. 2007;446(7132):153–8. doi: 10.1038/nature05610. - DOI - PMC - PubMed
    1. Zender L, Spector MS, Xue W, Flemming P, Cordon-Cardo C, Silke J, Fan ST, Luk JM, Wigler M, Hannon GJ, et al. Identification and validation of oncogenes in liver cancer using an integrative oncogenomic approach. Cell. 2006;125(7):1253–67. doi: 10.1016/j.cell.2006.05.030. - DOI - PMC - PubMed
    1. Zhang X, Jia H, Lu Y, Dong C, Hou J, Wang Z, Wang F, Zhong H, Wang L, Wang K. Exome sequencing on malignant meningiomas identified mutations in neurofibromatosis type 2 (NF2) and meningioma 1 (MN1) genes. Discov Med. 2014;18(101):301–11. - PMC - PubMed
    1. Meyerson M, Gabriel S, Getz G. Advances in understanding cancer genomes through second-generation sequencing. Nat Rev Genet. 2010;11(10):685–96. doi: 10.1038/nrg2841. - DOI - PubMed

Publication types

LinkOut - more resources