Block network mapping approach to quantitative trait locus analysis
- PMID: 28007037
- PMCID: PMC5178092
- DOI: 10.1186/s12859-016-1351-8
Block network mapping approach to quantitative trait locus analysis
Abstract
Background: Advances in experimental biology have enabled the collection of enormous troves of data on genomic variation in living organisms. The interpretation of this data to extract actionable information is one of the keys to developing novel therapeutic strategies to treat complex diseases. Network organization of biological data overcomes measurement noise in several biological contexts. Does a network approach, combining information about the linear organization of genomic markers with correlative information on these markers in a Bayesian formulation, lead to an analytic method with higher power for detecting quantitative trait loci?
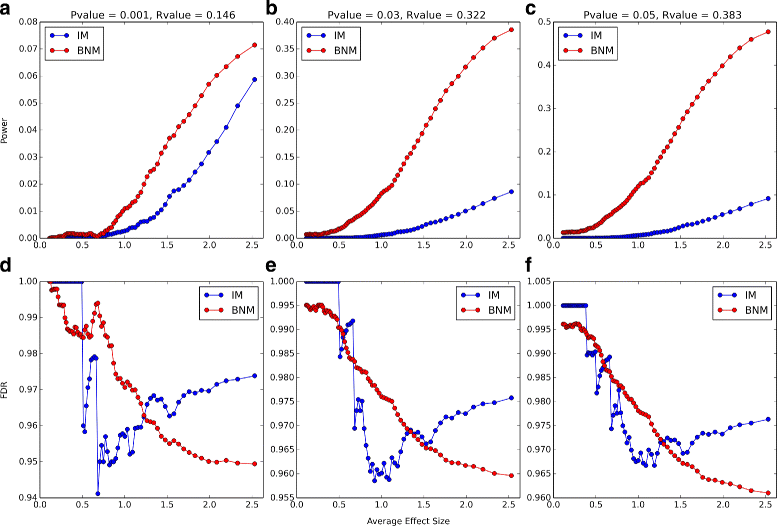
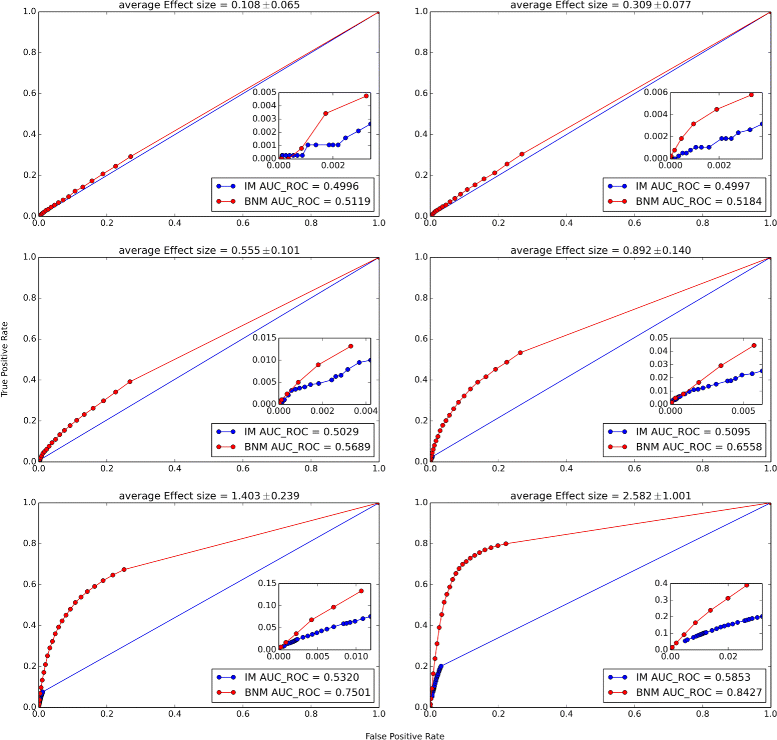
Results: Block Network Mapping, combining Similarity Network Fusion (Wang et al., NM 11:333-337, 2014) with a Bayesian locus likelihood evaluation, leads to large improvements in area under the receiver operating characteristic and power over interval mapping with expectation maximization. The method has a monotonically decreasing false discovery rate as a function of effect size, unlike interval mapping.
Conclusions: Block Network Mapping provides an alternative data-driven approach to mapping quantitative trait loci that leverages correlations in the sampled genotypes. The evaluation methodology can be combined with existing approaches such as Interval Mapping. Python scripts are available at http://lbm.niddk.nih.gov/vipulp/ . Genotype data is available at http://churchill-lab.jax.org/website/GattiDOQTL .
Keywords: Bayes’ theorem; Interval mapping; QTL mapping.
Figures


Similar articles
-
Impact of prior specifications in a shrinkage-inducing Bayesian model for quantitative trait mapping and genomic prediction.Genet Sel Evol. 2013 Jul 8;45(1):24. doi: 10.1186/1297-9686-45-24. Genet Sel Evol. 2013. PMID: 23834140 Free PMC article.
-
Bayesian multiple quantitative trait loci mapping for complex traits using markers of the entire genome.Genetics. 2007 Aug;176(4):2529-40. doi: 10.1534/genetics.106.064980. Epub 2007 May 4. Genetics. 2007. PMID: 17483433 Free PMC article.
-
Mapping a quantitative trait locus via the EM algorithm and Bayesian classification.Genet Epidemiol. 2000 Sep;19(2):97-126. doi: 10.1002/1098-2272(200009)19:2<97::AID-GEPI1>3.0.CO;2-9. Genet Epidemiol. 2000. PMID: 10962473
-
Current progress on statistical methods for mapping quantitative trait loci from inbred line crosses.J Biopharm Stat. 2010 Mar;20(2):454-81. doi: 10.1080/10543400903572845. J Biopharm Stat. 2010. PMID: 20309768 Review.
-
[Advances in researches on application of Bayesian methods to QTL mapping].Yi Chuan. 2007 Jun;29(6):668-74. doi: 10.1360/yc-007-0668. Yi Chuan. 2007. PMID: 17650482 Review. Chinese.
References
-
- Johannsen W. Elements of an exact theory of heredity. Jena: Gustav Fischer; 1909.
-
- Rasmussen J. A contribution to the theory of quantitative character inheritance. Hereditas. 1933;18:245–61. doi: 10.1111/j.1601-5223.1933.tb02614.x. - DOI
-
- Thoday J. Location of polygenes. Nature. 1961;191(4786):368–70. doi: 10.1038/191368a0. - DOI
MeSH terms
Grants and funding
LinkOut - more resources
Full Text Sources
Other Literature Sources
Miscellaneous

