. 2017 Feb:15:150-162.
doi: 10.1016/j.ebiom.2016.11.035. Epub 2016 Dec 3.

Paternal Insulin-like Growth Factor 2 (Igf2) Regulates Stem Cell Activity During Adulthood

Affiliations

Paternal Insulin-like Growth Factor 2 (Igf2) Regulates Stem Cell Activity During Adulthood

Vilma Barroca et al. EBioMedicine. 2017 Feb.

Abstract

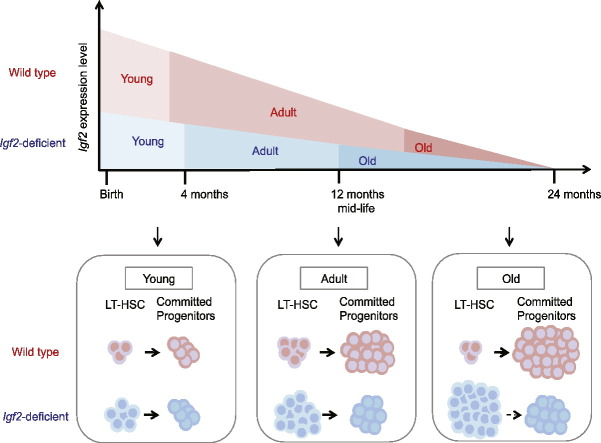
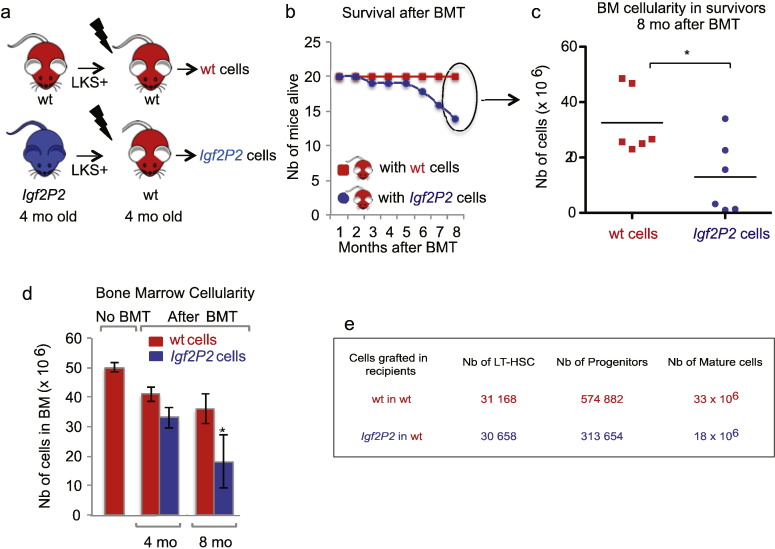
Insulin-like Growth Factor 2 (IGF2) belongs to the IGF/Insulin pathway, a highly conserved evolutionarily network that regulates growth, aging and lifespan. Igf2 is highly expressed in the embryo and in cancer cells. During mouse development, Igf2 is expressed in all sites where hematopoietic stem cells (HSC) successively expand, then its expression drops at weaning and becomes undetectable when adult HSC have reached their niches in bones and start to self-renew. In the present study, we aim to discover the role of IGF2 during adulthood. We show that Igf2 is specifically expressed in adult HSC and we analyze HSC from adult mice deficient in Igf2 transcripts. We demonstrate that Igf2 deficiency avoids the age-related attrition of the HSC pool and that Igf2 is necessary for tissue homeostasis and regeneration. Our study reveals that the expression level of Igf2 is critical to maintain the balance between stem cell self-renewal and differentiation, presumably by regulating the interaction between HSC and their niche. Our data have major clinical interest for transplantation: understanding the changes in adult stem cells and their environments will improve the efficacy of regenerative medicine and impact health- and life-span.

Keywords: Adulthood; Igf2; Imprinting; Longevity; Niche; Self-renewal; Stem cells.


Figures

Image 1
Graphical abstract
Fig. 1
Fig. 1
Igf2-deficiency increases the stem cells pool in aging mice. (a) Post-natal growth curves of wt and Igf2P2 mice (n = 12 per genotype at all ages, except at six weeks n = 4 of each genotype). Whole-mouse weight versus developmental time provides an adequate, although coarse, overall index of the growth process. (b) Representative histological sections of growth plates (denoted by the brackets) from 3-month-old wt and Igf2P2 mice. The columnar alignment of numerous chondrocytes in Igf2P2 bones, opposed to the irregular small groups of chondrocytes in the wt growth plate that is closing, indicates that the developmental stage of Igf2P2 mice corresponds to that of younger mice. Arrows show representative chondrocytes. Scale bar: 200 μm. (c) Relative expression of Igf2 transcripts in cells sorted from bone marrow of wt mice (1,2) and of Igf2P2 mice (3,4) (n = 8 of each genotype). (d) Frequencies of LT-HSC and LKS + cells in wt and Igf2P2 mice during life (n = 10 per genotype and per age). (e) Numbers of LT-HSC, ST-HSC & MPP, committed progenitors and differentiated cells in BM from wt and Igf2P2 mice during life; n = 10 per genotype and per age. Data represent the mean ± SEM of at least 3 independent experiments. See also Supplementary Fig. 1.
Fig. 2
Fig. 2
Paternal Igf2P2 modulates HSC cell cycle. (a) Proportions of LT-HSC, ST-HSC & MPP and committed progenitors from 8- and 20-month-old wt and Igf2P2 mice (n = 8 of each genotype), in the different phases of the cell cycle. *p-value < 0.01. (b) Fold changes in expression of cell cycle regulators in Igf2P2 mice relative to wt: LT-HSC, LKS + and committed progenitors from 8-month old mice (upper panel, n = 8 of each genotype) and 20-month old mice (lower panel, n = 16 of each genotype). The fold changes in mRNA expression are evaluated by q-PCR and are presented as a log2 scale: up- and down-regulated gene expressions are compared to wt level expression set to zero. Data are expressed as mean ± SEM of 3 independent experiments. See Supplementary data, Supplementary Table 1. (a) Proportions of LT-HSC, ST-HSC & MPP and committed progenitors from 8- and 20-month-old wt and Igf2P2 mice (n = 8 of each genotype), in the different phases of the cell cycle. *p-value < 0.01. (b) Fold changes in expression of cell cycle regulators in Igf2P2 mice relative to wt: LT-HSC, LKS + and committed progenitors from 8-month old mice (upper panel, n = 8 of each genotype) and 20-month old mice (lower panel, n = 16 of each genotype). The fold changes in mRNA expression are evaluated by q-PCR and are presented as a log2 scale: up- and down-regulated gene expressions are compared to wt level expression set to zero. Data are expressed as mean ± SEM of 3 independent experiments. See Supplementary data, Supplementary Table 1.
Fig. 3
Fig. 3
Competitive bone marrow reconstitution reveals Igf2P2 HSC cell intrinsic properties. (a) Scheme of the competitive transplantation assay. (b) Chimerism in differentiated cells in blood of recipients, 2 months after bone marrow transplantation (BMT) (n = 8 of each genotype). (c) Chimerism in bone marrow stem cells, progenitors and differentiated cells from long-term recipients (n = 8 of each genotype). (d) Scheme of the serial transplantation assay. (e) Chimerism during serial bone marrow transplantation. Igf2P2 and wt cells were analyzed 8 months after they were transplanted into 4 primary, secondary or tertiary recipients. (f) Bone marrow cellularity decreases in serial wt recipients. (g) Example of absolute number of cells in secondary recipients. (h) Left and middle panels: representative histological sections of bones (Masson trichrome staining, scale bar: 200 μm) and spleens (hematoxylin and eosin staining, scale bar: 50 μm) from long-term secondary recipients. Arrows in spleens indicate megakaryocytes. Right panel: bones from tertiary recipient appear white due to the lack of BM cells. (i) Chimerism in spleens of primary recipients. (j) Chimerism in spleens of secondary recipients. Data are expressed as mean ± SEM of 2 independent experiments. See also Supplementary Fig. 2.
Fig. 4
Fig. 4
Paternal Igf2P2 allows long-term hematopoiesis. (a) Scheme of the transplantation assay. (b) Survival curve of recipients after bone marrow transplantation (BMT). (c) Bone marrow cellularity in long-term survivors. (d) Bone marrow cellularity in ungrafted mice and in survivors. Bone marrow cellularity decreases in long-term survivors (n = 8 per genotype). (e) Absolute numbers of cells in long-term survivors (n = 8 per genotype). Data are expressed as mean ± SEM of 2 independent experiments.
Fig. 5
Fig. 5
Igf2P2 deficient HSC have an extrinsic defect. (a) Scheme of the transplantation assay. (b) Short-term hematopoiesis in blood, 2 months after bone marrow transplantation (BMT) (n = 8 per group). (c) Long-term hematopoiesis in bone marrow, 8 months after BMT (n = 8 per group). (d) Bone marrow cellularity in ungrafted mice and in mice 5 months after transplantation. Bone marrow cellularity decreases in long-term recipients (n = 8 per group). (e) Absolute numbers of cells in recipients (n = 8 per group). Data are expressed as mean ± SEM of 2 independent experiments.
Fig. 6
Fig. 6
Altered gene expression in Igf2-deficient HSC and progenitors. Quantitative RT-PCR analysis of different genes expressed in sorted LT-HSC and committed progenitors from bone marrow of wt and Igf2-deficient mice. Fold changes in expression of genes coding (a) for self-renewal or signaling in LT-HSC (n = 6 per genotype), (b) for commitment and differentiation in committed progenitors (n = 8 per genotype), (c) for cell adhesion and extra-cellular matrix proteins in adult LT-HSC, LKS + and committed progenitors and (d) in old mice relative to wt (n = 8 per genotype). Fold changes in mRNA expression are evaluated by q-PCR and are presented as a log2 scale of up- and down-regulated genes expression compared to wt level expression set to zero. Data are the average fold changes relative to wt cells ± SEM, of 3 experiments. β-Actin mRNA levels were used as an internal reference. See also Supplementary data, Supplementary Table 1. Quantitative RT-PCR analysis of different genes expressed in sorted LT-HSC and committed progenitors from bone marrow of wt and Igf2-deficient mice. Fold changes in expression of genes coding (a) for self-renewal or signaling in LT-HSC (n = 6 per genotype), (b) for commitment and differentiation in committed progenitors (n = 8 per genotype), (c) for cell adhesion and extra-cellular matrix proteins in adult LT-HSC, LKS + and committed progenitors and (d) in old mice relative to wt (n = 8 per genotype). Fold changes in mRNA expression are evaluated by q-PCR and are presented as a log2 scale of up- and down-regulated genes expression compared to wt level expression set to zero. Data are the average fold changes relative to wt cells ± SEM, of 3 experiments. β-Actin mRNA levels were used as an internal reference. See also Supplementary data, Supplementary Table 1.
Fig. 7
Fig. 7
Paternal Igf2P2 deficiency results in egress defect from bone marrow. (a) Concentrations of leukocytes, committed progenitors and LKS + cells in blood of adult and old wt and Igf2P2 mice (n = 10 per group). (b) Concentrations of leukocytes, committed progenitors and LKS + cells in the blood of wt and Igf2P2 mice untreated, treated by 3-days G-CSF or by 2 h AMD3100 (n = 6 per group). (c) Clonogenic capacity of wt and Igf2P2 hematopoietic cells mobilized by G-CSF (left panel) or by AMD3100 (right panel). The bar graphs show the proportion of colony forming units (CFU) with mixed populations of erythroid and myeloid cells (CFU-GEMM), CFU-granulocytes and macrophages (CFU-GM), CFU-granulocytes (CFU-G), CFU-macrophages (CFU-M) and CFU-erythroid (CFU-E), scored after 7 days of culture. Data are expressed as CFU-C/ml of blood. Data are expressed as mean ± SEM of 2 independent experiments. See also Supplementary Fig. 3.

Similar articles

Cited by

References

    1. Alvarez-Silva M., Belo-Diabangouaya P., Salaün J., Dieterlin-Lièvre F. Mouse placenta is a major hematopoietic organ. Development. 2003;130:5437–5444. - PubMed
    1. Alzhanov D.T. Long-range interactions regulate Igf2 gene transcription during skeletal muscle differentiation. J. Biol. Chem. 2010;285:38969–38977. - PMC - PubMed
    1. Baker J., Liu J.P., Robertson E.J., Efstratiadis A. Role of insulin-like growth factors in embryonic and postnatal growth. Cell. 1993;75:73–82. - PubMed
    1. Bartke A., Sun L.Y., Longo V. Somatotropic signaling: trade-offs between growth, reproductive development, and longevity. Physiol. Rev. 2013;93:571–598. - PMC - PubMed
    1. Bartolomei M.S., Zemel S., Tilghman S.M. Parental imprinting of the mouse H19 gene. Nature. 1991;351:153–155. - PubMed

MeSH terms