

Measuring MEG closer to the brain: Performance of on-scalp sensor arrays
- PMID: 28007515
- PMCID: PMC5432137
- DOI: 10.1016/j.neuroimage.2016.12.048
Measuring MEG closer to the brain: Performance of on-scalp sensor arrays
Abstract
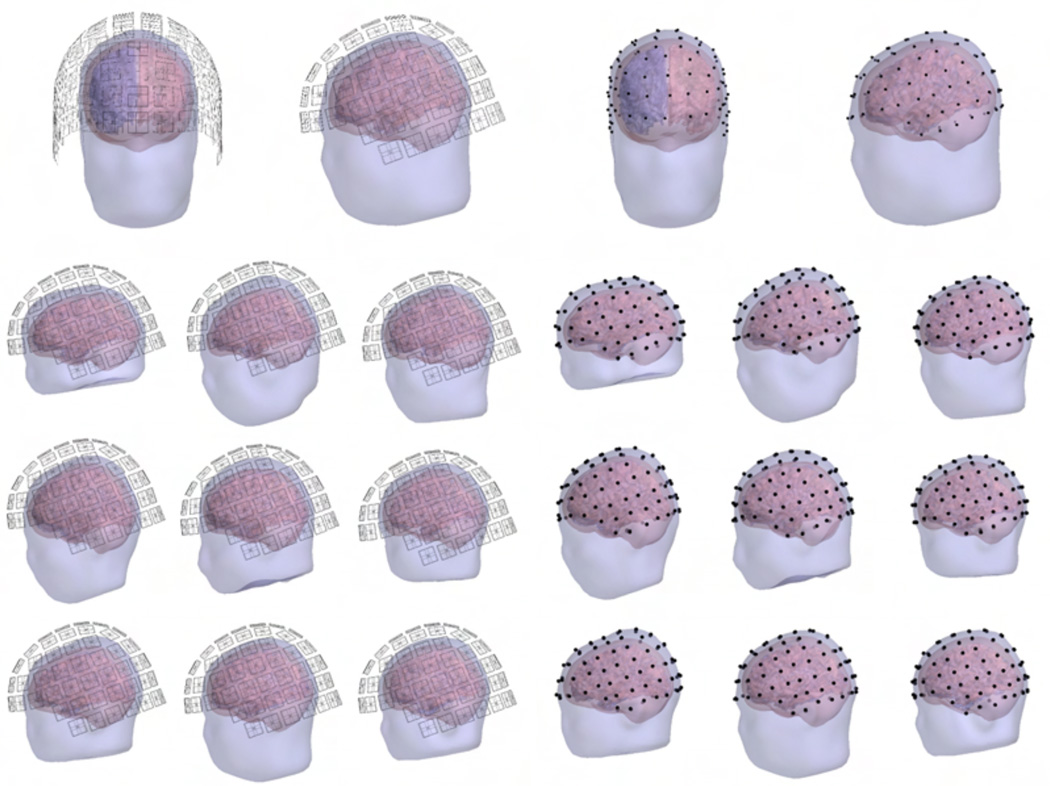
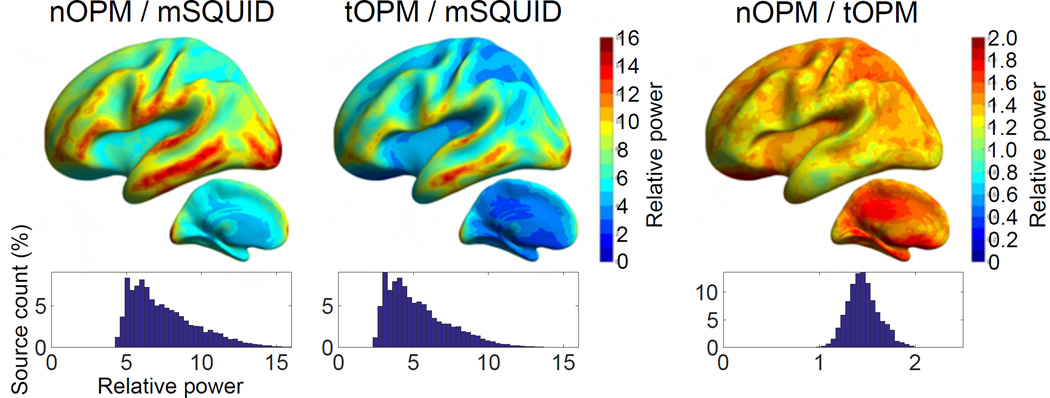
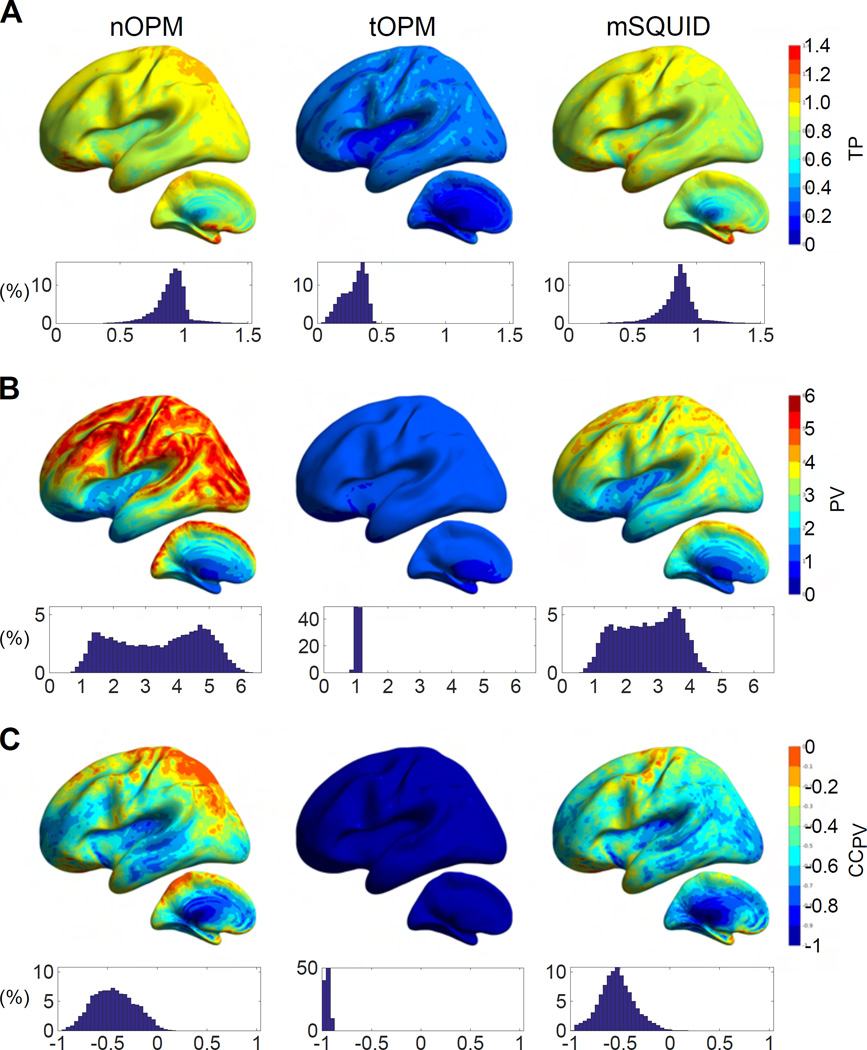
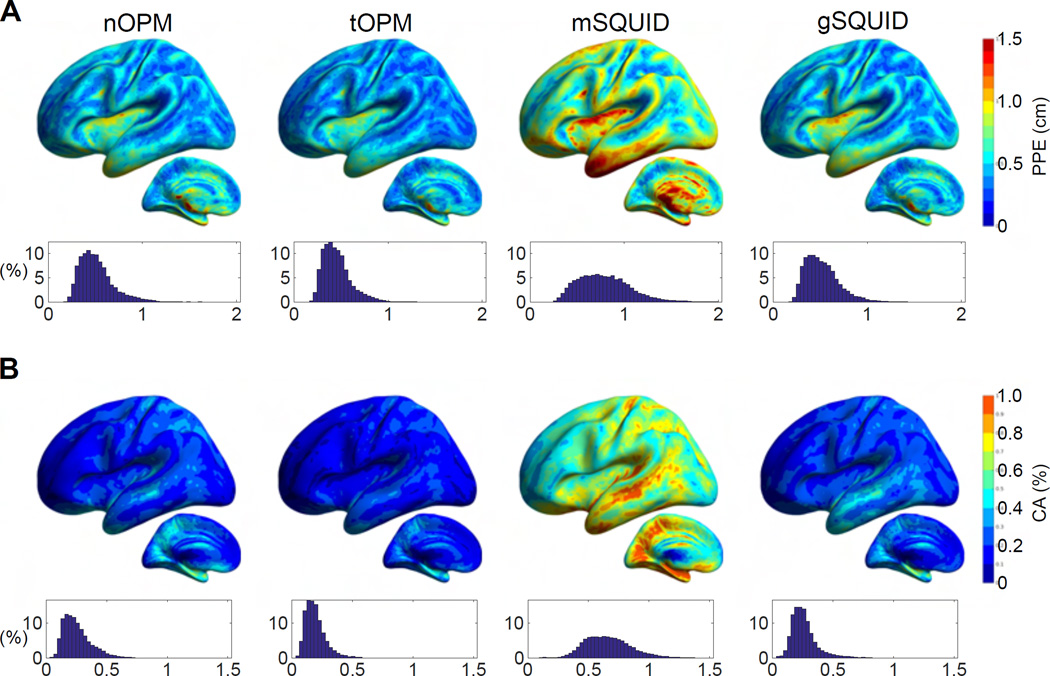
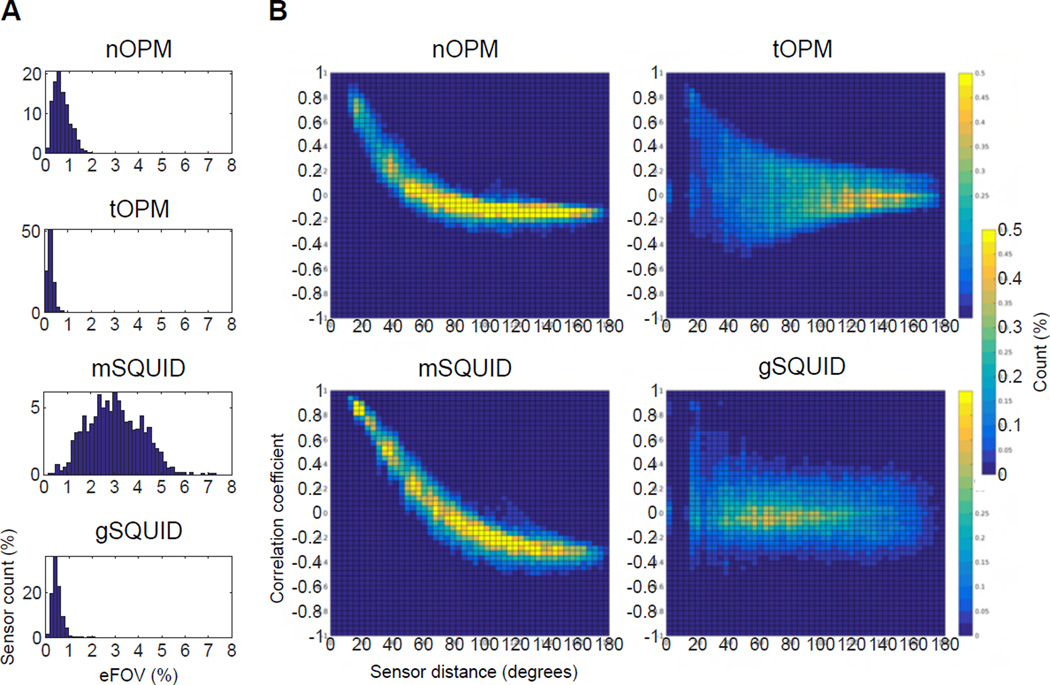
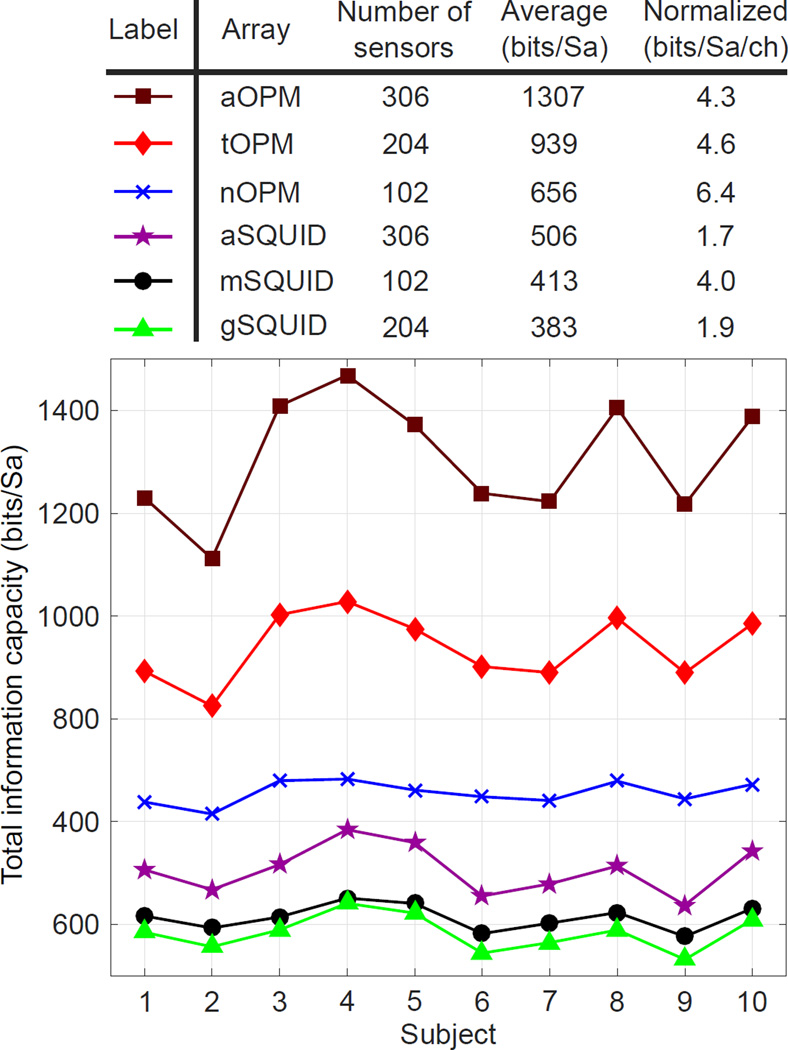
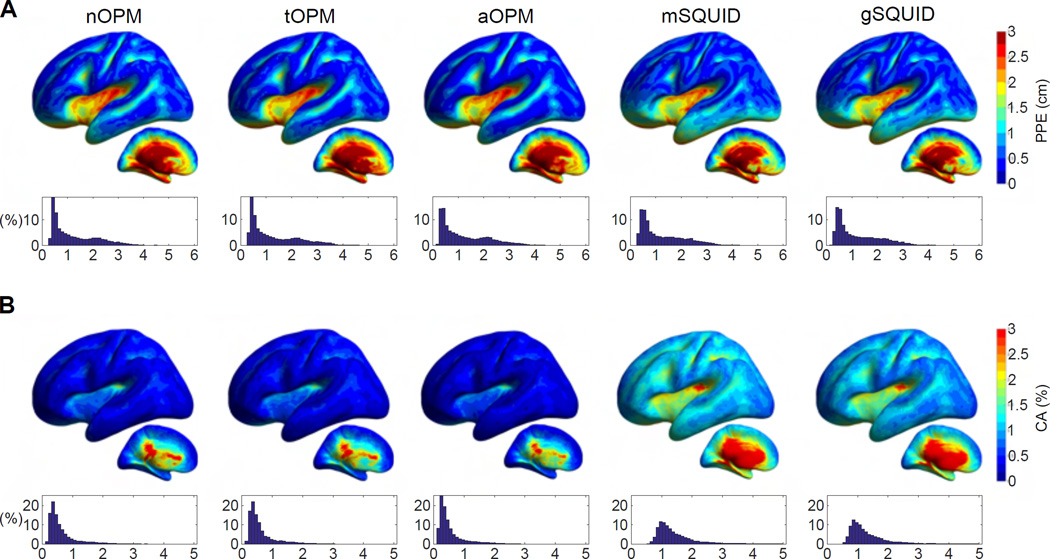
Optically-pumped magnetometers (OPMs) have recently reached sensitivity levels required for magnetoencephalography (MEG). OPMs do not need cryogenics and can thus be placed within millimetres from the scalp into an array that adapts to the individual head size and shape, thereby reducing the distance from cortical sources to the sensors. Here, we quantified the improvement in recording MEG with hypothetical on-scalp OPM arrays compared to a 306-channel state-of-the-art SQUID array (102 magnetometers and 204 planar gradiometers). We simulated OPM arrays that measured either normal (nOPM; 102 sensors), tangential (tOPM; 204 sensors), or all components (aOPM; 306 sensors) of the magnetic field. We built forward models based on magnetic resonance images of 10 adult heads; we employed a three-compartment boundary element model and distributed current dipoles evenly across the cortical mantle. Compared to the SQUID magnetometers, nOPM and tOPM yielded 7.5 and 5.3 times higher signal power, while the correlations between the field patterns of source dipoles were reduced by factors of 2.8 and 3.6, respectively. Values of the field-pattern correlations were similar across nOPM, tOPM and SQUID gradiometers. Volume currents reduced the signals of primary currents on average by 10%, 72% and 15% in nOPM, tOPM and SQUID magnetometers, respectively. The information capacities of the OPM arrays were clearly higher than that of the SQUID array. The dipole-localization accuracies of the arrays were similar while the minimum-norm-based point-spread functions were on average 2.4 and 2.5 times more spread for the SQUID array compared to nOPM and tOPM arrays, respectively.
Keywords: Atomic magnetometer; Lead field; Magnetoencephalography; Optically-pumped magnetometer; Sensor array; Superconducting quantum interference device.
Copyright © 2016 The Authors. Published by Elsevier Inc. All rights reserved.
Figures
Similar articles
-
Transforming and comparing data between standard SQUID and OPM-MEG systems.PLoS One. 2022 Jan 19;17(1):e0262669. doi: 10.1371/journal.pone.0262669. eCollection 2022. PLoS One. 2022. PMID: 35045107 Free PMC article.
-
On-scalp MEG system utilizing an actively shielded array of optically-pumped magnetometers.Neuroimage. 2019 Jul 1;194:244-258. doi: 10.1016/j.neuroimage.2019.03.022. Epub 2019 Mar 15. Neuroimage. 2019. PMID: 30885786 Free PMC article.
-
A comparative study on the detection and localization of interictal epileptiform discharges in magnetoencephalography using optically pumped magnetometers versus superconducting quantum interference devices.Neuroimage. 2025 May 15;312:121232. doi: 10.1016/j.neuroimage.2025.121232. Epub 2025 Apr 18. Neuroimage. 2025. PMID: 40254146
-
Optically pumped magnetometers: From quantum origins to multi-channel magnetoencephalography.Neuroimage. 2019 Oct 1;199:598-608. doi: 10.1016/j.neuroimage.2019.05.063. Epub 2019 May 26. Neuroimage. 2019. PMID: 31141737 Free PMC article. Review.
-
Magnetoencephalography with optically pumped magnetometers (OPM-MEG): the next generation of functional neuroimaging.Trends Neurosci. 2022 Aug;45(8):621-634. doi: 10.1016/j.tins.2022.05.008. Epub 2022 Jun 30. Trends Neurosci. 2022. PMID: 35779970 Free PMC article. Review.
Cited by
-
Simulation Study of Different OPM-MEG Measurement Components.Sensors (Basel). 2022 Apr 21;22(9):3184. doi: 10.3390/s22093184. Sensors (Basel). 2022. PMID: 35590874 Free PMC article.
-
Optimal design of on-scalp electromagnetic sensor arrays for brain source localisation.Hum Brain Mapp. 2021 Oct 15;42(15):4869-4879. doi: 10.1002/hbm.25586. Epub 2021 Jul 10. Hum Brain Mapp. 2021. PMID: 34245061 Free PMC article.
-
Naturalistic Hyperscanning with Wearable Magnetoencephalography.Sensors (Basel). 2023 Jun 9;23(12):5454. doi: 10.3390/s23125454. Sensors (Basel). 2023. PMID: 37420622 Free PMC article.
-
Determining sensor geometry and gain in a wearable MEG system.Imaging Neurosci (Camb). 2025 Apr 8;3:imag_a_00535. doi: 10.1162/imag_a_00535. eCollection 2025. Imaging Neurosci (Camb). 2025. PMID: 40800786 Free PMC article.
-
Optical Co-registration of MRI and On-scalp MEG.Sci Rep. 2019 Apr 2;9(1):5490. doi: 10.1038/s41598-019-41763-4. Sci Rep. 2019. PMID: 30940844 Free PMC article.
References
-
- Alem O, Sander TH, Mhaskar R, LeBlanc J, Eswaran H, Steinhoff U, Okada Y, Kitching J, Trahms L, Knappe S. Fetal magnetocardiography measurements with an array of microfabricated optically pumped magnetometers. Physics in Medicine and Biology. 2015;60(12):4797. - PubMed
-
- Allred J, Lyman R, Kornack T, Romalis M. High-sensitivity atomic magnetometer unaffected by spin-exchange relaxation. Physical Review Letters. 2002;89(13):130801. - PubMed
-
- Arturi CM, Di Rienzo L, Haueisen J. Information content in single-component versus three-component cardiomagnetic fields. Magnetics, IEEE Transactions on. 2004;40(2):631–634.
-
- Budker D, Kimball DFJ. Optical magnetometry. Cambridge University Press; 2013.
Publication types
MeSH terms
Grants and funding
LinkOut - more resources
Full Text Sources
Other Literature Sources
