Review
. 2017 Apr;151(4):917-929.
doi: 10.1016/j.chest.2016.12.002. Epub 2016 Dec 19.

Control of Ventilation in Health and Disease

Affiliations
Review

Control of Ventilation in Health and Disease

Susmita Chowdhuri et al. Chest. 2017 Apr.

Abstract

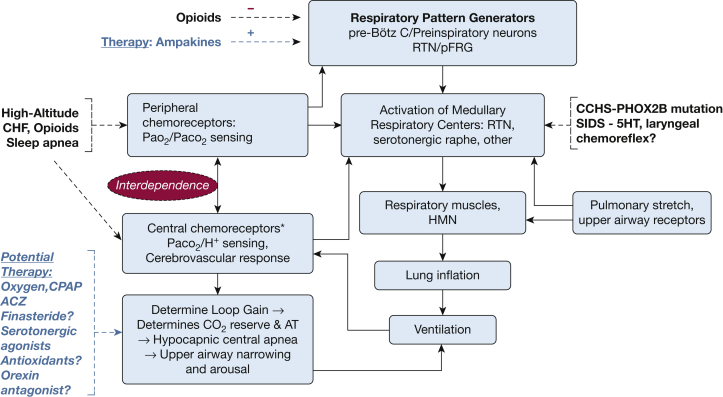
Control of ventilation occurs at different levels of the respiratory system through a negative feedback system that allows precise regulation of levels of arterial carbon dioxide and oxygen. Mechanisms for ventilatory instability leading to sleep-disordered breathing include changes in the genesis of respiratory rhythm and chemoresponsiveness to hypoxia and hypercapnia, cerebrovascular reactivity, abnormal chest wall and airway reflexes, and sleep state oscillations. One can potentially stabilize breathing during sleep and treat sleep-disordered breathing by identifying one or more of these pathophysiological mechanisms. This review describes the current concepts in ventilatory control that pertain to breathing instability during wakefulness and sleep, delineates potential avenues for alternative therapies to stabilize breathing during sleep, and proposes recommendations for future research.


Figures

Figure 1
Figure 1
Ventilatory control of breathing, starting with inspiration/expiration at the respiratory-pattern generators, with ongoing modulation of ventilation through a feedback mechanism by the peripheral and central chemoreceptors and cerebrovascular responsiveness (CVR) as well as by airway/pulmonary receptors. Chemoreceptor sensitivity can be measured through loop gain, a measure of ventilatory responsiveness to Paco2 levels, which in turn determines the AT and carbon dioxide reserve during sleep and eventually the propensity for developing a hypocapnic central apnea. See text for full explanation. Potential underlying pathophysiological mechanisms that predispose to sleep apnea, including chemoresponsiveness, CVR, and opioid-induced inhibition of the pre-Bötz C are depicted by black dashed lines. Therapeutic interventions that may target potential mechanisms are denoted by blue dashed lines. – denotes “inhibition”; + denotes “activation.” 5HT = serotonin related; ACZ = acetazolamide; AT = apneic threshold; CCHS = congenital central hypoventilation syndrome; CHF = congestive heart failure; CVR = cerebrovascular responsiveness to CO2. HMN = hypoglossal motor nucleus; pFRG = parafacial respiratory group, Pre-Bötz C = pre-Bötzinger complex; RTN = retrotrapezoid nucleus.
Figure 2
Figure 2
Current view of locations of central chemoreceptor sites; chemoreception is widely distributed in hindbrain. 7N = facial nerve; VII = facial nucleus; AMB = ambiguous; C = caudal; cNTS = caudal nucleus tractus solitarious; cVLM = caudal ventrolateral medulla; DR = dorsal raphe; FN = fastigial nucleus; LC = locus ceruleus; LHA = lateral hypothalamus; M = middle; R = rostral; PBC = pre-Bötzinger complex; Pn = pons; RTH/pFRG = retrotrapezoid nucleus/parafacial respiratory group; rVRG = rostral ventral respiratory group; SO = superior olive; V4 = fourth ventricle.
Figure 3
Figure 3
Representative polygraph segment from a subject during stable NREM sleep at different time points: room air control condition (C) and mechanical ventilation (MV) leading to central apnea (A) after the cessation of MV. Note the 10-s central apnea (absence of respiratory effort on the supraglottic pressure [PSG] tracing). EEG = electroencephalogram; EOG = electrooculogram; MV = mechanical ventilation; NREM = nonrapid eye movement; Pmask = mask pressure.
Figure 4
Figure 4
Relationship between minute ventilation (V˙i) and Petco2 along the isometabolic curve with sustained hyperoxia vs sham room air. Note decreased eupneic Petco2 with hyperoxia (X), compared with sham exposure (Y), indicative of decreased plant gain. There is also a decrease in the slope of V˙i/carbon dioxide with hyperoxia (solid red line) compared with sham (dashed blue line), confirming a decline in the hypocapnic ventilatory responsiveness on exposure to hyperoxia. The arrows indicate carbon dioxide reserve during the two exposure conditions: greater magnitude of carbon dioxide reserve with hyperoxia (solid red arrow) compared with sham room air exposure (dashed blue arrow). Points A and B represent apneic threshold (AT) during hyperoxia and sham, respectively. Petco2 = end-tidal carbon dioxide.
Figure 5
Figure 5
Observed eupneic carbon dioxide, AT, Petco2, and carbon dioxide reserve (eupneic Petco2 minus AT Petco2) with episodic hypoxia (EH), specifically during the pre-EH (red bar) and post-EH (blue bar) periods. The top horizontal line represents the eupneic carbon dioxide level, the bottom horizontal line represents the AT, and boxes between these two lines represent the carbon dioxide reserve (pre-EH [red box] and post-EH [blue box]). The carbon dioxide reserve was significantly smaller following EH (post-EH) as a result of the significantly lower eupneic Petco2, without a change in the AT. Reproduced with permission from Chowdhuri et al. AT = apneic threshold; AT-Petco2 = apenic threshold end-tidal CO2; NS = not significant. See Figure 4 legend for expansion of other abbreviations.
Figure 6
Figure 6
Oropharyngeal airway occlusion during spontaneous central apnea in patient with central sleep apnea syndrome. Beginning of central apnea is identified by open arrow. Complete occlusion (image 4) occurred before generation of subatmospheric intraluminal pressure. Last image shows upper airway opening occurred with arousal. Pes = esophageal pressure.

Similar articles

Cited by

References

    1. Richter D.W., Spyer K.M. Studying rhythmogenesis of breathing: comparison of in vivo and in vitro models. Trends Neurosci. 2001;24(8):464–472. - PubMed
    1. Richter D.W., Smith J.C. Respiratory rhythm generation in vivo. Physiology (Bethesda) 2014;29(1):58–71. - PMC - PubMed
    1. Smith J.C., Ellenberger H.H., Ballanyi K., Richter D.W., Feldman J.L. Pre-Bötzinger complex: a brain stem region that may generate respiratory rhythm in mammals. Science. 1991;254(5032):726. - PMC - PubMed
    1. Feldman J.L., Mitchell G.S., Nattie E.E. Breathing: rhythmicity, plasticity, chemosensitivity. Annu Rev Neurosci. 2003;26:239–266. - PMC - PubMed
    1. Feldman J., Janczewski W. Point: Counterpoint: The parafacial respiratory group (pFRG)/pre-Botzinger complex (preBotC) is the primary site of respiratory rhythm generation in the mammal. Counterpoint: the pre-BötC is the primary site of respiratory rhythm generation in the mammal. J Appl Physiol (1985) 2006;100(6):2096. - PubMed

MeSH terms