

Exon-Enriched Libraries Reveal Large Genic Differences Between Aedes aegypti from Senegal, West Africa, and Populations Outside Africa
- PMID: 28007834
- PMCID: PMC5295602
- DOI: 10.1534/g3.116.036053
Exon-Enriched Libraries Reveal Large Genic Differences Between Aedes aegypti from Senegal, West Africa, and Populations Outside Africa
Abstract
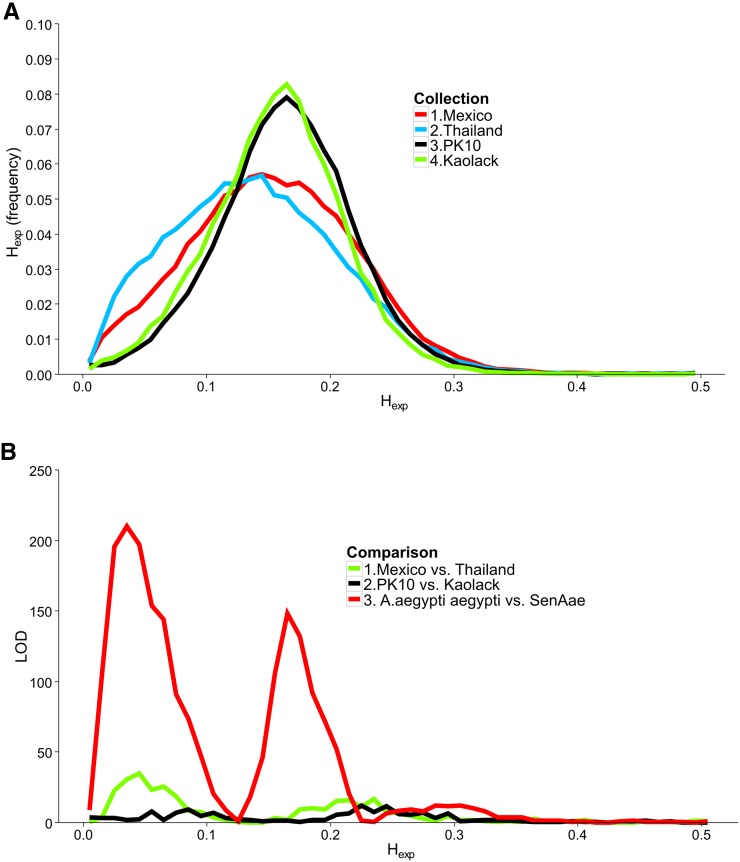
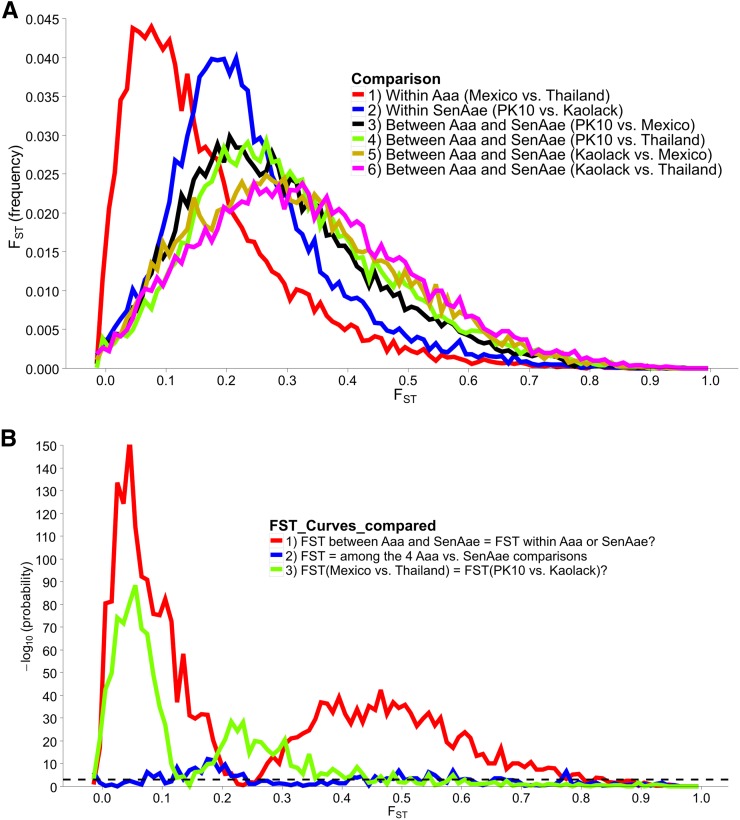
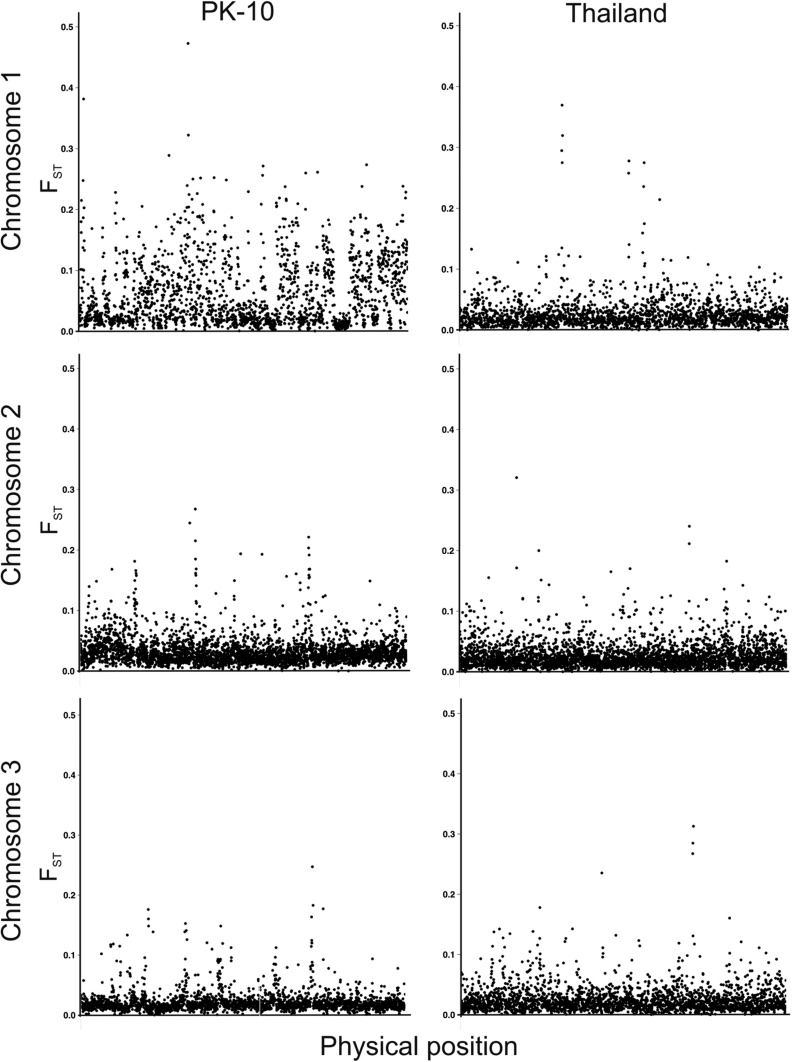
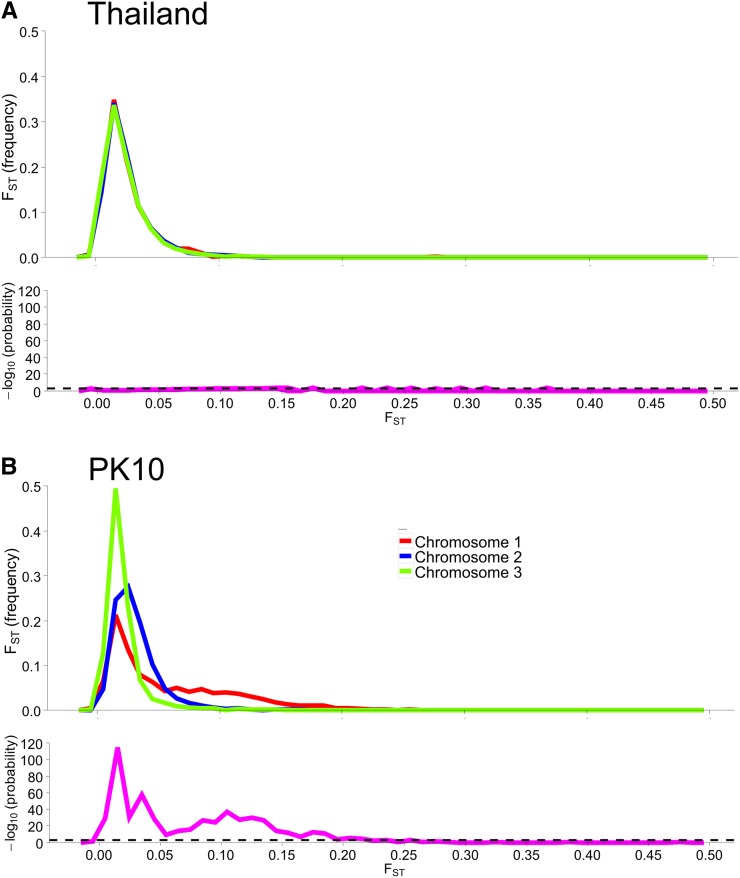
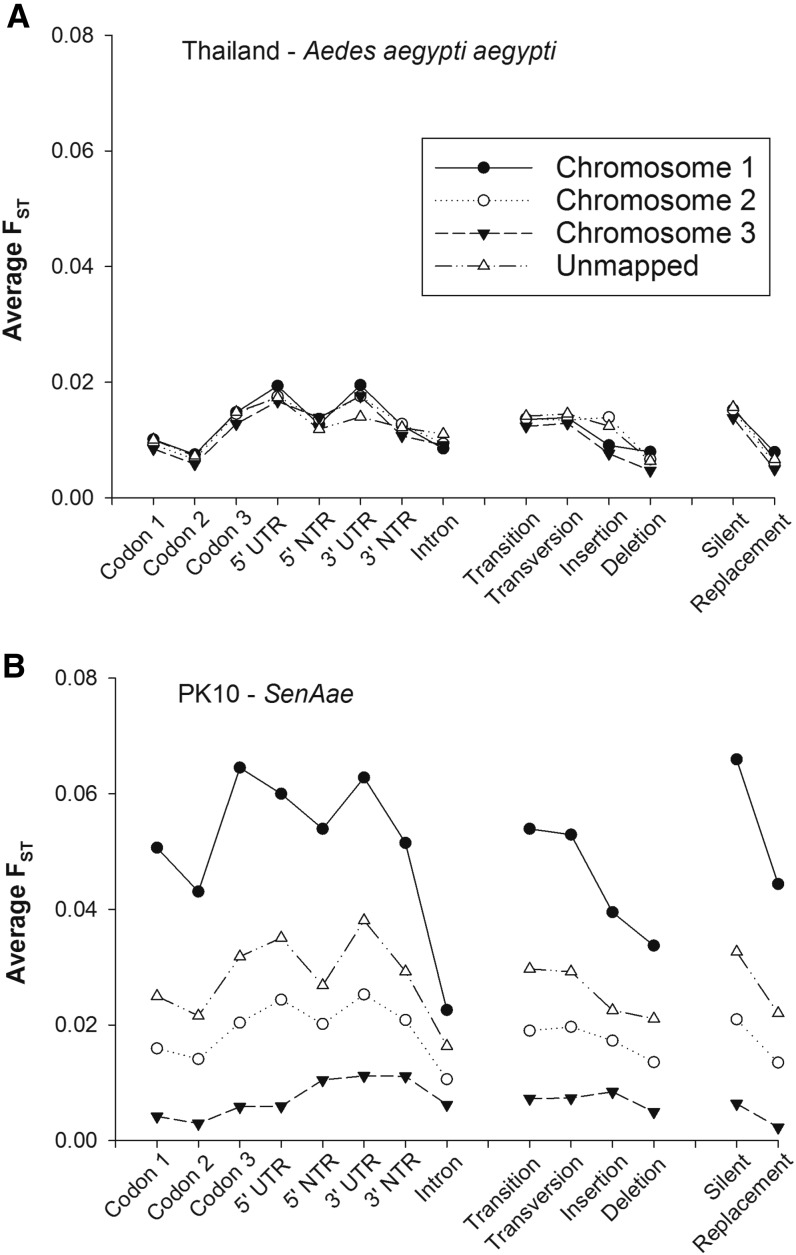
Aedes aegypti is one of the most studied mosquito species, and the principal vector of several arboviruses pathogenic to humans. Recently failure to oviposit, low fecundity, and poor egg-to-adult survival were observed when Ae. aegypti from Senegal (SenAae) West Africa were crossed with Ae. aegypti (Aaa) from outside of Africa, and in SenAae intercrosses. Fluorescent in situ hybridization analyses indicated rearrangements on chromosome 1, and pericentric inversions on chromosomes 2 and 3. Herein, high throughput sequencing (HTS) of exon-enriched libraries was used to compare chromosome-wide genetic diversity among Aaa collections from rural Thailand and Mexico, a sylvatic collection from southeastern Senegal (PK10), and an urban collection from western Senegal (Kaolack). Sex-specific polymorphisms were analyzed in Thailand and PK10 to assess genetic differences between sexes. Expected heterozygosity was greatest in SenAae FST distributions of 15,735 genes among all six pairwise comparisons of the four collections indicated that Mexican and Thailand collections are genetically similar, while FST distributions between PK10 and Kaolack were distinct. All four comparisons of SenAae with Aaa indicated extreme differentiation. FST was uniform between sexes across all chromosomes in Thailand, but were different, especially on the sex autosome 1, in PK10. These patterns correlate with the reproductive isolation noted earlier. We hypothesize that cryptic Ae. aegypti taxa may exist in West Africa, and the large genic differences between Aaa and SenAae detected in the present study have accumulated over a long period following the evolution of chromosome rearrangements in allopatric populations that subsequently cause reproductive isolation when these populations became sympatric.
Keywords: Aedes aegypti; West Africa; genome; population genomics; subspecies.
Copyright © 2017 Dickson et al.
Figures
Similar articles
-
Alternative patterns of sex chromosome differentiation in Aedes aegypti (L).BMC Genomics. 2017 Dec 4;18(1):943. doi: 10.1186/s12864-017-4348-4. BMC Genomics. 2017. PMID: 29202694 Free PMC article.
-
Reproductive Incompatibility Involving Senegalese Aedes aegypti (L) Is Associated with Chromosome Rearrangements.PLoS Negl Trop Dis. 2016 Apr 22;10(4):e0004626. doi: 10.1371/journal.pntd.0004626. eCollection 2016 Apr. PLoS Negl Trop Dis. 2016. PMID: 27105225 Free PMC article.
-
Gene flow, subspecies composition, and dengue virus-2 susceptibility among Aedes aegypti collections in Senegal.PLoS Negl Trop Dis. 2009;3(4):e408. doi: 10.1371/journal.pntd.0000408. Epub 2009 Apr 14. PLoS Negl Trop Dis. 2009. PMID: 19365540 Free PMC article.
-
Population genomics reveals that an anthropophilic population of Aedes aegypti mosquitoes in West Africa recently gave rise to American and Asian populations of this major disease vector.BMC Biol. 2017 Feb 28;15(1):16. doi: 10.1186/s12915-017-0351-0. BMC Biol. 2017. PMID: 28241828 Free PMC article.
-
Flavivirus susceptibility in Aedes aegypti.Arch Med Res. 2002 Jul-Aug;33(4):379-88. doi: 10.1016/s0188-4409(02)00373-9. Arch Med Res. 2002. PMID: 12234528 Review.
Cited by
-
Aedes aegypti miRNA-33 modulates permethrin induced toxicity by regulating VGSC transcripts.Sci Rep. 2021 Mar 31;11(1):7301. doi: 10.1038/s41598-021-86665-6. Sci Rep. 2021. PMID: 33790374 Free PMC article.
-
Alternative patterns of sex chromosome differentiation in Aedes aegypti (L).BMC Genomics. 2017 Dec 4;18(1):943. doi: 10.1186/s12864-017-4348-4. BMC Genomics. 2017. PMID: 29202694 Free PMC article.
-
Behavior of homing endonuclease gene drives targeting genes required for viability or female fertility with multiplexed guide RNAs.Proc Natl Acad Sci U S A. 2018 Oct 2;115(40):E9343-E9352. doi: 10.1073/pnas.1805278115. Epub 2018 Sep 17. Proc Natl Acad Sci U S A. 2018. PMID: 30224454 Free PMC article.
-
The influence of the larval microbiome on susceptibility to Zika virus is mosquito genotype-dependent.PLoS Pathog. 2023 Oct 30;19(10):e1011727. doi: 10.1371/journal.ppat.1011727. eCollection 2023 Oct. PLoS Pathog. 2023. PMID: 37903174 Free PMC article.
-
The Genetic Basis for Salivary Gland Barriers to Arboviral Transmission.Insects. 2021 Jan 15;12(1):73. doi: 10.3390/insects12010073. Insects. 2021. PMID: 33467430 Free PMC article.
References
-
- Beasley D. W. C., McAuley A. J., Bente D. A., 2015. Yellow fever virus: genetic and phenotypic diversity and implications for detection, prevention and therapy. Antiviral Res. 115: 48–70. - PubMed
-
- Black W. C., DuTeau N. M., 1997. RAPD-PCR and SSCP analysis for insect population genetic studies, pp. 361–373 in The Molecular Biology of Insect Disease Vectors: A Methods Manual, edited by Crampton J., Beard C. B., Louis C. Chapman and Hall, New York.
-
- Bosio C. F., Harrington L. C., Jones J. W., Sithiprasasna R., Norris D. E., et al. , 2005. Genetic structure of Aedes aegypti populations in Thailand using mitochondrial DNA. Am. J. Trop. Med. Hyg. 72(4): 434–442. - PubMed
Publication types
MeSH terms
Grants and funding
LinkOut - more resources
Full Text Sources
Other Literature Sources
Miscellaneous