. 2017 Feb;205(2):761-773.
doi: 10.1534/genetics.116.197939. Epub 2016 Dec 22.

Feeding-Related Traits Are Affected by Dosage of the foraging Gene in Drosophila melanogaster

Affiliations

Feeding-Related Traits Are Affected by Dosage of the foraging Gene in Drosophila melanogaster

Aaron M Allen et al. Genetics. 2017 Feb.

Abstract

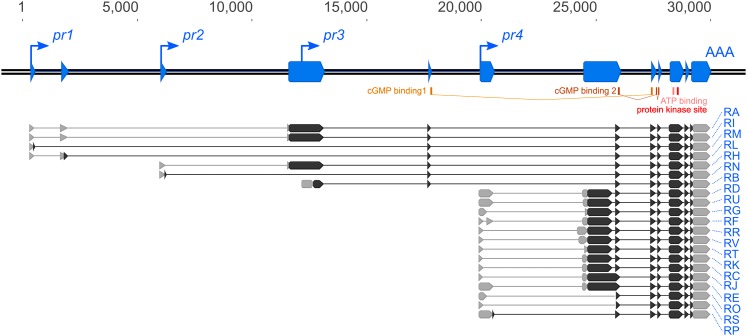
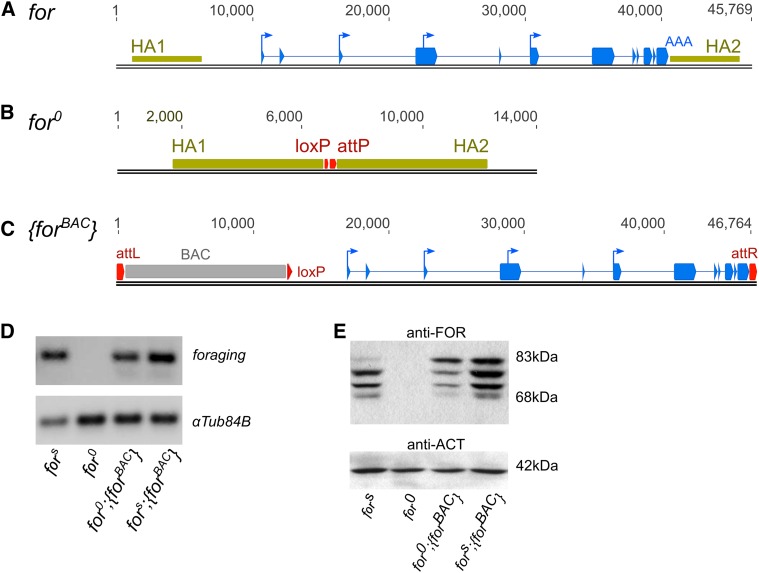
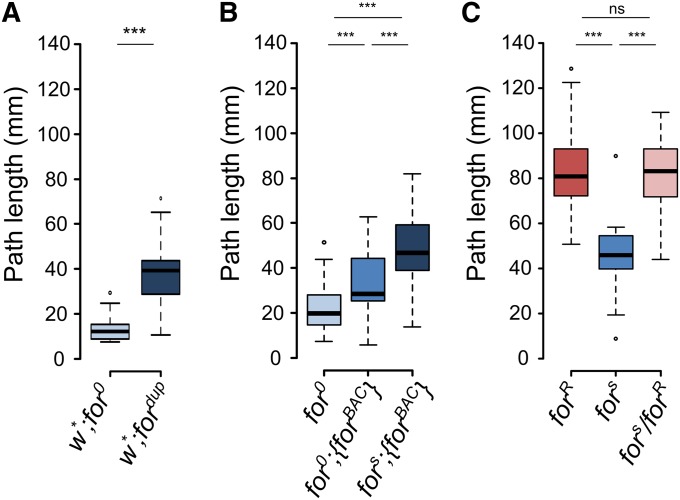
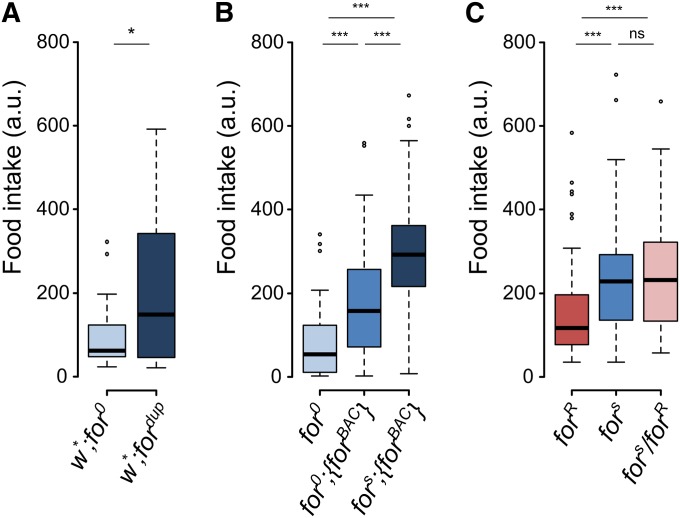
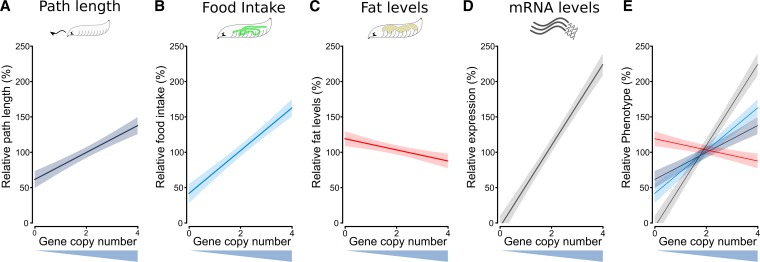
Nutrient acquisition and energy storage are critical parts of achieving metabolic homeostasis. The foraging gene in Drosophila melanogaster has previously been implicated in multiple feeding-related and metabolic traits. Before foraging's functions can be further dissected, we need a precise genetic null mutant to definitively map its amorphic phenotypes. We used homologous recombination to precisely delete foraging, generating the for0 null allele, and used recombineering to reintegrate a full copy of the gene, generating the {forBAC} rescue allele. We show that a total loss of foraging expression in larvae results in reduced larval path length and food intake behavior, while conversely showing an increase in triglyceride levels. Furthermore, varying foraging gene dosage demonstrates a linear dose-response on these phenotypes in relation to foraging gene expression levels. These experiments have unequivocally proven a causal, dose-dependent relationship between the foraging gene and its pleiotropic influence on these feeding-related traits. Our analysis of foraging's transcription start sites, termination sites, and splicing patterns using rapid amplification of cDNA ends (RACE) and full-length cDNA sequencing, revealed four independent promoters, pr1-4, that produce 21 transcripts with nine distinct open reading frames (ORFs). The use of alternative promoters and alternative splicing at the foraging locus creates diversity and flexibility in the regulation of gene expression, and ultimately function. Future studies will exploit these genetic tools to precisely dissect the isoform- and tissue-specific requirements of foraging's functions and shed light on the genetic control of feeding-related traits involved in energy homeostasis.

Keywords: behavior; fat; foraging gene; larva; null mutant.


Figures

Figure 1
Figure 1
Schematic of the foraging gene and associated features. The D. melanogaster foraging gene has four promoters that produce 21 transcripts and nine open reading frames (ORFs). The transcription start sites (pr1–4, up-and-right arrows) and transcription end site (AAA) were identified with rapid amplification of cDNA ends (RACE). The splicing patterns of the transcripts were identified by sequencing full-length cDNAs. Exons (blue boxes) are annotated along the locus (double black line) with the transcripts below. UTRs (gray boxes), ORFs (black boxes), cGMP-binding domains (yellow), ATP-binding domain (pink), and kinase domains (red) are also annotated. RA through RK were previously annotated on FlyBase.
Figure 2
Figure 2
Generation of for0 and {forBAC} alleles. (A) Schematic of the D. melanogaster foraging locus with 5-kb homology arms (HA1, HA2, tan boxes) that were cloned into the pW25-attP vector. (B) Schematic of the for0 allele following recombination. The foraging gene was replaced with a loxP and attP site. (C) Schematic of the {forBAC} allele following φC31 integration at the attP2 site. (D) RT-PCR of whole larval homogenates of homozygous fors, for0, for0;{forBAC}, and fors;{forBAC} allelic combinations. Primers common to all annotated foraging transcripts, com2-F and com2-R, were used to amplify foraging. (E) Western blot of whole larval homogenates of homozygous fors, for0, for0;{forBAC}, and fors;{forBAC} individuals. Size markings are listed to the right of the blots, and antibodies are listed above each blot.
Figure 3
Figure 3
foraging gene dosage and allelic contributions to larval path length. (A) Larval path length of homozygous for0 and fordup individuals. Increasing gene copy number increases path length (t = −8.24, df = 34.31, P = 1.2e−9). (B) Path length on yeast of homozygous for0, for0;{forBAC}, and fors;{forBAC} individuals. Increasing gene copy number increases path length (F(2,105) = 32.3, P = 1.2e−11). (C) Larval path length behavior of homozygous forR, fors and heterozygous forR/fors individuals (F(2,87) = 46.4, P = 1.9e−14). mm, millimeters; ns, nonsignificant; *** P < 0.001.
Figure 4
Figure 4
foraging gene dosage and allelic contributions to larval food intake. (A) Larval food intake of homozygous for0 and fordup individuals. Increasing gene copy number increases food intake (t = −2.65, df = 29.08, P = 0.012). (B) Food intake of homozygous for0, for0;{forBAC}, and fors;{forBAC} individuals. Increasing gene copy number increases food intake (F(2,249) = 70.4, P < 2.2e−16). (C) Larval food intake of homozygous forR, fors and heterozygous forR/fors individuals (F(2,213) = 10.0, P = 7.1e−5). a.u., arbitrary fluorescence units; ns, nonsignificant; * P < 0.05, *** P < 0.001.
Figure 5
Figure 5
foraging gene dosage and allelic contributions to larval fat levels. (A) Larval triglyceride levels of homozygous for0 and fordup individuals. Increasing gene copy number decreases fat levels (t = 91.03, df = 1, P = 4.4e−9). (B) triglyceride levels of homozygous for0, for0;{forBAC}, and fors;{forBAC}. Increasing gene copy number decreases triglyceride levels (F(2,21) = 8.4, P = 0.002). (C) Larval triglyceride levels of homozygous forR, fors and heterozygous forR/fors individuals (F(2,45) = 8.36, P = 0.00082). *** P < 0.001, ** P < 0.01, * P < 0.05; ns, nonsignificant.
Figure 6
Figure 6
foraging gene dosage and allelic contributions to foraging gene expression in whole larvae. Expression of foraging mRNA of homozygous for0, for0;{forBAC}, fors;{forBAC}, and fors whole larvae homogenates amplifying each promoter region and the common coding region. (A) Schematic of the foraging (as in Figure 1). Promoter-specific regions targeted for qPCR identified by the upper vertex of the light blue triangles. (B) pr1-specific (F(3,8) =218.4, P = 5.2e−8), (C) pr2-specific (F(3,8) = 360.2, P = 7.2e−9), (D) pr (F(3,8) = 113.6, P = 6.7e−7), (E) pr4-specific (F(3,8) = 152.6, P = 2.1e−7), and (F) common coding (F(3,8) = 301.6, P = 1.4e−8) expression of regions of foraging quantified RT-qPCR. Due to the gene structure, pr3 is not specific and amplifies a subset of pr1 and pr2, as well. (B–F) Individual data points are plotted (n = 3/genotype; triangle, square, circle) with a bar representing the mean of the three samples. All the ΔΔCts were calculated relative to the mean fors ΔCt for the common coding region in F. *** P < 0.001, ** P < 0.01; P-values are relative to fors.
Figure 7
Figure 7
Modeled effects of foraging gene dosage on relative path length, food intake, fat, and expression. The fitted responses (solid lines) are plotted with 95% confidence intervals (greyed boxes). Raw data from Figure 3B, Figure 4B, Figure 5B, and Figure 6F were normalized to the mean of fors;{forBAC} for each phenotype; (A) path length (R2 = 0.374, slope = 19.05, intercept = 61.90, F(1,106) = 64.81, P = 1.3e−12), (B) food intake (R2 = 0.358, slope = 30.23, intercept = 42.17, F(1,250) = 141.0, P < 2.2e−16), (C) fat levels (R2 = 0.399, slope = −7.850, intercept = 119.5, F(1,22) = 16.29, P = 5.5e−4), (D) mRNA expression (R2 = 0.984, slope = 57.41, intercept = −5.227, F(1,7) =502.5, P = 8.9e−8). (E) path length, food intake, fat levels, and gene expression overlaid on each other for comparison.

References

    1. Anreiter I., Vasquez O. E., Allen A. M., Sokolowski M. B., 2016. Foraging path-length protocol for Drosophila melanogaster larvae. J. Vis. Exp. DOI: 10.3791/53980. - DOI - PMC - PubMed
    1. Attrill H., Falls K., Goodman J. L., Millburn G. H., Antonazzo G., et al. 2016. FlyBase: establishing a gene group resource for Drosophila melanogaster. Nucleic Acids Res. 44: D786–D792. - PMC - PubMed
    1. Bakker K., 1962. An analysis of factors which determine success in competition for food among larvae of Drosophila melanogaster. Arch. Néerl. Zool. 14: 200–281.
    1. Bauer S. J., Sokolowski M. B., 1984. Larval foraging behavior in isofemale lines of Drosophila melanogaster and D. pseudoobscura. J. Hered. 75: 131–134.
    1. Belay A. T., Scheiner R., So A. K.-C., Douglas S. J., Chakaborty-Chatterjee M., et al. , 2007. The foraging gene of Drosophila melanogaster: spatial-expression analysis and sucrose responsiveness. J. Comp. Neurol. 504: 570–582. - PubMed

MeSH terms

Grants and funding