. 2017 Jan 1;26(1):158-172.
doi: 10.1093/hmg/ddw376.

Autophagy activators suppress cystogenesis in an autosomal dominant polycystic kidney disease model

Affiliations

Autophagy activators suppress cystogenesis in an autosomal dominant polycystic kidney disease model

Ping Zhu et al. Hum Mol Genet. .

Abstract

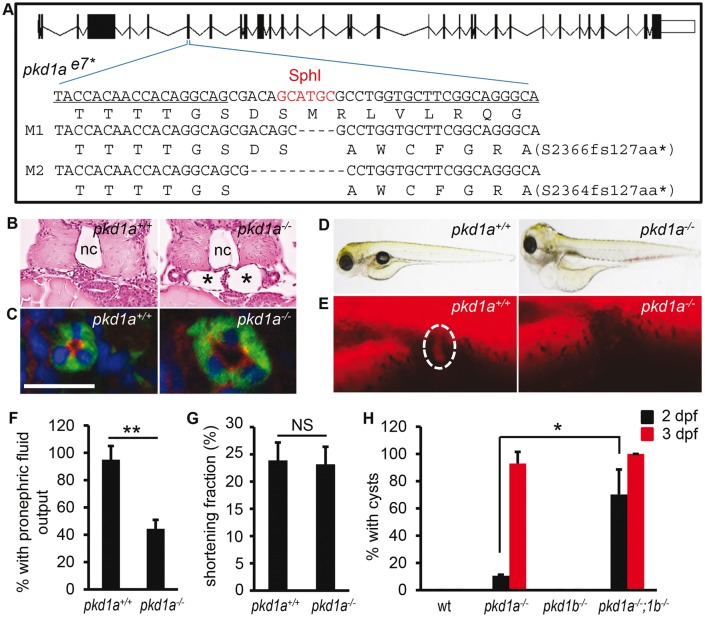
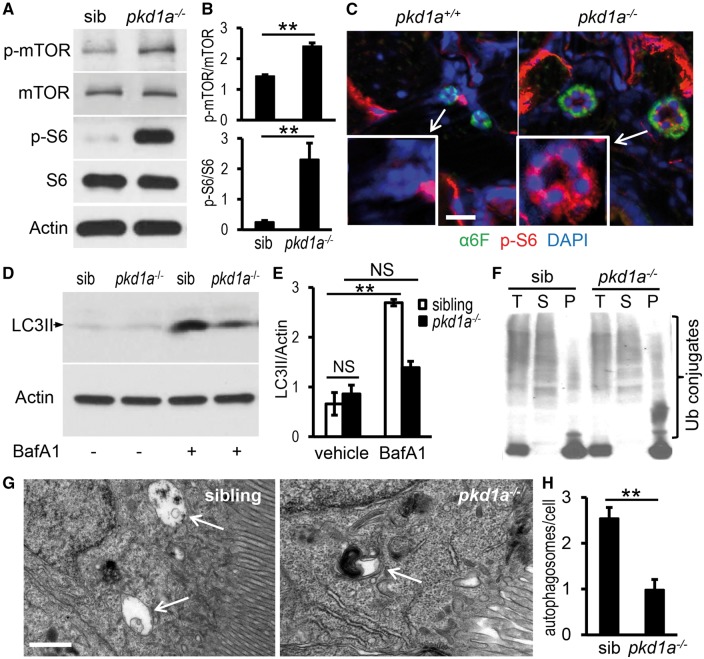
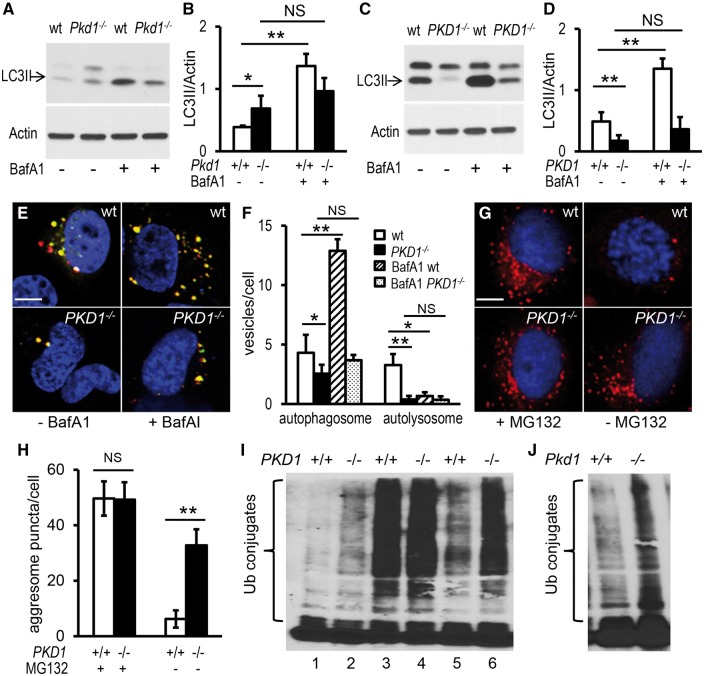
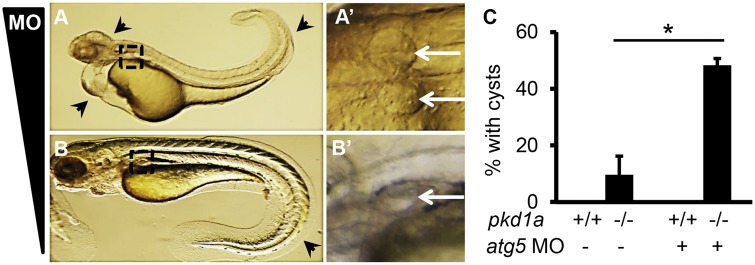
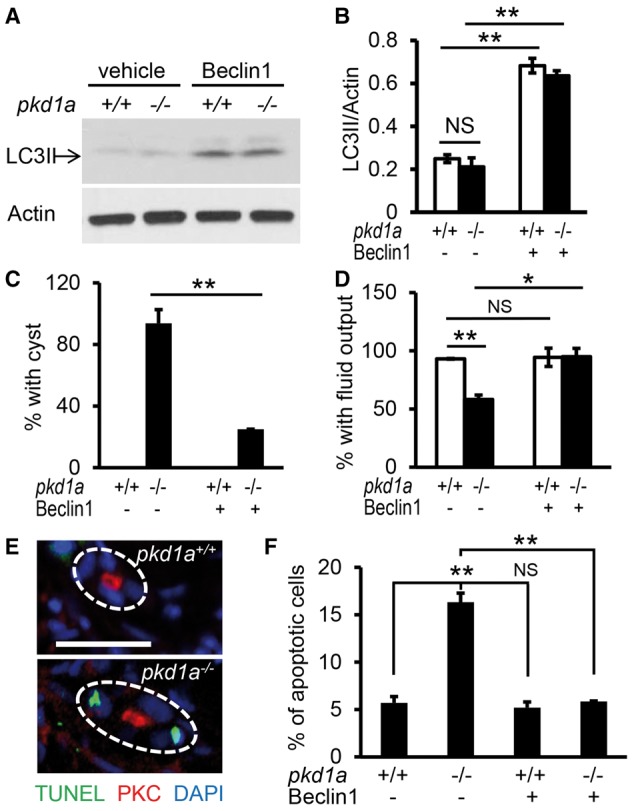
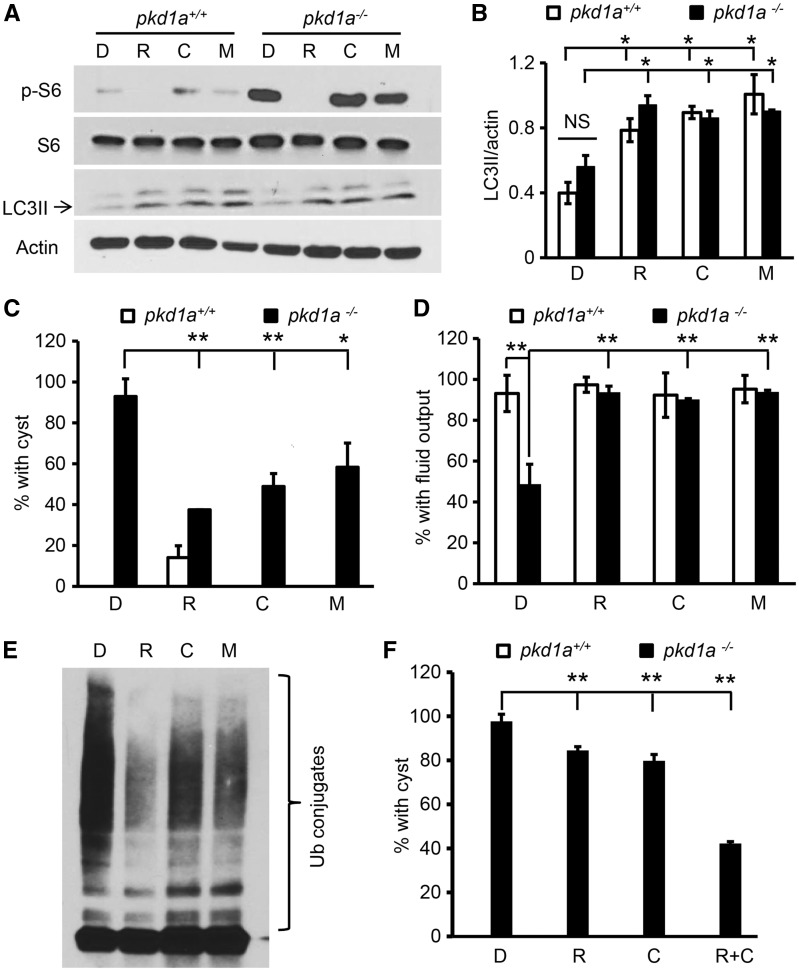
Autosomal dominant polycystic kidney disease (ADPKD) is caused by mutations in either PKD1 or PKD2. It is one of the most common heritable human diseases with eventual development of renal failure; however, effective treatment is lacking. While inhibition of mechanistic target of rapamycin (mTOR) effectively slows cyst expansions in animal models, results from clinical studies are controversial, prompting further mechanistic studies of mTOR-based therapy. Here, we aim to establish autophagy, a downstream pathway of mTOR, as a new therapeutic target for PKD. We generated zebrafish mutants for pkd1 and noted cystic kidney and mTOR activation in pkd1a mutants, suggesting a conserved ADPKD model. Further assessment of the mutants revealed impaired autophagic flux, which was conserved in kidney epithelial cells derived from both Pkd1-null mice and ADPKD patients. We found that inhibition of autophagy by knocking down the core autophagy protein Atg5 promotes cystogenesis, while activation of autophagy using a specific inducer Beclin-1 peptide ameliorates cysts in the pkd1a model. Treatment with compound autophagy activators, including mTOR-dependent rapamycin as well as mTOR-independent carbamazepine and minoxidil, markedly attenuated cyst formation and restored kidney function. Finally, we showed that combination treatment with low doses of rapamycin and carbamazepine was able to attenuate cyst formation as effectively as a single treatment with a high dose of rapamycin alone. In summary, our results suggested a modifying effect of autophagy on ADPKD, established autophagy activation as a novel therapy for ADPKD, and presented zebrafish as an efficient vertebrate model for developing PKD therapeutic strategies.


Figures

Figure 1
Figure 1
Homozygous pkd1 TALEN mutants develop kidney cysts. (A) Schematic diagram of exon-intron structure and recognition sequences (underlined) by TALEN. Because the targeted genomic locus is repaired via a non-homologous recombination mechanism, truncation mutants are typically generated via TALEN owing to the shifted reading frame. Shown are two deletion alleles (M1 and M2) that cause a coding frameshift and premature stop codon (*). Deletions are indicated by dashes. Shown below the DNA sequence is the corresponding amino acid sequence. (B) The glomerulus-neck region of the pronephron was dilated in pkd1a-/- embryos (asterisks) when compared with wild-type siblings (pkd1a+/+). Shown is HE staining on JB-4 sections of day 3 embryos. (C) The pronephric tubule was dilated in pkd1a-/- embryos. Frozen sections of day 5 embryos were immunostained using atypical PKC (red) and Na+/K+ ATPase (α6F, green) antibodies. Blue: DAPI. Scale bar: 20 μm. (D) The pkd1a-/- embryos developed edema at 5 dpf. (E,F) Fluid excretion function of the kidney was impaired in the pkd1a-/- embryos. Using rhodamine-dextran (10 kD) as a fluid tracer, the fluorescence dye was injected into 2.5-day-old embryos and inspected at the cloaca (dashed circle) of embryos (E). Individual embryos were genotyped after the experiment. Quantification of pronephric fluid flow is shown in (F). (G) Cardiac function, as assessed by measuring the shortening fraction at 2.5 dpf, was normal in the pkd1a-/- embryos when compared with pkd1a+/+ fish. (H) pkd1a-/-;pkd1b-/- embryos formed pronephric cysts earlier than pkd1a-/- embryos. Cyst formation in day 2 and day 3 embryos was quantified by HE staining. Data are presented as means ± s.d. from three independent experiments. Eight to ten embryos per genotype were examined in each experiment. *: P <0.05. **: P <0.01. NS: not statistically significant (P >0.05) (F-H). nc: notochord.
Figure 2
Figure 2
pkd1a-/- mutants show aberrant mTOR activation and dysfunctional autophagy. (A,B) Phospho-mTOR and -S6 proteins were increased in pkd1a-/- embryos. Embryo lysates from day 5 animals were analysed by Western blotting (A). The intensity of phospho-mTOR and -S6 bands was quantified and presented as means ± s.d. (B) (C) Phospho-S6 was specifically induced in the pronephric tubules of the pkd1a-/- embryos. Frozen sections of day 5 animals were immunostained using phospho-S6 ribosomal protein (red) and Na+/K+ ATPase (α6F, green) antibodies. Blue: DAPI. Scale bar: 20 μm. (D,E) LC3II levels in the pkd1a-/- embryos were not increased as effectively as those in siblings in response to BafA1 treatment. Embryo lysates from day 5 fish treated with vehicle or 167 nM BafA1 for 16 h were subjected to Western blot analysis. Actin was used as a loading control. The gel is representative of three independent experiments (D). The intensity of LC3II bands was quantified and presented as means ± s.d. (E). (F) Ubiquitin (Ub)-conjugated proteins were moderately increased in detergent-insoluble fractions of pkd1a-/- embryo lysates. The pkd1a-/- fish and siblings at 5 dpf were subjected to cell fractionation, and the resulting total lysates (T), soluble fractions (S), and insoluble fractions (P) analysed by Western blot using an Ub antibody. The blot is representative of three independent experiments. (G,H) Autophagosomes (arrows) in the pronephric cells of 5 dpf fish were evaluated by electron microscopy in the presence of BafA1. Shown are representative images (G) and quantification of autophagosome numbers per cell (H). A total of 100 cells from three embryos per group were scored. Scale bar: 1 μm. **: P <0.01. NS: not statistically significant (P >0.05).
Figure 3
Figure 3
Autophagy is dysregulated in mammalian PKD1-null kidney epithelial cells. (A,B) Kidney epithelial cells derived from Pkd1-null mouse embryos (Pkd1-/-) had higher basal LC3II levels but failed to significantly further increase LC3II expression after BafA1 treatment, compared with cells obtained from wild-type (wt) mouse embryos. (C,D) 9-12 cells isolated from ADPKD patients (PKD1-/-) had a lower LC3II expression before and after BafA1 treatment, compared with RCTE cells extracted from normal renal cortical tubular epithelia (wt). Cells were grown on plates for 24 h, incubated with 167 nM BafA1 or vehicle for 2 h, and then collected for LC3II analysis by Western blot (A,C) and normalization by Actin expression (B,D). (E,F) Human PKD1-/- cells contained fewer autophagosomes and autolysosomes, compared with wt cells. Cells were transfected with pBABE-puro mCherry-EGFP-LC3B plasmid and collected 24 h later for confocal microscopy imaging. Yellow puncta indicate autophagosomes and red dots indicate autolysosomes (E). Numbers of autophagosomes and autolysosomes per cell are quantified (F). (G,H) Human PKD1-/- cells accumulated more aggresomes, compared with wt cells. Cells were incubated with MG132 for 13 h to induce protein aggregation (left panels) and then returned to the normal growth condition for 11 h to allow clearance of the aggregates (right panels). Aggresomes (red) were detected using the ProteoStat Aggresome Detection Kit (G) and quantified (H). (I) Ub-conjugated proteins were accumulated in the detergent-insoluble fraction of human PKD1-/- cells. Cells were collected in the absence (lanes 1 and 2) or presence (lanes 3 and 4) of MG132 for 13 h, or 11 h after removal of MG132 (lanes 5 and 6). Insoluble fractions of cell lysates were subjected to Western blot analysis using an Ub antibody. (J) Ub-conjugated proteins were accumulated in detergent-insoluble fractions of mouse Pkd1-/- cells. The gel is representative of six (A,C) or three (I,J) independent experiments. Data are presented as means ± s.d. from six independent experiments (B,D) or from approximately 50-100 cells per group (F,H). *: P <0.05. **: P <0.01. NS: not statistically significant (P >0.05). Blue: DAPI (E,G).
Figure 4
Figure 4
Knockdown of Atg5 promotes cyst formation in pkd1a-/- embryos. (A,A’) Injection of 4 ng of atg5 MO into one-cell staged embryos resulted in multiple defects, including loss of brain tissues, cardiac edema, and the body curvature (A, arrowhead). Cystic distension of the pronephric tubules (268/285) was observed in enlarged images (A’, arrow). Shown are lateral (A) and dorsal (A’) views of a day 2 embryo. (B,B’) Injection of 1 ng of atg5 MO led to body curvature (B, arrowhead) and small pronephric cysts (B’, arrow) in 19 out of 206 injected embryos. Shown is an embryo at 5 dpf. (C) Injection of 1 ng of atg5 MO increased the number of pkd1a-/- embryos with kidney cysts. MO was injected into embryos derived from heterozygous pkd1a inter-crosses. At 2 dpf, morphants displaying curly body phenotypes were discarded and normal-looking morphants were fixed in 4% formaldehyde, with the posterior tail collected for genotyping. Cyst formation was assessed by HE staining on JB-4 sections. Data are presented as means ± s.d. from three independent experiments. Ten to fifteen embryos per genotype were analysed in each experiment. *: P <0.05.
Figure 5
Figure 5
Autophagy induction by the Tat-Beclin 1 peptide suppresses cystogenesis and rescues kidney function in pkd1a-/- embryos. (A,B) Tat-Beclin 1 peptide induced autophagy in zebrafish embryos. Tat-Beclin-1 peptide (100 nM) was incubated with embryos at 2.5 dpf for 16 h, and Western blot analysis was performed using whole embryo lysates (A). Quantification of LC3II expression was presented as means ± s.d. from three independent experiments (B). (C) Tat-Beclin 1 peptide inhibited pronephric cyst formation in the pkd1a-/- embryos. Embryos derived from heterozygous pkd1a inter-crosses were incubated with the peptide (100 nM) at 2.5 dpf for 16 h, and then subjected to JB-4 embedding and HE staining. The percentage of embryos with kidney cysts was scored. (D) The Tat-Beclin 1 peptide rescued kidney excretion function in the pkd1a-/- embryos. Embryos at 2.5 dpf were treated with the peptide for 16 h, and then injected with rhodamine-dextran dye for assessment of kidney fluid flow. Individual embryos were genotyped at the end of the experiment. Data are presented as means ± s.d. from three independent experiments, 8-15 embryos per group per time were examined (C,D). (E) pkd1a mutants exhibited increased apoptosis in the pronephric kidney. Apoptotic cell death (green) was analysed by TUNEL assay on frozen sections of day 3 embryos, followed by immunostaining using atypical PKC (red) antibody to mark pronephric tubules. Blue: DAPI. Scale bar: 20 μm. (F) The Tat-Beclin 1 peptide decreased apoptotic cell death in the pkd1a-/- embryos. Embryos at 2.5 dpf were treated with the peptide for 16 h, and then processed for apoptosis analysis by the TUNEL assay. Quantification of apoptosis was expressed as the percentage of TUNEL-positive cells in total kidney epithelial cells examined, 80-100 cells from 4 embryos per group were scored. *: P <0.05. **: P <0.01. NS: not statistically significant (P >0.05).
Figure 6
Figure 6
Autophagy activators in the mTOR-dependent or mTOR-independent pathways both ameliorate cystic phenotypes in pkd1a-/- embryos. (A,B) Rapamycin, carbamazepine, and minoxidil all enhanced LC3II expression while differentially affecting phospho-S6 levels. Zebrafish embryos were treated with DMSO (D), rapamycin (R, 400 nM), carbamazepine (C, 20 μM), or minoxidil (M, 400 nM) at 4 dpf for 16 h, and Western blot analysis was performed using whole embryo lysates. The gel is representative of three independent experiments (A), and LC3II levels were normalized by actin expression and presented as means ± s.d. (B). (C) Autophagy activators suppressed cystogenesis in the pkd1a-/- embryos. Embryos derived from heterozygous pkd1a inter-crosses were incubated with vehicle (D) or autophagy activators (R: 400 nM,; C: 20 μM; or M: 400 nM) at 2.5 dpf for 16 h. Percentage of embryos with kidney cysts was analysed by HE staining of JB-4 sections. Note: rapamycin, but not other drugs, led to cyst formation in 14% of wild type embryos. (D) Autophagy activators preserved kidney excretion function in the pkd1a-/- embryos. Embryos at 2.5 dpf were treated with vehicle (D) or autophagy activators (R, C, or M) for 16 h, and kidney fluid flow was analysed via dye injection. (E) Autophagy activators promoted the clearance of ubiquitinated protein aggregates. Human PKD1-/- cells were incubated with MG132 and 13 h later MG132 was removed and replaced with vehicle (D) or autophagy activators (R, C, or M) for 11 h. Insoluble fractions of the cell lysates were subjected to Western blot analysis using an Ub antibody. Shown is a representative blot of three independent experiments. (F) Low doses of rapamycin significantly alleviated cyst formation in the pkd1a-/- embryos when combined with low doses of carbamazepine. Embryos at 2.5 dpf were treated with 40 nM rapamycin (R), 2 μM carbamazepine (C), or 40 nM rapamycin plus 2 µM carbamazepine (R + C). Data are presented as means ± s.d. from three independent experiments, and 7 to24 embryos per group were scored in each experiment (C,D,F). *: P <0.05. **: P <0.01. NS: not statistically significant (P >0.05).

Comment in

Similar articles

Cited by

References

    1. Harris P.C., Torres V.E. (2009) Polycystic kidney disease. Annu. Rev. Med., 60, 321–337. - PMC - PubMed
    1. Torres V.E., Harris P.C. (2014) Strategies targeting cAMP signaling in the treatment of polycystic kidney disease. J. Am. Soc. Nephrol., 25, 18–32. - PMC - PubMed
    1. Kim Y.C., Guan K.L. (2015) mTOR: a pharmacologic target for autophagy regulation. J. Clin. Invest., 125, 25–32. - PMC - PubMed
    1. Laplante M., Sabatini D.M. (2012) mTOR signaling in growth control and disease. Cell, 149, 274–293. - PMC - PubMed
    1. Laplante M., Sabatini D.M. (2009) mTOR signaling at a glance. J. Cell Sci., 122, 3589–3594. - PMC - PubMed

MeSH terms