. 2017 Jan 2;216(1):199-215.
doi: 10.1083/jcb.201602002. Epub 2016 Dec 22.

A reverse signaling pathway downstream of Sema4A controls cell migration via Scrib

Affiliations

A reverse signaling pathway downstream of Sema4A controls cell migration via Scrib

Tianliang Sun et al. J Cell Biol. .

Abstract

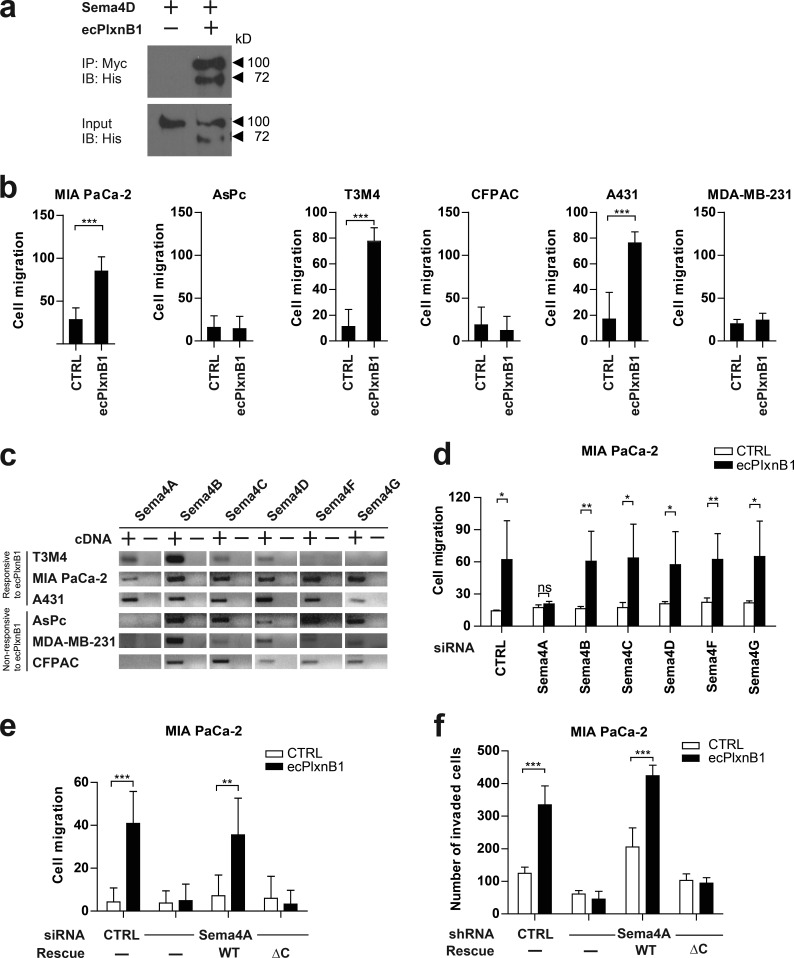
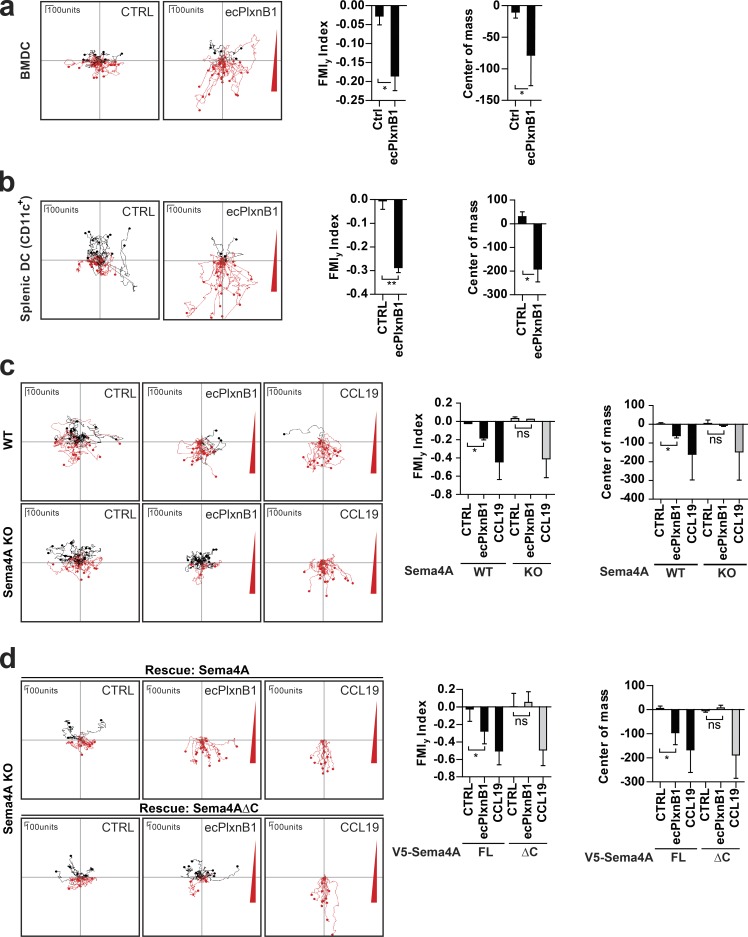
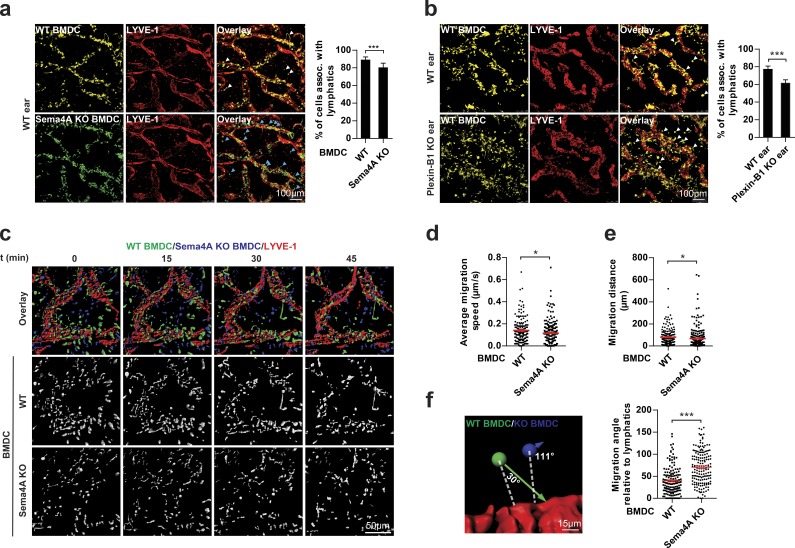
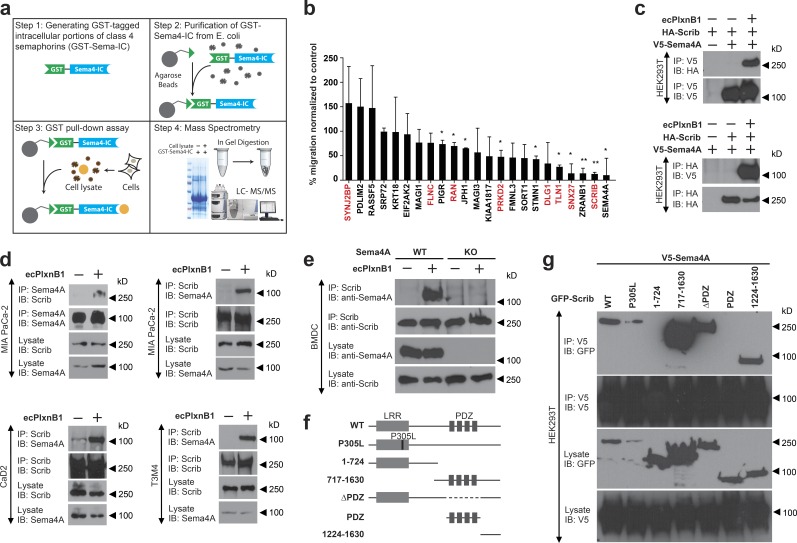
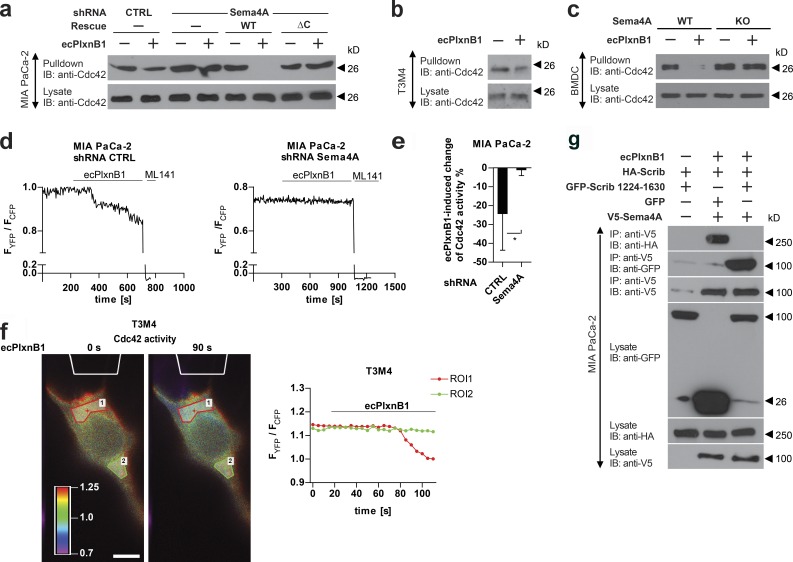
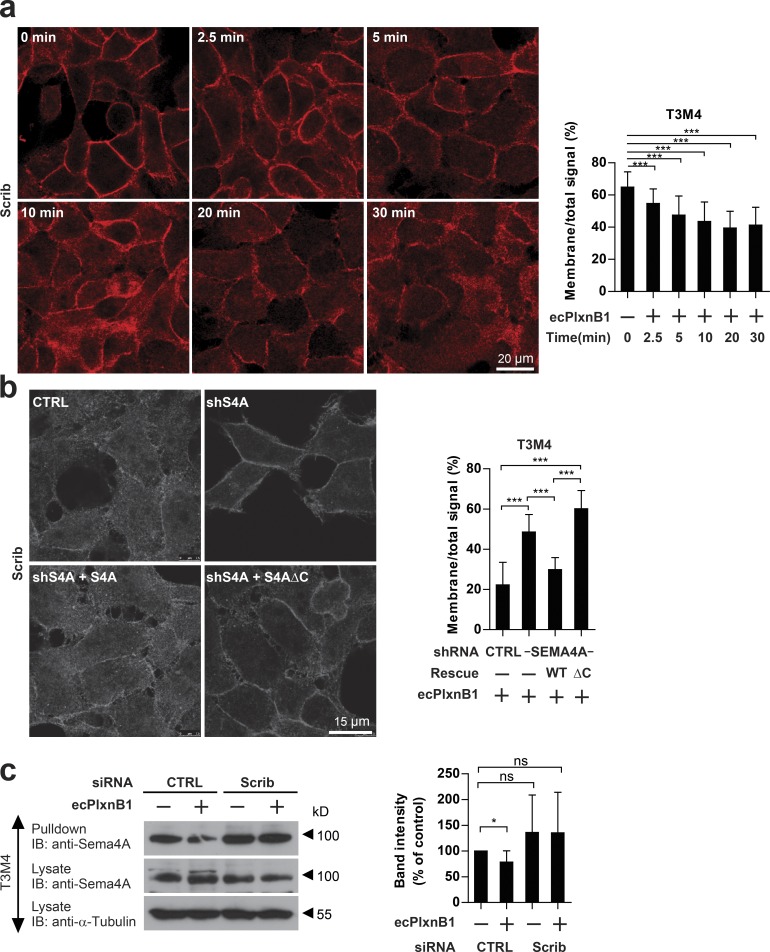
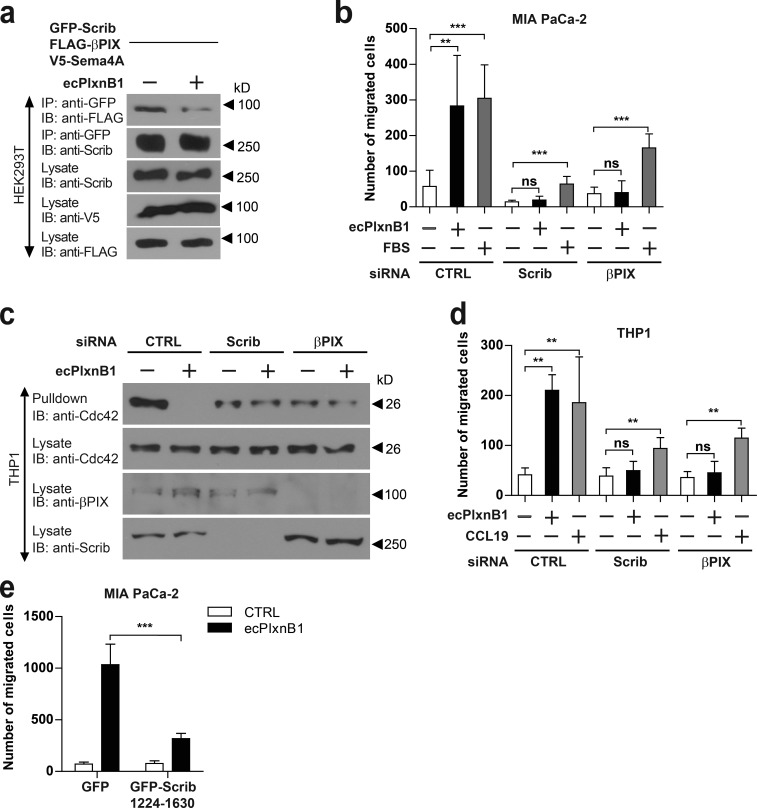
Semaphorins comprise a large family of ligands that regulate key cellular functions through their receptors, plexins. In this study, we show that the transmembrane semaphorin 4A (Sema4A) can also function as a receptor, rather than a ligand, and transduce signals triggered by the binding of Plexin-B1 through reverse signaling. Functionally, reverse Sema4A signaling regulates the migration of various cancer cells as well as dendritic cells. By combining mass spectrometry analysis with small interfering RNA screening, we identify the polarity protein Scrib as a downstream effector of Sema4A. We further show that binding of Plexin-B1 to Sema4A promotes the interaction of Sema4A with Scrib, thereby removing Scrib from its complex with the Rac/Cdc42 exchange factor βPIX and decreasing the activity of the small guanosine triphosphatase Rac1 and Cdc42. Our data unravel a role for Plexin-B1 as a ligand and Sema4A as a receptor and characterize a reverse signaling pathway downstream of Sema4A, which controls cell migration.


Figures

Figure 1.
Figure 1.
Plexin-B1 promotes cancer cell migration and invasion through its receptor Sema4A. (a) A purified His-Myc–tagged extracellular portion of Plexin-B1 (ecPlxnB1; amino acids 20–534 of human Plexin-B1) and His-tagged Sema4D were mixed in equimolar concentrations and incubated in the presence of anti-Myc antibodies. Protein complexes were then precipitated using protein A/G agarose. Proteins were immunoblotted and visualized using an anti-His antibody. IB, immunoblotting; IP, immunoprecipitation. (b) MIA PaCa-2, AsPc, T3M4, CFPAC, A431, or MDA-MB-231 cells were seeded onto 96-transwell migration plates in the absence or presence of 150 nM ecPlxnB1, and cell migration was analyzed as described in Materials and methods. Shown are mean values ± SD from duplicates of three independent experiments (total n = 6 per condition). CTRL, control. (c) Expression analysis of class 4 semaphorins in cancer cell lines by RT-PCR. (d) MIA PaCa-2 cells were transfected with control or siRNA directed against Sema4A, B, C, D, F, or G (as indicated). Cell migration in the absence or presence of 150 nM ecPlxnB1 was tested using a transwell system as described in Materials and methods. Shown are mean values ± SD of three independent experiments (total n = 5 per condition). ns, not significant. (e) MIA PaCa-2 cells were transfected with control or Sema4A siRNA. After 48 h, cells were transfected with cDNA encoding siRNA-resistant wild-type or mutant Sema4A lacking the intracellular part. Cell migration was tested using a transwell system. Shown are mean values ± SD from duplicates of three independent experiments (total n = 6 per condition). (f) MIA PaCa-2 cells were stably transfected with either control shRNA or shRNA against Sema4A. Where indicated, cells were additionally transfected with cDNA encoding shRNA-resistant wild-type Sema4A (WT) or shRNA-resistant Sema4A lacking its intracellular portion (∆C). Cells were seeded onto Matrigel-coated filters (total n = 6 per condition). Invaded cells were stained and counted. Error bars represent means ± SD. *, P < 0.05; **, P < 0.01; ***, P < 0.001.
Figure 2.
Figure 2.
Plexin-B1–Sema4A reverse signaling regulates DC migration in vitro. (a–d) The migratory behavior of mature BMDCs (a, c, and d) or splenic DCs (b) exposed to control buffer (CTRL), to a gradient of ecPlxnB1, or to a gradient of CCL19 was analyzed as described in Materials and methods. Gradients are indicated by a red triangle at the right side of the depicted plots. Each line represents a track of an individual cell. Cell tracks with an endpoint in the top half of the plot (i.e., on the side of the lower agonist concentration) are labeled in black, and cell tracks with an endpoint in the bottom half of the plot (i.e., on the side of the higher agonist concentration) are labeled in red. (c) Mature BMDCs generated from wild-type (WT) or Sema4A knockout (KO) mice were examined. ns, not significant. (d) BMDCs isolated from Sema4A knockout mice were infected with lentiviruses carrying full-length wild-type Sema4A (V5-Sema4A FL) or Sema4A lacking the intracellular part (V5-Sema4AΔC). After maturation, cell migration was analyzed. FMIy, y-forward migration index. Total numbers of analyzed cells are CTRL, n = 57 and ecPlxnB1, n = 51 (a); CTRL, n = 32 and ecPlxnB1, n = 60 (b); WT/CTRL, n = 47; WT/ecPlxnB1, n = 38; WT/CCL19, n = 43; KO/CTRL, n = 36; KO/ecPlxnB1, n = 30; and KO/CCL19, n = 40 (c); and FL/CTRL, n = 26; FL/ecPlxnB1, n = 34; FL/CCL19, n = 25; ΔC/CTRL, n = 26; ΔC/ecPlxnB1, n = 33; and ΔC/CCL19, n = 31 (d). Error bars represent means ± SD. *, P < 0.05; **, P < 0.01.
Figure 3.
Figure 3.
Plexin-B1 and Sema4A regulate DC migration ex vivo. (a) Mature BMDCs generated from wild-type (WT) and Sema4A knockout mice (Sema4A KO) were fluorescently labeled (WT, yellow; Sema4A KO, green), mixed 1:1, and used for the ex vivo migration assay (right). After 1.5 h, BMDCs associated with lymphatic vessels were quantified (left). Examples of wild-type (white arrows) and Sema4A-knockout (blue arrows) BMDCs not associated with lymphatic vessels are marked. (b) Mature BMDCs generated from wild-type mice were allowed to migrate into ear sheets of wild-type or Plexin-B1 knockout mice for 1.5 h (right). BMDCs associated with lymphatic vessels were quantified (left). Examples of BMDCs not associated with lymphatic vessels are marked with white arrows. (c) Mature BMDCs generated from wild-type and Sema4A knockout mice were fluorescently labeled (WT, green; Sema4A KO, blue), mixed 1:1, and used for live-cell imaging (different time points shown). (d and e) Quantification of migration speed (d) and distance (e) of BMDCs with the indicated genotypes. (f) Analysis of the migration angle of BMDCs relative to the lymphatic vessel. Dashed white lines represent the shortest possible distance to lymphatic vessels. Red horizontal lines indicate means ± SEM. Colored arrows represent vectors of BMDC migration. Bar graphs in a and b show mean values ± SD from three independent experiments. Graphs in d–f are based on six independent experiments. Total numbers of analyzed cells are WT, n = 1,993 and Sema4A KO, n = 1,785 (a); WT ear, n = 1,786 and Plexin-B1 KO ear, n = 1,560 (b); WT, n = 172 and Sema4A KO, n = 239 (d and e); and WT, n = 157 and Sema4A KO, n = 164 (f). Error bars represent means ± SD (a and b) or SEM (d–f). *, P < 0.05; ***, P < 0.001.
Figure 4.
Figure 4.
Scrib mediates reverse signaling of Sema4A. (a) Workflow for the identification of proteins interacting with the intracellular portion (IC) of class 4 semaphorins by mass spectrometry. For details, see Materials and methods. (b) MIA PaCa-2 cells transfected with the indicated siRNAs were examined in transwell migration assays in the absence or presence of 150 nM ecPlxnB1. The ecPlxnB1-induced effect on cells transfected with siRNA directed against the gene of interest is normalized to the ecPlxnB1-induced effect on cells transfected with control siRNA (percentage). Genes encoding for proteins identified as potential Sema4A-interacting partners by the GST pulldown approach are colored in red. Error bars represent the mean ± SD. (c) HEK293T cells were transfected with plasmids encoding HA-tagged Scrib (HA-Scrib) alone or together with V5-tagged Sema4A (V5-Sema4A). After serum starvation and stimulation with or without ecPlxnB1, cells were lysed, and proteins were immunoprecipitated (IP) using anti-V5 or anti-HA antibodies coupled to protein A/G sepharose. Bound proteins were then separated and visualized using anti-HA or anti-V5 antibodies (as indicated). (d) MIA PaCa-2, CaD2, or T3M4 cells were serum starved and stimulated as indicated. Sema4A or Scrib were immunoprecipitated using the respective antibodies (IP). Protein complexes were visualized by Western blotting (immunblotting [IB]). (e) Mature BMDCs were generated from wild-type mice (WT) or Sema4A knockout mice (Sema4A KO). Cells were stimulated with or without 150 nM ecPlxnB1 and lysed, and protein complexes were immunoprecipitated using anti Scrib antibodies. Proteins were then immunoblotted using specific antibodies as indicated. (f) Schematic representation of GFP-tagged Scrib constructs used in this study. (g) HEK293T cells were transfected with V5-tagged Sema4A and constructs encoding GFP-tagged wild-type or deletion mutants of Scrib (as indicated). Protein complexes were immunoprecipitated in the presence of 150 nM ecPlxnB1 using anti-V5 antibody and visualized using the indicated antibodies. Error bars represent means ± SD. *, P < 0.05.
Figure 5.
Figure 5.
Sema4A reverse signaling regulates the activity of Rac1 and Cdc42. (a) MIA PaCa-2 cells stably expressing control shRNA or Sema4A shRNA either alone or together with shRNA-resistant wild-type (WT) or mutated (ΔC) Sema4A (as indicated) were starved and stimulated with or without 150 nM ecPlxnB1, and active Cdc42 was precipitated as described in Materials and methods. (b) T3M4 cells were treated with or without 150 nM ecPlxnB1, and Cdc42 activity was measured (pulldown). (c) Mature BMDCs generated from wild-type or Sema4A knockout mice (Sema4A KO) were stimulated with or without 150 nM ecPlxnB1 for 20 min. Cells were then lysed and the activity of Cdc42 was analyzed (pulldown). (d and e) MIA PaCa-2 cells stably expressing control or Sema4A shRNA were transfected with a FRET biosensor for Cdc42 and FRET ratios in response to 150 nM ecPlxnB1, and 100 µM of the Cdc42 inhibitor ML141 were analyzed as described in Materials and methods. (d) Representative traces are shown. CTRL, control. (e) The ecPlxnB1-induced change of Cdc42 activity was calculated as a percentage of the difference between the FRET ratio at baseline (before treatments) and the FRET ratio after ML141 treatment. n = 12 for control shRNA, n = 8 for Sema4A shRNA. (f) ecPlxnB1 was applied to one side of a T3M4 cell through a micropipette (as outlined in white at the top of the images) as described in Materials and methods. Shown are representative images and the corresponding FRET ratios within two different areas of the cell over time. The regions of interest (ROIs) indicate regions proximal or distal to the site of ecPlxnB1 application, respectively. Bar, 10 µm. (g) MIA PaCa-2 cells were transfected with constructs encoding HA-Scrib, V5-Sema5A, and the GFP-tagged C-terminal portion of Scrib (GFP-Scrib amino acids 1224–1630) as indicated. Cells were stimulated with or without 150 nM ecPlxnB1. Proteins interacting with Sema4A were immunoprecipitated using V5 antibody and visualized using respective antibodies. IB, immunoblotting; IP, immunoprecipitation. Error bars represent means ± SD. *, P < 0.05.
Figure 6.
Figure 6.
Plexin-B1–Sema4A signaling induces internalization of Scrib. (a) T3M4 cells were incubated with or without 150 nM ecPlxnB1, and Scrib was visualized by immunostaining at the indicated time points after application of ecPlxnB1. Scrib localization was analyzed using ImageJ as described in Materials and methods. Time point 0 min: n = 41; 2.5 min: n = 61; 5 min: n = 54; 10 min: n = 53; 20 min: n = 26; 30 min: n = 45. (b) T3M4 cells stably transfected with control shRNA or with Sema4A shRNA alone or together with either shRNA-resistant wild-type Sema4A (S4A) or an shRNA-resistant Sema4A intracellular deletion mutant (S4AΔC) were incubated with 150 nM ecPlxnB1 for 30 min, and Scrib was visualized by immunostaining. Scrib localization was analyzed using ImageJ as described in Materials and methods. Bar graphs show mean values ± SD from at least 10 cells per condition. (c) Surface proteins of T3M4 cells transfected with control or Scrib were biotinylated. Cells were then incubated with or without 150 nM ecPlxnB1 for 30 min, surface proteins were precipitated using streptavidin agarose, and bound Sema4A was visualized by Western blotting using an anti-Sema4A antibody (pulldown; right). Band intensities were quantified from six independent Western blots (left). ns, not significant. CTRL, control; IB, immunoblotting. Error bars represent means ± SD. *, P < 0.05; ***, P < 0.001.
Figure 7.
Figure 7.
Scrib and βPIX are required for Plexin-B1–Sema4A reverse signaling. (a) HEK293T cells transfected with V5-Sema4A, GFP-Scrib, and FLAG-βPIX were stimulated with or without 150 nM ecPlxnB1. Protein complexes were precipitated using anti-GFP antibodies and visualized with immunoblotting (IB). IP, immunoprecipitation. (b) MIA PaCa-2 cells were transfected with siRNAs as indicated, and cell migration in response to 150 nM ecPlxnB1 or 10% FBS in a transwell system was analyzed as described in Materials and methods (total n = 6 per condition). (c and d) THP1 cells were fully differentiated to DCs as described in Materials and methods. Cells were then stimulated with 150 nM ecPlxnB1 or 25 ng/ml CCL19 (as indicated), and Cdc42 activity (c) and cell migration (d) was analyzed by using a transwell system as described in Materials and methods (total n = 6 per condition). ns, not significant. CTRL, control. (e) MIA PaCa-2 cells were transfected with cDNAs encoding GFP or GFP-Scrib (amino acids 1224–1630), and cell migration in response to ecPlxnB1 was measured as described in Materials and methods. Shown are mean values ± SD from three independent experiments (total n = 8 per condition). Error bars represent means ± SD. **, P < 0.01; ***, P < 0.001.

Similar articles

Cited by

References

    1. Anastasilakis A.D., Polyzos S.A., Makras P., Gkiomisi A., Sakellariou G., Savvidis M., Papatheodorou A., Kokkoris P., and Terpos E.. 2015. Circulating semaphorin-4D and plexin-B1 levels in postmenopausal women with low bone mass: the 3-month effect of zoledronic acid, denosumab or teriparatide treatment. Expert Opin. Ther. Targets. 19:299–306. 10.1517/14728222.2014.983078 - DOI - PubMed
    1. Andermatt I., Wilson N.H., Bergmann T., Mauti O., Gesemann M., Sockanathan S., and Stoeckli E.T.. 2014. Semaphorin 6B acts as a receptor in post-crossing commissural axon guidance. Development. 141:3709–3720. 10.1242/dev.112185 - DOI - PMC - PubMed
    1. Armendáriz B.G., Bribian A., Pérez-Martínez E., Martínez A., de Castro F., Soriano E., and Burgaya F.. 2012. Expression of Semaphorin 4F in neurons and brain oligodendrocytes and the regulation of oligodendrocyte precursor migration in the optic nerve. Mol. Cell. Neurosci. 49:54–67. 10.1016/j.mcn.2011.09.003 - DOI - PubMed
    1. Artigiani S., Barberis D., Fazzari P., Longati P., Angelini P., van de Loo J.W., Comoglio P.M., and Tamagnone L.. 2003. Functional regulation of semaphorin receptors by proprotein convertases. J. Biol. Chem. 278:10094–10101. 10.1074/jbc.M210156200 - DOI - PubMed
    1. Audebert S., Navarro C., Nourry C., Chasserot-Golaz S., Lécine P., Bellaiche Y., Dupont J.L., Premont R.T., Sempéré C., Strub J.M., et al. . 2004. Mammalian Scribble forms a tight complex with the βPIX exchange factor. Curr. Biol. 14:987–995. 10.1016/j.cub.2004.05.051 - DOI - PubMed

Publication types

MeSH terms