. 2017 Mar 1;34(3):598-612.
doi: 10.1093/molbev/msw254.

Complex Admixture Preceded and Followed the Extinction of Wisent in the Wild

Affiliations

Complex Admixture Preceded and Followed the Extinction of Wisent in the Wild

Karolina Wecek et al. Mol Biol Evol. .

Abstract

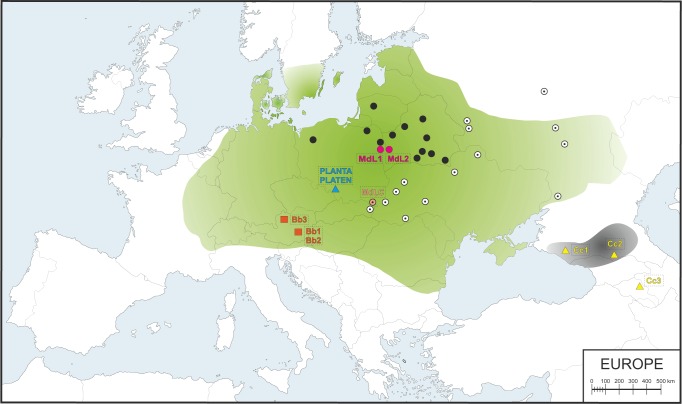
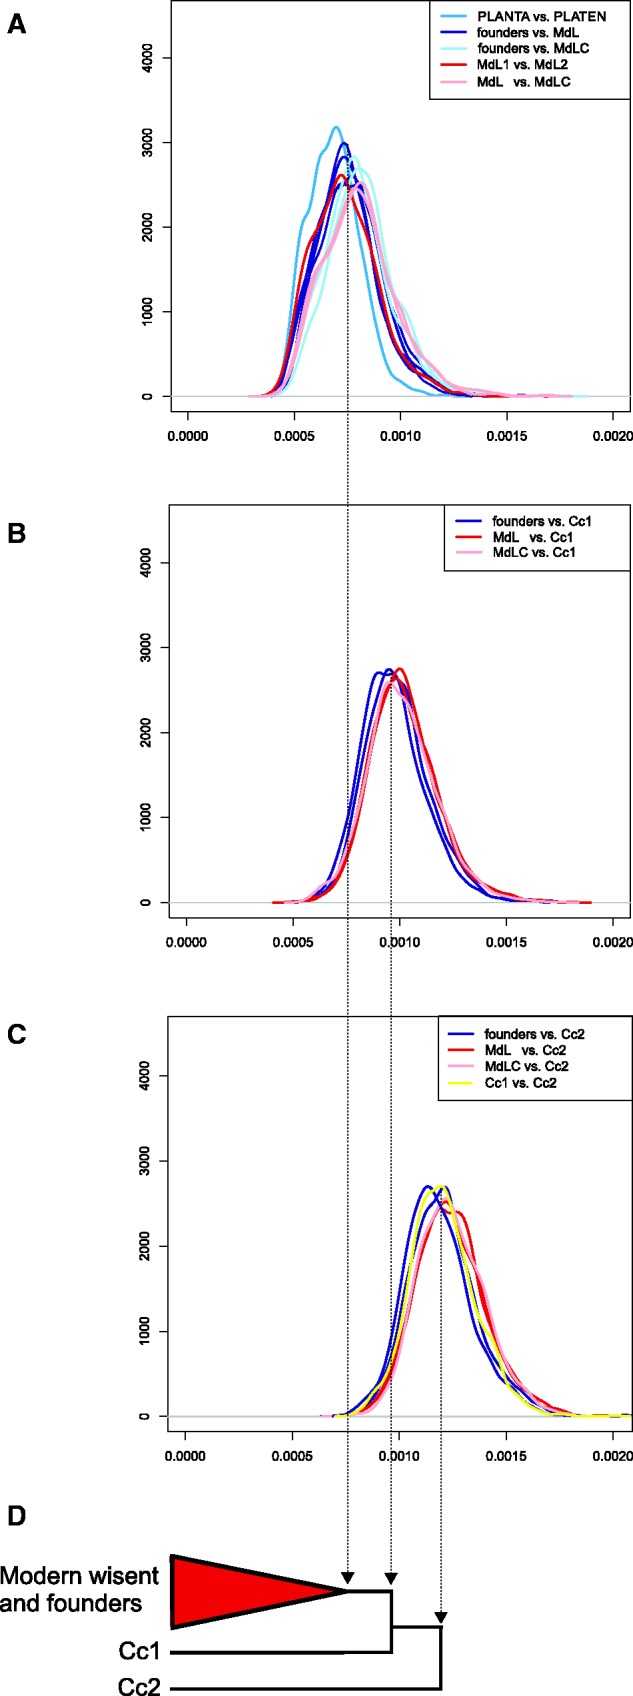
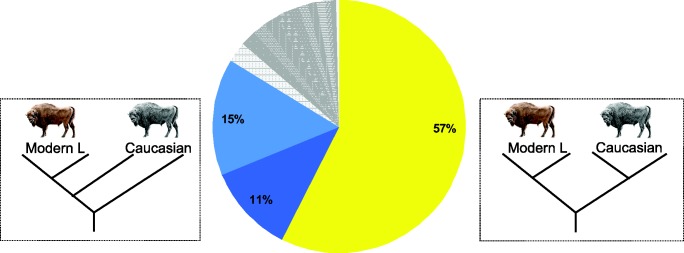
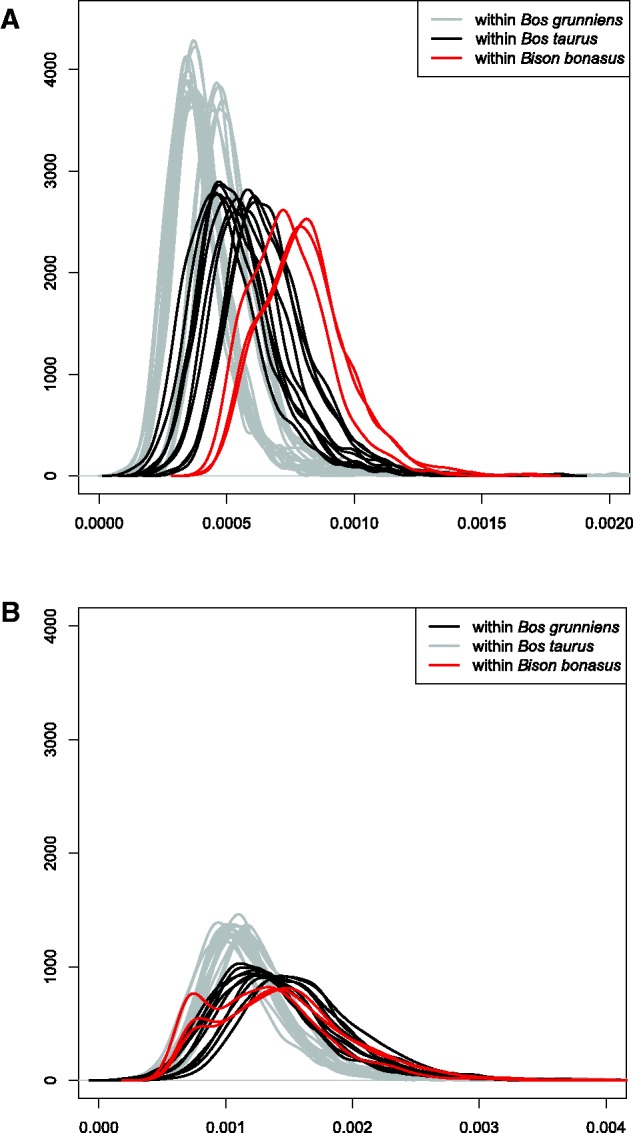
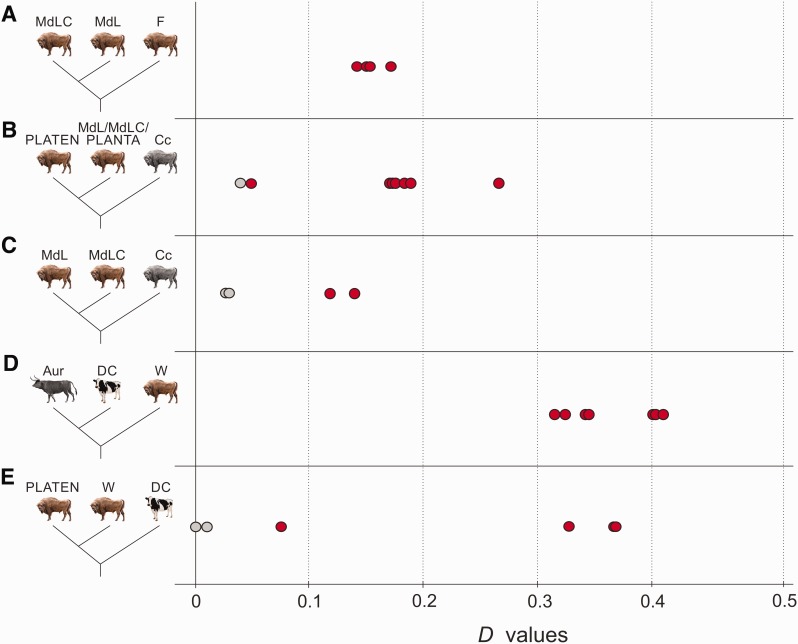
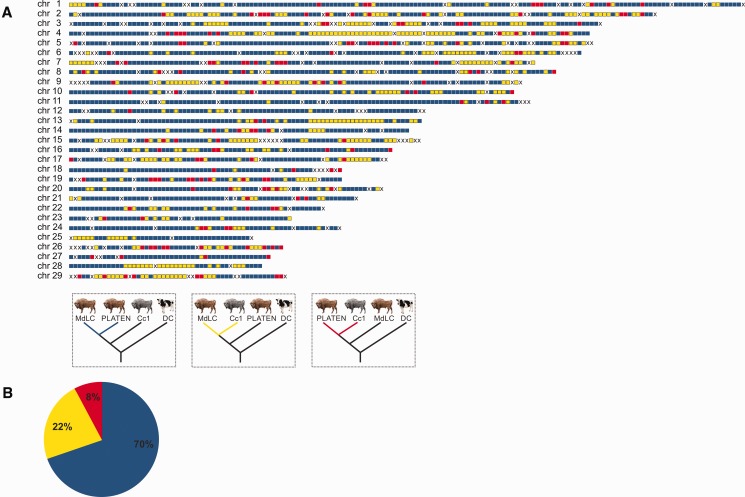
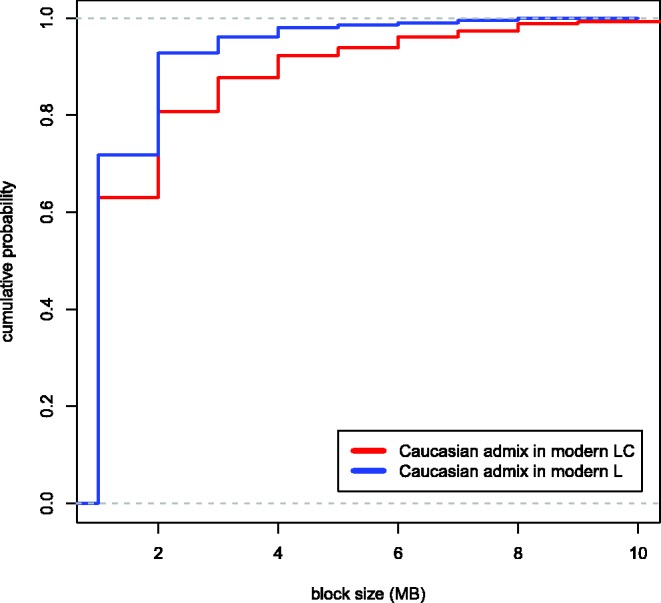
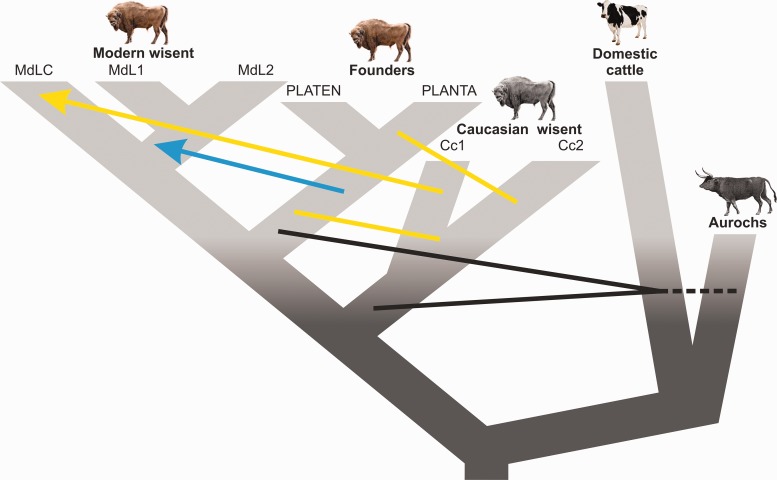
Retracing complex population processes that precede extreme bottlenecks may be impossible using data from living individuals. The wisent (Bison bonasus), Europe's largest terrestrial mammal, exemplifies such a population history, having gone extinct in the wild but subsequently restored by captive breeding efforts. Using low coverage genomic data from modern and historical individuals, we investigate population processes occurring before and after this extinction. Analysis of aligned genomes supports the division of wisent into two previously recognized subspecies, but almost half of the genomic alignment contradicts this population history as a result of incomplete lineage sorting and admixture. Admixture between subspecies populations occurred prior to extinction and subsequently during the captive breeding program. Admixture with the Bos cattle lineage is also widespread but results from ancient events rather than recent hybridization with domestics. Our study demonstrates the huge potential of historical genomes for both studying evolutionary histories and for guiding conservation strategies.

Keywords: Bison bonasus; European bison; admixture; ancient DNA; aurochs; domestic cattle; hybridization..


Figures

Fig. 1
Fig. 1
Map of Western Europe showing the putative historical range of Lowland wisent (shaded green) and Caucasian wisent (shaded grey) based on bone remains and written records (according to Benecke 2005; Kuemmerle et al. 2011; Tokarska et al. 2011; Bocherens et al. 2015) and sample locations. Black circles indicate contemporary free-ranging modern L line herds and white circles indicate modern LC line herds. Purple and peach circles denote the locations of investigated modern L (MdL1, MdL2) and LC (MdLC) line wisent, respectively, orange squares show the location of the Holocene Lowland wisent (Bb1–3) and blue and yellow triangles indicate historical founding wisent from the Pszczyna population (PLANTA and PLATEN) and the extinct Caucasian wisent (Cc1–3), respectively.
Fig. 2
Fig. 2
Pairwise genomic divergence among wisent. A, B, C, show probability densities for pairwise transversion divergence (x axes) along a sliding window of 1 Mb. Individual plots show all pairwise comparisons among modern and founding individuals (A); comparisons of modern and founding individuals and Caucasian wisent Cc1 (B); and comparisons of Caucasian wisent Cc2 and all other individuals (C). Specific comparisons discussed in the text are identified by colors, according to the key at the top right of each plot. Schematic neighbor-joining phylogeny based on whole genome distances (D).
Fig. 3
Fig. 3
Population history of Lowland and Caucasian wisent, estimated using two representatives of each. The pie chart shows the percentage of 1 Mb genomic blocks supporting each alternatively rooted tree topology. This indicates fraction of genome blocks returning both wisent subspecies as reciprocally monophyletic. Dark and light blue colors show the next most frequently encountered topologies in which Caucasian wisent are paraphyletic (dark blue: Cc2 most divergent, and light blue: Cc1 most divergent, the first of which is compatible with estimates pairwise genomic divergence; see fig 2D).
Fig. 4
Fig. 4
Comparison of pairwise genomic divergence within three bovid species: wisent (Bison bonasus), domestic cattle (Bos taurus), and yak (Bos grunniens). Probability densities were calculated along a sliding window of 1 Mb from transversions only (A), and from transitions and transversions (B). For wisent, only modern samples included.
Fig. 5
Fig. 5
Results of D statistical analysis. Red and grey points show significant and nonsignificant D values (x axis), respectively, and show: the genetic contribution of the founders (F) to the modern individuals (A); Caucasian wisent (Cc) admixture with modern L and LC herds (MdL and MdLC) and one founder, PLANTA, relative to the least Caucasian admixed wisent, founder PLATEN (B); Caucasian wisent admixture among modern wisent (C); apparent cattle (DC) admixture with all investigated wisent (W) relative to aurochs (Aur) (D); variance in cattle/aurochs admixture among wisent (W) compared to PLATEN (E). Detailed D statistic results are provided in supplementary table S5, Supplementary Material online.
Fig. 6
Fig. 6
Genomic admixture map (A) of Caucasian wisent ancestry in the modern LC line individual (MdLC). Colored blocks indicate 1 Mb genomic blocks returning alternative tree topologies, blue blocks are compatible with the species tree; yellow blocks return the monophly of the modern LC line and Caucasian wisent, and likely result from admixture and to a lesser extent incomplete lineage sorting; red blocks return the monophyly of PLATEN and Caucasian wisent and likely result from incomplete lineage sorting. “X” shows blocks with missing data. The pie chart (B) shows the percentage of 1 Mb genomic supporting each tree topology identified by colors, according to the key presented above.
Fig. 7
Fig. 7
Variation in the sizes of genomic blocks in modern L (blue) and LC (red) likely resulting from Caucasian wisent admixture. Plots show cumulative probability densities calculated at a scale of 1 Mb. Genomic blocks in the LC line wisent (red) result from admixture occurring around 90 years ago; the lower abundance of larger admixed blocks in the modern L line wisent support that this admixture event preceded the former. The plots have been truncated to aid visualization, and single blocks of 18 and 22 Mb in the LC line individual are not shown. The largest block size detected in the modern L line individual was 8 Mb.
Fig. 8
Fig. 8
Schematic diagram showing inferred admixture among wisent, and among wisent and the cattle/aurochs lineage. Arrows indicate the direction of the geneflow. Black lines indicate admixture between wisent and cattle/aurochs, yellow lines/arrow—between Caucasian and founding or modern wisent respectively, and the blue arrow—from founders to modern wisent.

References

    1. Altizer S, Nunn CL, Lindenfors P. 2007. Do threatened hosts have fewer parasites? A comparative study in primates. J Anim Ecol. 76:304–314. - PubMed
    1. Babik W, Kawałko A, Wójcik JM, Radwan J. 2012. Low major histocompatibility complex class I (MHC I) variation in the European bison (Bison bonasus). J Hered. 349–359. - PubMed
    1. Basrur PK. 1968. Hybrid sterility In: Benirschke K, editor. Comparative Mammalian Cytogenetics. Springer, New York: p. 107–131.
    1. Benecke N. 2005. The Holocene distribution of European bison—the archaeozoological record. Munibe 57:421–428.
    1. Bibi F. 2013. A multi-calibrated mitochondrial phylogeny of extant Bovidae (Artiodactyla, Ruminantia) and the importance of the fossil record to systematics. BMC Evol Biol. 13:166.. - PMC - PubMed

Publication types

LinkOut - more resources