

Secreted Proteins Defy the Expression Level-Evolutionary Rate Anticorrelation
- PMID: 28007979
- PMCID: PMC5896516
- DOI: 10.1093/molbev/msw268
Secreted Proteins Defy the Expression Level-Evolutionary Rate Anticorrelation
Abstract
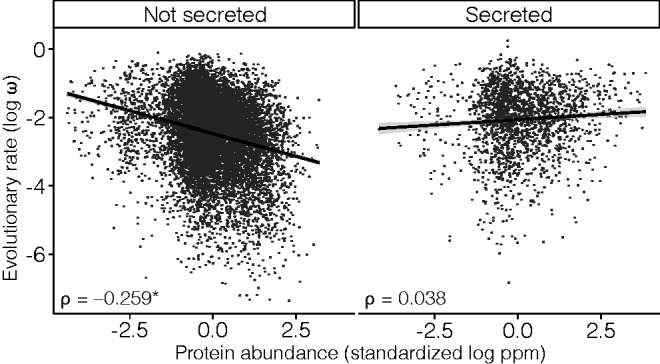
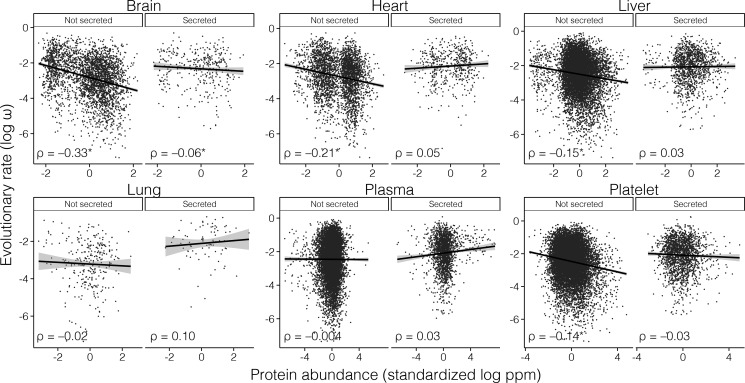
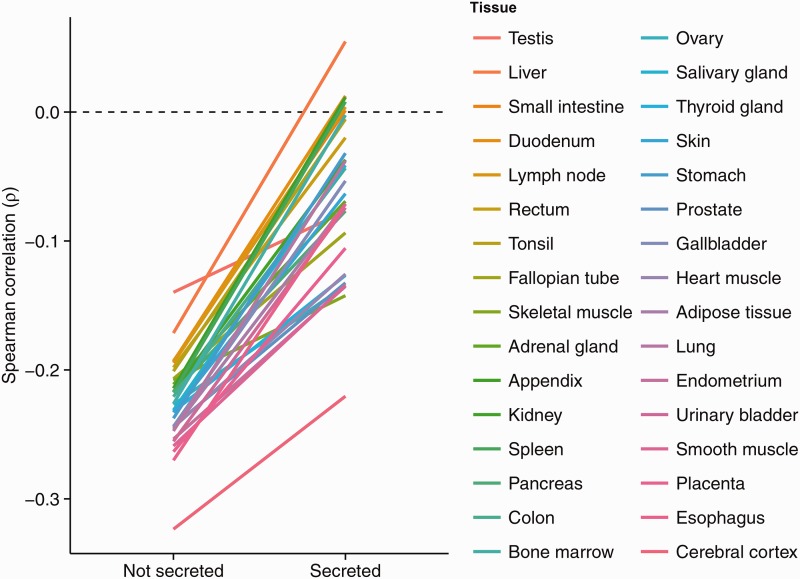
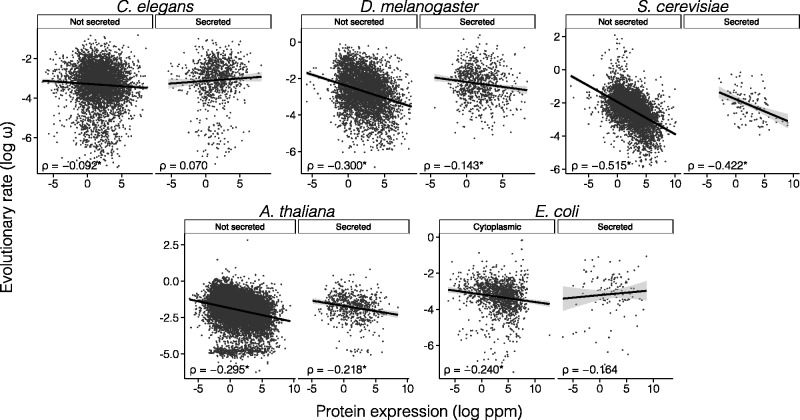
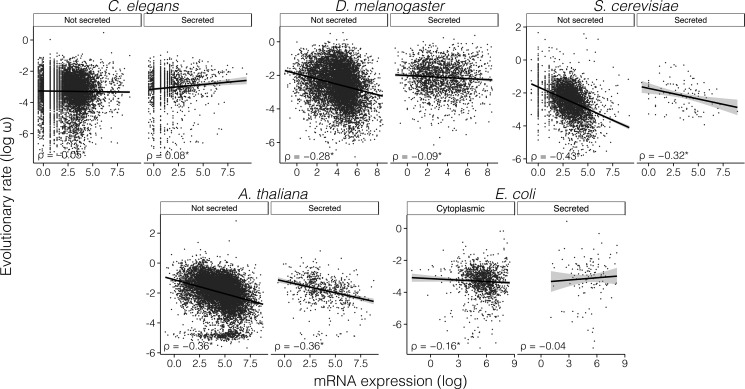
The rates of evolution of the proteins of any organism vary across orders of magnitude. A primary factor influencing rates of protein evolution is expression. A strong negative correlation between expression levels and evolutionary rates (the so-called E-R anticorrelation) has been observed in virtually all studied organisms. This effect is currently attributed to the abundance-dependent fitness costs of misfolding and unspecific protein-protein interactions, among other factors. Secreted proteins are folded in the endoplasmic reticulum, a compartment where chaperones, folding catalysts, and stringent quality control mechanisms promote their correct folding and may reduce the fitness costs of misfolding. In addition, confinement of secreted proteins to the extracellular space may reduce misinteractions and their deleterious effects. We hypothesize that each of these factors (the secretory pathway quality control and extracellular location) may reduce the strength of the E-R anticorrelation. Indeed, here we show that among human proteins that are secreted to the extracellular space, rates of evolution do not correlate with protein abundances. This trend is robust to controlling for several potentially confounding factors and is also observed when analyzing protein abundance data for 6 human tissues. In addition, analysis of mRNA abundance data for 32 human tissues shows that the E-R correlation is always less negative, and sometimes nonsignificant, in secreted proteins. Similar observations were made in Caenorhabditis elegans and in Escherichia coli, and to a lesser extent in Drosophila melanogaster, Saccharomyces cerevisiae and Arabidopsis thaliana. Our observations contribute to understand the causes of the E-R anticorrelation.
Keywords: E–R anticorrelation; dN/dS; expression levels; rates of evolution; secreted proteins..
© The Author 2016. Published by Oxford University Press on behalf of the Society for Molecular Biology and Evolution. All rights reserved. For permissions, please e-mail: journals.permissions@oup.com.
Figures
References
-
- Alvarez-Ponce D. 2014. Why proteins evolve at different rates: the determinants of proteins’ rates of evolution In: Fares MA, editor. Natural selection: methods and applications. London: CRC Press (Taylor & Francis; ). p. 126–178.
MeSH terms
Substances
Grants and funding
LinkOut - more resources
Full Text Sources
Other Literature Sources
Molecular Biology Databases
