. 2017 Jan 10;114(2):298-303.
doi: 10.1073/pnas.1613040114. Epub 2016 Dec 22.

Structure of phosphorylated UBL domain and insights into PINK1-orchestrated parkin activation

Affiliations

Structure of phosphorylated UBL domain and insights into PINK1-orchestrated parkin activation

Jacob D Aguirre et al. Proc Natl Acad Sci U S A. .

Abstract

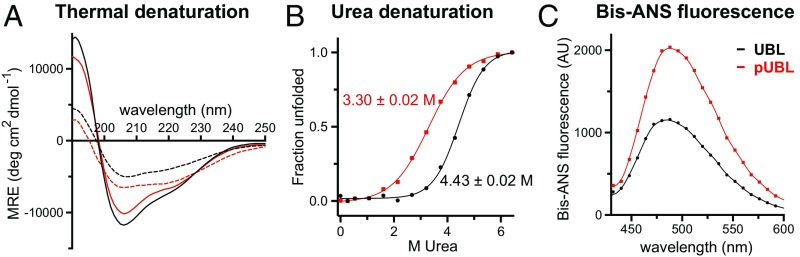
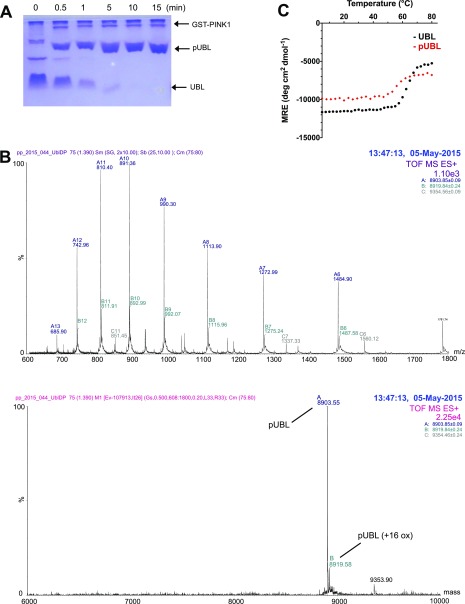
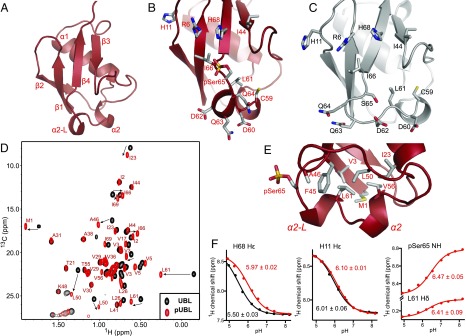
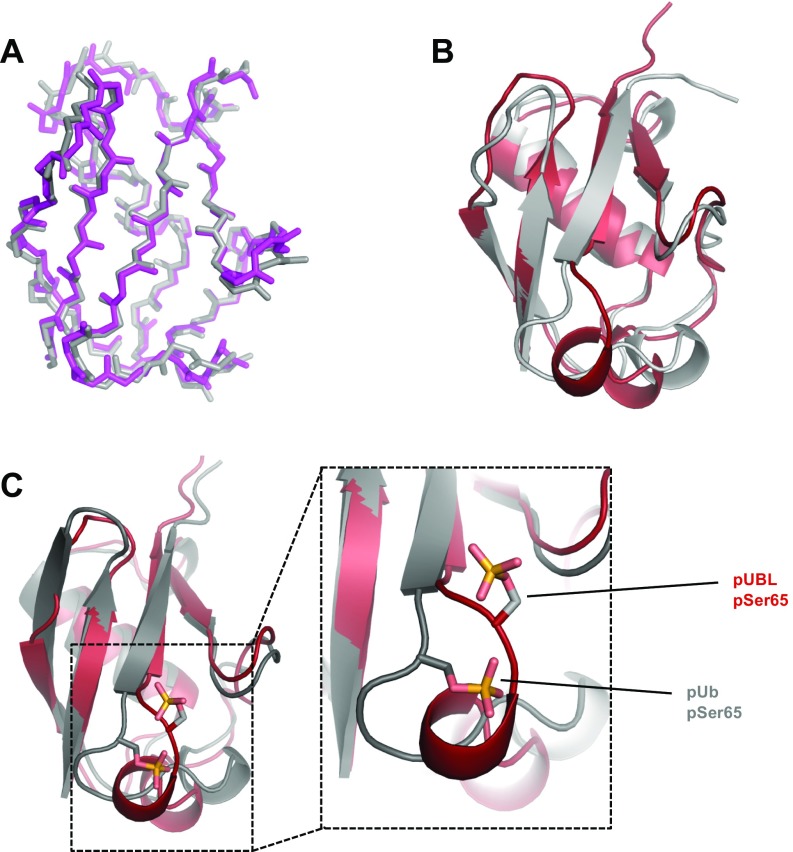
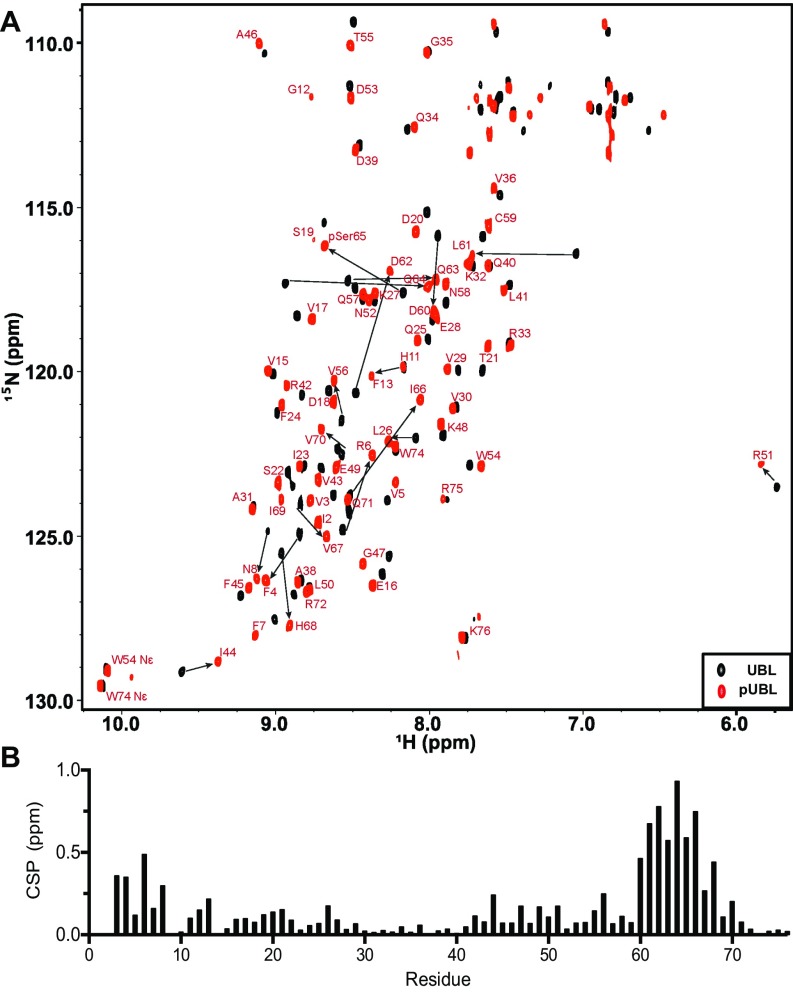
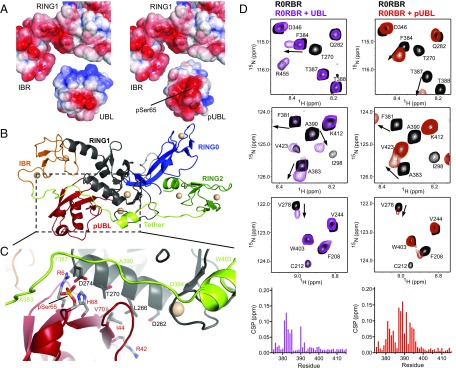
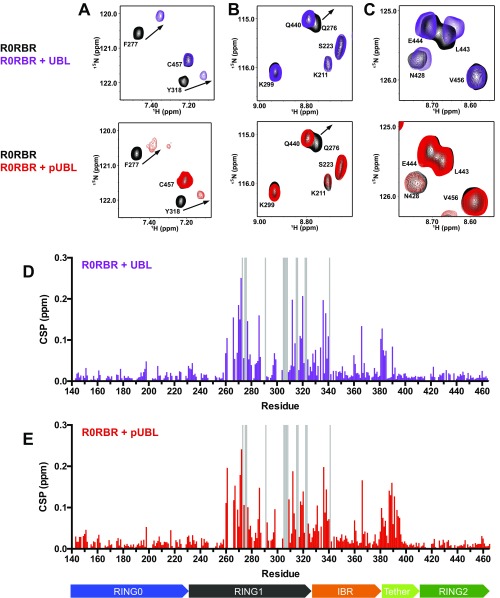
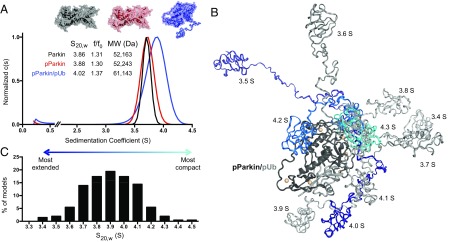
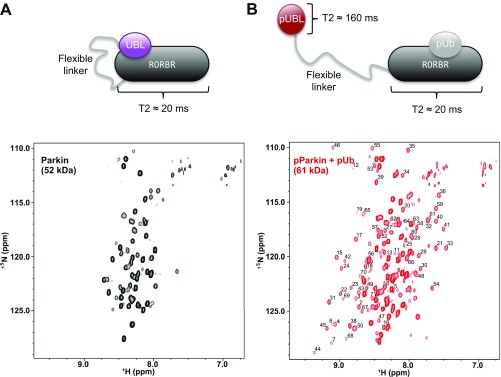
Mutations in PARK2 and PARK6 genes are responsible for the majority of hereditary Parkinson's disease cases. These genes encode the E3 ubiquitin ligase parkin and the protein kinase PTEN-induced kinase 1 (PINK1), respectively. Together, parkin and PINK1 regulate the mitophagy pathway, which recycles damaged mitochondria following oxidative stress. Native parkin is inactive and exists in an autoinhibited state mediated by its ubiquitin-like (UBL) domain. PINK1 phosphorylation of serine 65 in parkin's UBL and serine 65 of ubiquitin fully activate ubiquitin ligase activity; however, a structural rationale for these observations is not clear. Here, we report the structure of the phosphorylated UBL domain from parkin. We find that destabilization of the UBL results from rearrangements to hydrophobic core packing that modify its structure. Altered surface electrostatics from the phosphoserine group disrupt its intramolecular association, resulting in poorer autoinhibition in phosphorylated parkin. Further, we show that phosphorylation of both the UBL domain and ubiquitin are required to activate parkin by releasing the UBL domain, forming an extended structure needed to facilitate E2-ubiquitin binding. Together, the results underscore the importance of parkin activation by the PINK1 phosphorylation signal and provide a structural picture of the unraveling of parkin's ubiquitin ligase potential.

Keywords: E3 ligase; Parkinson’s disease; conformational change; phosphorylation; ubiquitin.


Conflict of interest statement

The authors declare no conflict of interest.

Figures

Fig. 1.
Fig. 1.
S65 phosphorylation destabilizes the UBL domain of parkin. (A) CD spectra of UBL (black) and pUBL (red), showing native (solid line) and thermally denatured states (dashed line), collected at 5°C and 75°C, respectively. (B) Unfolding profile of UBL and pUBL by urea denaturation as measured at 5°C by CD ellipticity at 222 nm. Observed denaturation midpoint ± SE is indicated beside each curve. (C) Bis-ANS fluorescence in the presence of UBL and pUBL. An increased fluorescence for pUBL indicates a greater exposed hydrophobic surface than for UBL.
Fig. S1.
Fig. S1.
Generation of homogenous pUBL. (A) Coomassie-stained Zn2+ PhosTag showing phosphorylation of UBL by P. humanus PINK1 (GST tagged). (B) Mass spectrum of pUBL after phosphorylation and subsequent removal of GST-PINK1. Raw and deconvoluted spectra are shown. MWcalculated: 8,904 Da (8,824 Da + PO4). (C) Thermal denaturation profile of UBL and pUBL as monitored by CD ellipticity at 205 nm.
Fig. 2.
Fig. 2.
Solution structure of pUBL. (A) Structure of Ser65-phosphorylated pUBL determined by NMR spectroscopy. Structure closest to average is represented as a cartoon with secondary structure as described in the text. (B) Expanded view of pUBL structure around pSer65. (C) UBL structure (extracted from PDB ID 5C1Z) is shown for comparison. (D) Chemical shift perturbations in methyl (CH3) resonances upon Ser65 phosphorylation. Resonance assignments for methyl groups in pUBL are indicated (red spectrum), reporting changes to the hydrophobic core upon phosphorylation. (E) Expanded view of pUBL structure showing hydrophobic residues affected by phosphorylation. (F) Chemical shifts observed during the pH titration of UBL (black curves) and pUBL (red curves). 1H chemical shifts were measured at each pH and fitted to a modified Henderson–Hasselbalch equation by nonlinear regression to determine pKa ± SE (indicated beside the curve). Titration of S65 and L61 in UBL was not observed.
Fig. S2.
Fig. S2.
Comparisons of existing structures. (A) Backbone atom overlay of existing, unphosphorylated UBL structures. Gray, mouse UBL crystal structure (PDB ID 2ZEQ) (55); magenta, human UBL crystal structure (PDB ID 5C1Z, residues 1–76) (15). Sequence identity between mouse and human orthologues is 89% and backbone RMSD between structures is 0.687 Å. (B) Superposition of solved pUBL structure (red) and UBL crystal structure (gray, PDB ID 5C1Z). The backbone rmsd between structures is 1.72 Å. (C) Superposition of solved pUBL structure (red) and pUb crystal structure (gray, PDB ID 4WZP) (21). An expanded view around the phosphorylation site is shown to demonstrate the significant conformational changes observed in UBL vs. Ub upon phosphorylation. pSer65 in ubiquitin maintains a hydrogen to the backbone amide of Q62, whereas pSer65 in UBL is oriented into solvent and facing H68.
Fig. S3.
Fig. S3.
Secondary structure propensity in phosphorylated parkin UBL. Secondary structure map from the solved pUBL structure is displayed for reference. (A) Secondary structure propensity for pUBL. Positive values are indicative of α-helical propensity and negative values indicate a propensity to β structure. SSP was determined from CA and CB chemical shift assignments, using the software “SSP” (47). pSer65 was omitted from analysis. (B) Residue plot of JHNHA3 coupling constants obtained from quantitative J3 correlation experiments. Secondary structure thresholds are indicated by dashed lines (51). (C) Chemical shift index analysis using HA, CA, and CO chemical shifts (48). A red symbol indicates an α-helical chemical shift propensity. A blue symbol indicates β-strand propensity.
Fig. S4.
Fig. S4.
Amide temperature coefficients in parkin UBL. (A) Residue plots demonstrating the effect of temperature on chemical shift in UBL (black) and pUBL (red) backbone amides. Only residues observed in both UBL and pUBL experiments were selected for analysis (note several residues are near-perfectly overlapped). Amide proton chemical shifts were plotted against temperature and fitted by linear regression. The x axis of each plot spans 279–313 K and the y axis spans 0.5 ppm (1H). Residues with slope (ΔδNH/ΔT, the temperature coefficient) less negative than −4.5 ppb/K are indicated by an asterisk in each plot. (B) Plot of temperature coefficient vs. chemical shift deviation for amide protons in pUBL. A cutoff line identified in Andersen et al. (29), Δδ/ΔT=2.11(CSD×2.41), to include hydrogen-bonding amides is indicated by a dashed line. Residues that fall on or below the cutoff are listed.
Fig. S5.
Fig. S5.
Backbone dynamics in UBL and pUBL: H1-N15 heteronuclear NOE measurements for UBL (black squares) and pUBL (red circles) (53). The values plotted are an average of two independent experiments at 600 MHz, indicated by error bars. The average NOE for data within 1 SD of the mean is indicated by a dashed line for each species. The S65/pSer65 data point is indicated for reference.
Fig. S6.
Fig. S6.
Graphical representation of medium- and long-range (interresidue) NOEs observed from N15 and C13 NOESY experiments. pUBL residues are indicated by circles and connected by black lines. Blue lines indicate observed interresidue NOEs. Darker blue lines represent more unique NOEs observed. Sequential NOEs are excluded for simplicity. Residues V17–Q40 were also excluded in this representation for simplicity and due to a lack of structural change in this region relative to UBL.
Fig. S7.
Fig. S7.
Chemical shift perturbations of backbone amides in parkin UBL upon phosphorylation. (A) H1-N15 HSQC spectra showing backbone amide resonances in parkin UBL (UBL, black spectrum) and following phosphorylation (pUBL, red spectrum). Resonance assignments are labeled in red for pUBL. Where large chemical shift changes occur, an arrow is indicated to show the chemical shift from UBL upon phosphorylation. (B) Weighted chemical shift perturbations in pUBL relative to WT UBL. CSP is calculated as CSP=[ΔδHN2+0.2ΔδN2]0.5.
Fig. 3.
Fig. 3.
Changes to surface electrostatic potential upon phosphorylation of UBL disrupt autoinhibitory interactions with R0RBR. (A) Surface charge is indicated by color in red (negative), white (neutral), and blue (positive). R0RBR, UBL (Left), and pUBL (Right) were calculated separately, using the online programs PDB2PQR and APBS (32), and visualized in PyMOL. (B) Overall domain architecture of parkin R0RBR (PDB ID 5C1Z, residues 142–465) with pUBL aligned in the UBL binding region. Unresolved tether residues (A383–A390) were modeled using Modeler in UCSF Chimera. (C) Expanded view of B, showing proposed pUBL binding interface. Residue numberings are colored according to their respective domains. pSer65 is brought into close proximity of D274 (<5 Å), a possible source of charge repulsion. (D) Selected 600-MHz 1H-15N TROSY HSQC spectra of 2H,15N-labeled parkin R0RBR highlighting differences in UBL (purple, Left) and pUBL (red, Right) interactions with the tether domain. UBL and pUBL interactions were ∼96% and ∼92% saturated, respectively, according to affinities in ref. . Chemical shift perturbation (CSP) plots for amide resonances of tether residues (G375–T415) are shown beneath spectra and colored for the respective experiment. CSPs were calculated as CSP=[ΔδHN2+0.2ΔδN2]0.5. Full CSP plots are found in Fig. S8.
Fig. S8.
Fig. S8.
Interaction of UBL and pUBL with R0RBR parkin. Shown are selected regions of 600-MHz H1-N15 TROSY HSQC spectra of H2, N15-labeled parkin R0RBR with 1.5 molar equivalents UBL (purple spectra, A–C, Top, ∼96% saturated) or 2.5 molar equivalents pUBL (red spectra, A–C, Bottom, ∼92% saturated). Level of saturation was determined from affinities in Kumar et al. (15). (A) UBL and pUBL use similar modes to bind parkin through RING1 and IBR domains. (B and C) UBL and pUBL do not interact with sulfate-binding pockets in RING0 and RING2. (D and E) Full chemical shift perturbation plots for the R0RBR domain. Gray bars indicate resonances that broaden or shift beyond assignment in the bound form. Domain map is included below the x axis and colored as in Fig. 3B.
Fig. 4.
Fig. 4.
Hydrodynamic shape analysis of PINK1-activated parkin. (A) Sedimentation velocity experiments show little change in hydrodynamic shape upon UBL phosphorylation. A more extended conformation is observed only in the presence of pUb (higher f/f0). Example surface representations for the given hydrodynamic shapes are shown. (B) Ten representative pParkin/pUb models with a “displaced” pUBL domain. Two hundred models were generated using the ensemble optimization method (33), allowing pUBL linker to sample random conformations relative to R0RBR/pUb complex. R0RBR/pUb complex is represented as dark/light gray according to PDB ID 5CAW. Modeled pUBL-linker structures are shown according to their sedimentation coefficients as in C. (C) Distribution of sedimentation coefficients of 200 generated models of activated pParkin/pUb and autoinhibited pParkin/pUb. S20,w values were determined by HYDROPRO, using a residue-level shell model (34). Histogram x axis shows calculated S20,w values grouped by ±0.05 S.
Fig. S9.
Fig. S9.
pUb displaces pUBL in full-length, phosphorylated parkin. Shown are H1-N15 CPMG, T2-filtered HSQC spectra of (A) N15-labeled full-length parkin and (B) N15-labeled full-length pSer65 phosphorylated parkin after addition of excess, unlabeled pUb. The spectra are scaled identically and residue assignments for pUBL are indicated. The T2 (transverse relaxation) time of full-length parkin was determined to be 20 ms, owing to its large molecular mass. Conversely, the T2 of isolated UBL was determined to be 160 ms. HSQC experiments were collected with a 30-ms spin-echo period to attenuate signals from the fastest-relaxing component. The much slower decay of free UBL signal compared with parkin can therefore serve as a reporter for release of autoinhibition (54). In parkin’s autoinhibited state, only signals from flexible loops and linkers are visible (A). After activation by PINK1 phosphorylation and pUb binding, pUBL is released from R0RBR and relaxes as a smaller molecular mass entity, enabling its detection beyond the applied spin-echo period (B).

References

    1. Pickrell AM, Youle RJ. The roles of PINK1, parkin, and mitochondrial fidelity in Parkinson’s disease. Neuron. 2015;85(2):257–273. - PMC - PubMed
    1. Valente EM, et al. Hereditary early-onset Parkinson’s disease caused by mutations in PINK1. Science. 2004;304(5674):1158–1160. - PubMed
    1. Kitada T, et al. Mutations in the parkin gene cause autosomal recessive juvenile parkinsonism. Nature. 1998;392(6676):605–608. - PubMed
    1. Narendra D, Tanaka A, Suen DF, Youle RJ. Parkin is recruited selectively to impaired mitochondria and promotes their autophagy. J Cell Biol. 2008;183(5):795–803. - PMC - PubMed
    1. Matsuda N, et al. PINK1 stabilized by mitochondrial depolarization recruits Parkin to damaged mitochondria and activates latent Parkin for mitophagy. J Cell Biol. 2010;189(2):211–221. - PMC - PubMed

Publication types

MeSH terms

Grants and funding

LinkOut - more resources