. 2017 Jan 10;114(2):E161-E170.
doi: 10.1073/pnas.1525228113. Epub 2016 Dec 22.

Microbial competition in porous environments can select against rapid biofilm growth

Affiliations

Microbial competition in porous environments can select against rapid biofilm growth

Katharine Z Coyte et al. Proc Natl Acad Sci U S A. .

Abstract

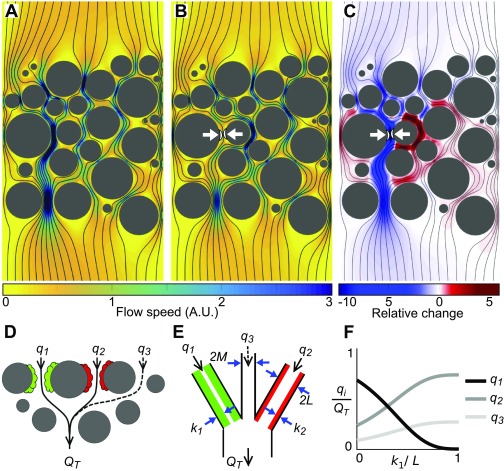
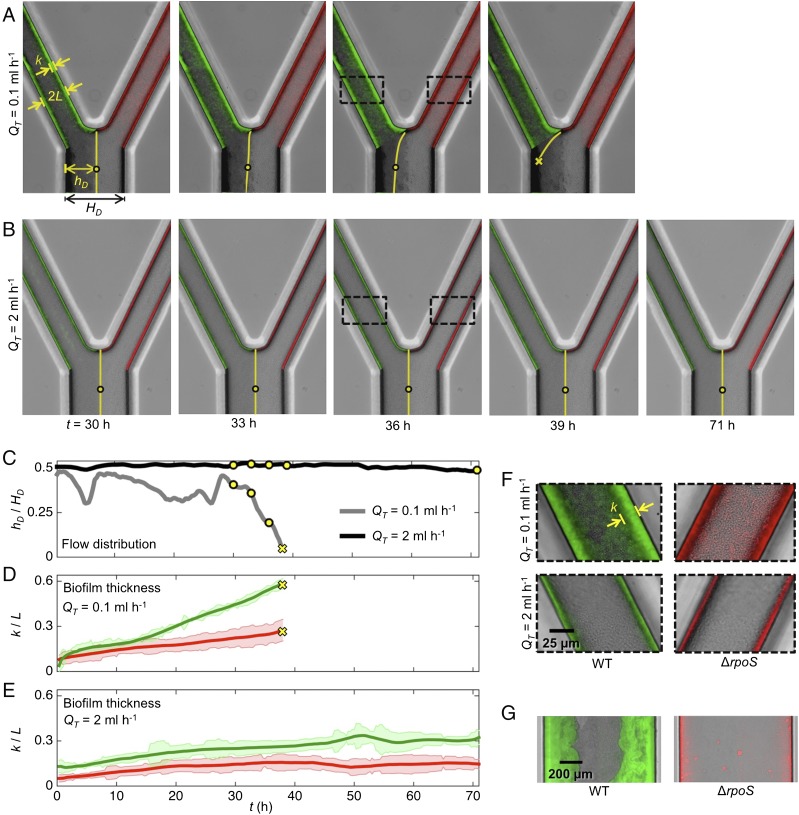
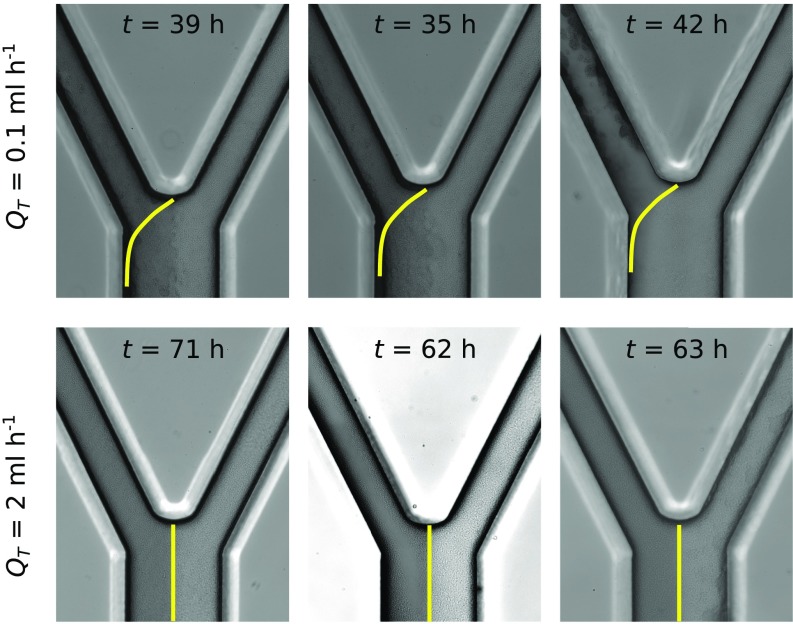
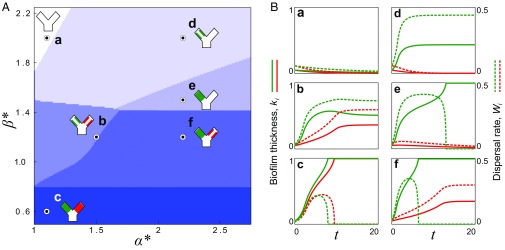
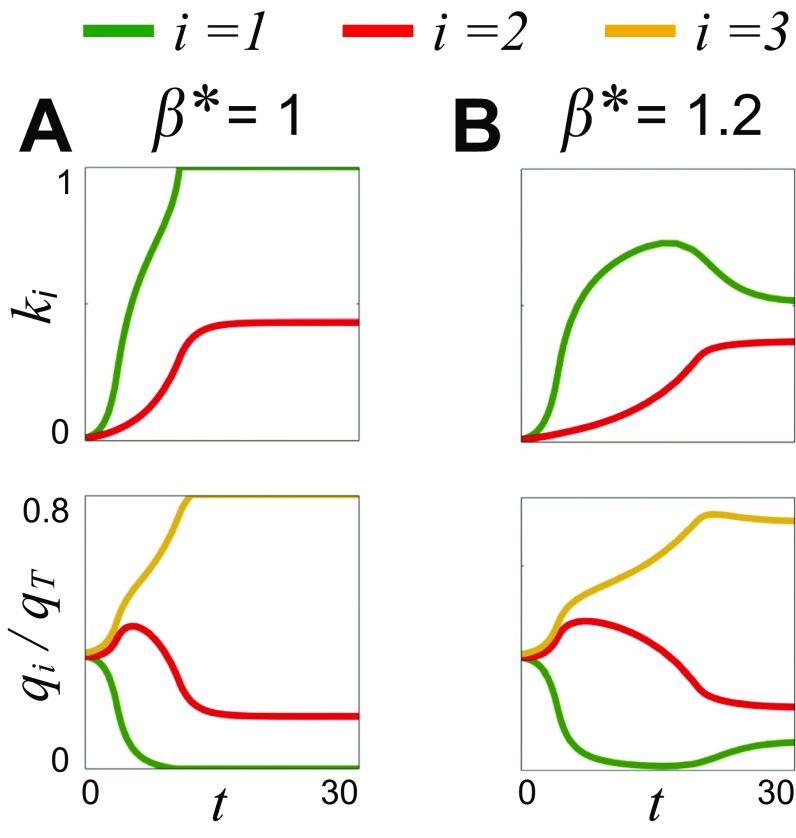
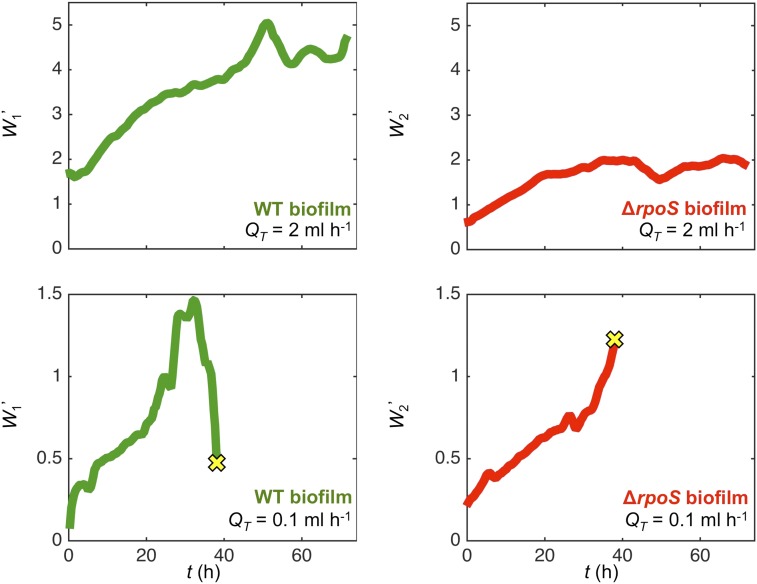
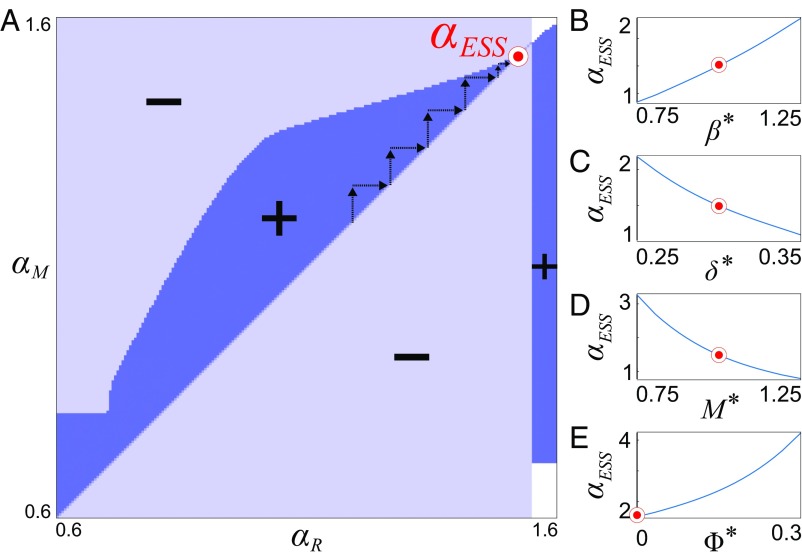
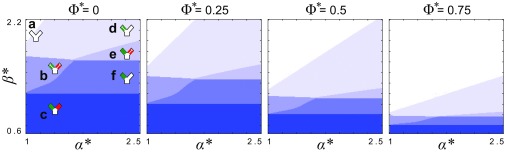
Microbes often live in dense communities called biofilms, where competition between strains and species is fundamental to both evolution and community function. Although biofilms are commonly found in soil-like porous environments, the study of microbial interactions has largely focused on biofilms growing on flat, planar surfaces. Here, we use microfluidic experiments, mechanistic models, and game theory to study how porous media hydrodynamics can mediate competition between bacterial genotypes. Our experiments reveal a fundamental challenge faced by microbial strains that live in porous environments: cells that rapidly form biofilms tend to block their access to fluid flow and redirect resources to competitors. To understand how these dynamics influence the evolution of bacterial growth rates, we couple a model of flow-biofilm interaction with a game theory analysis. This investigation revealed that hydrodynamic interactions between competing genotypes give rise to an evolutionarily stable growth rate that stands in stark contrast with that observed in typical laboratory experiments: cells within a biofilm can outcompete other genotypes by growing more slowly. Our work reveals that hydrodynamics can profoundly affect how bacteria compete and evolve in porous environments, the habitat where most bacteria live.

Keywords: adaptive dynamics; bacterial evolution; clogging; game theory; porous media flow.


Conflict of interest statement

The authors declare no conflict of interest.

Figures

Fig. 1.
Fig. 1.
A growing biofilm tends to decrease its access to flow while increasing the flow to its competitors. (A) Viscosity dominates inertia in most porous environments, owing to the relatively small pore spaces (10 μm to 1 mm) and slow fluid velocities (1–1000 μm s1) (95, 96), which allows flow to be modeled using the Stokes equations. Here, we numerically solved the Stokes equations within a representative 2D porous geometry. Flow is driven by a fixed pressure difference between the top and bottom boundaries, while the left and right boundaries are impermeable (see Materials and Methods for further details). Black lines show streamlines, and the color map shows the flow speed in arbitrary units (A.U.). (B) The flow field after the addition of a small impermeable patch of biofilm (white arrows). All other parameters of the simulation remained constant. (C) The relative change in flow speed measured as (sasb)/sa, where sa is the initial flow speed and sb is the flow speed after the addition of the biofilm patch, shows that the biofilm sharply decreases the flow through the pore in which it resides and increases the flow through neighboring pore spaces. (D) A cartoon of two biofilm patches (green and red) that interact hydrodynamically. The proportion of the total flow, QT, that moves past each biofilm changes as the biofilms grow and increase the hydrodynamic resistance of their respective pore spaces. A third flow path (dotted line) models the ability for flow to divert around the two competing biofilms. (E) Our conceptual model where two biofilms, with thicknesses k1andk2, live along neighboring flow paths of width 2L that are connected to a flow path of width 2M that does not harbor any biofilm. The proportion of the total volumetric rate flow, QT, that passes along each of the three flow paths is calculated using Kirchhoff’s laws assuming planar Poiseuille flow in each pore space (Materials and Methods). (F) Analogous to our Stokes flow simulations, if k1 increases in thickness the proportion of the total flow rate through its pore space, q1/QT, decreases, while increasing the amount of flow, q2/QT, received by the neighboring biofilm. Here, k2/L=0.3andM/L=1.
Fig. 2.
Fig. 2.
Microfluidic competition experiments show biofilms that rapidly increase in thickness tend to divert flow to biofilms that expand more slowly. (A and B) The left pore of each device was seeded with wild-type cells (green), whereas the right pore was inoculated with ΔrpoS cells (red). Dyed media flows through the left pore, whereas clear media flows through the right pore. The dye interface downstream of the two pores (yellow line) allows us to dynamically track the proportion of the total flow, QT, moving through each pore space (Materials and Methods). (C) Following the movement of the dye interface (hD/HD, yellow circles in A and B) shows that in the weak-flow treatment (A) the wild-type biofilm diverted nearly all its flow supply after 38 h, such that, subsequently, the dye interface was not detectable at the measurement location (SI Text). However, in the strong-flow treatment (B) both biofilms are able to maintain access to flow for more than 70 h. (D and E) In the weak-flow treatment the wild-type biofilm (green line) increased in thickness, k, faster than the ΔrpoS-null biofilm (red line), which was responsible for the diversion of flow. In strong flow, both biofilms were thinner, such that the difference in biofilm thickness between the two strains was smaller. Shaded regions show the standard deviation about the mean (Materials and Methods). (F) A magnified view of the biofilms shown within the dashed black rectangles in A and B. (G) The observation that wild-type biofilms expand at a faster rate than ΔrpoS biofilms was confirmed in separate microfluidic experiments that exposed attached cells to much smaller shear stresses than in the competition experiment, which minimized the effect of flow induced detachment (SI Text). The upstream arms of the microfluidic devices used in the competition experiments (AF) have a width of 2L=65 μm and depth of 2B=75 μm (Fig. S1).
Fig. S1.
Fig. S1.
Schematic of microfluidic device that simulates the hydrodynamic interactions between patches of biofilm within a porous environment. (A) A syringe pump was used to pull fluid through the bottom outlet of the device at a constant volumetric flow rate, QT, whereas the upper inlets of the device were connected to either a reservoir of media containing dye or a reservoir without dye (Materials and Methods). While the total flow through the system is fixed at QT=q1+q2, the proportion of flow passing through each of the two upper arms is determined by their relative hydrodynamic resistances, which, in turn, are a function of the thicknesses of the biofilms that colonize each arm. (B) We dynamically track how much flow passes through each arm by measuring the location of the dye interface ZD=100μm downstream of where the two channels meet. The dye interface allows us to track how wild-type and RpoS-null biofilms, which colonize the left and right hand arms of the device, respectively, affect one another’s access to flow (Fig. 2). Because QT is held constant, biofilm growth downstream of the junction does not affect the proportion of flow passing through each of the upstream arms.
Fig. S2.
Fig. S2.
Wild-type biofilms form at a faster rate than RpoS-null biofilms. We inoculated relatively wide straight microfluidic channels (2B=1 mm by 2L=75μm cross-section) with either wild-type or ΔrpoS cells (Materials and Methods) and tracked biofilm formation over 78 h. The wild-type cells always formed much thicker biofilms than the mutant. These controls show that neither the fluorescent protein (RFP, GFP) nor the Chicago Blue dye was responsible for this difference.
Fig. S3.
Fig. S3.
Three independent repeats of our competition experiment yielded the same result at steady state. In the low-flow treatment (QT=0.1 mL h−1), the wild-type biofilm, which colonized the left arm, consistently blocked its pore space. In contrast, in the high-flow-rate treatment (QT=2 mL h−1), both genotypes were able to retain access to flow. Stochastic variation in initial cell attachment likely was responsible for the variation in the timescale of blocking. The first column corresponds to the experiments shown in Fig. 2.
Fig. 3.
Fig. 3.
Diverse ecological regimes emerge from a model of biofilm competition where two strains are coupled by flow. (A) The phase space formed by α, the growth rate of a fast growing biofilm (green) divided by that of a slower-growing biofilm (red), and β, a nondimensional parameter that measures the importance of flow induced biofilm detachment relative to that of biofilm growth, reveals six different regimes at steady state. (B, af) Here, we plot the biofilm thicknesses, k1, k2 (solid lines), and the dispersal rates, W1, W2 (dashed lines), for a representative simulation in each of the regimes (circles in A). When a biofilm is fully scoured from the surface (ki=0) or completely blocks its pore space (ki=1), its dispersal goes to zero (Wi=0). In contrast, if a biofilm thickness reaches a nontrivial fixed point (0<ki<1), it disperses cells downstream at steady state. Here, M=1,δ=0.3. For clarity, we have omitted the third flow path from the cartoons in A.
Fig. S4.
Fig. S4.
The impact of flow on biofilm competition. As a biofilm grows, it increases the hydrodynamic resistance of its pore space, which tends to decrease both its access to flow (Fig. 1) and flow-induced detachment. These dynamics create a positive-feedback loop because decreased detachment further increases its hydrodynamic resistance. When flow is weak (A), this process can lead to the faster-growing genotype (green; i = 1) completely blocking its pore space, such that it can no longer disperse cells downstream. However, when flow is stronger (B), increased detachment prevents the faster-growing biofilm from blocking, but as the slower-growing biofilm (red, i = 2) increases in thickness, it diverts flow back to the faster-growing biofilm, which then reduces in thickness. Here, M=1,δ=0.3,α=1.5, and the yellow line indicates flow along a third flow path without biofilm (i = 3; Fig. 1).
Fig. S5.
Fig. S5.
Combining experimental measurements with a mechanistic model allows us to infer how the normalized biofilm dispersal rate, Wi, changes over the course of the competition experiments. Here, we use the position of the dye interface and the biofilm thickness to determine the hydrodynamic shear stress that both the wild-type and RpoS-null biofilm experience over time. This information is then used as an input in an established model to estimate the rate at which cells are shed from the biofilm (SI Text). This analysis finds that in the high-flow-rate experiment (QT=2 mL h−1), both biofilms gradually increase their dispersal rates until they begin to plateau after approximately 40 h. In contrast, in the low-flow-rate experiment (QT=0.1 mL h−1), the wild-type biofilm increases its dispersal rate until it begins to divert flow away (Fig. 2), which causes its dispersal rate to fall sharply. By the time that the dye interface can no longer be distinguished (t = 38 h, yellow crosses), the wild-type biofilm’s dispersal rate is only one-third of its peak value. In contrast, the rpoS-null biofilm increases its dispersal rate over the course of the experiment. Here, we plot the normalized dispersal rate of the wild-type biofilm, W1, and the normalized dispersal rate of the rpoS-null biofilm, W2. See SI Text, Inferring the Rates of Biofilm Dispersal in Competition Experiments Using Empirical Measurements for details.
Fig. 4.
Fig. 4.
A game-theoretical analysis of the coupled biofilm model predicts an evolutionary stable growth rate. (A) We used adaptive dynamics to construct a pairwise invasion plot, which maps the region of parameter space where a mutant that grows at rate αM can invade a resident population of biofilms that grows at rate αR. The mutant can invade in the dark blue regions (+) and cannot invade in the light blue regions (). In the white regions, the mutant and the resident biofilms both have a fitness of zero (Wi=0) because they have either been fully detached by flow or have blocked their pore space. Arrows show an example evolutionary trajectory where mutant genotypes successively replace the resident population, driving the growth rate toward the evolutionary stable growth rate, αESS (red circle). Here, we set δ=0.3αR1/2 and β=1.1αR1, M=1, and Φ=0. (BE) To determine the effect of β, δ, M, and Φ on αESS, we held three of these parameters constant and varied the fourth (red circles show fixed values).
Fig. S6.
Fig. S6.
A model in which a biofilm’s rate of detachment is coupled to its rate of growth generates the same qualitative result as a model that omits this dependency. Whereas Φ=0 corresponds to a model where detachment and growth can vary independently, increasing Φ means that a biofilm’s detachment rate increases more quicklywith its growth rate (Results and SI Text). Inclusion of this coupling increases the parameter space where one or both genotypes are washed away; however, all of the competitive regimes, and their positions relative to one another, are conserved. This finding is consistent with theoretical predictions (SI Text).

Comment in

Similar articles

Cited by

References

    1. Azam F, Malfatti F. Microbial structuring of marine ecosystems. Nat Rev Microbiol. 2007;5(10):782–791. - PubMed
    1. Schluter J, Foster KR. The evolution of mutualism in gut microbiota via host epithelial selection. PLoS Biol. 2012;10(11):e1001424. - PMC - PubMed
    1. Bever JD, Richardson SC, Lawrence BM, Holmes J, Watson M. Preferential allocation to beneficial symbiont with spatial structure maintains mycorrhizal mutualism. Ecol Lett. 2009;12(1):13–21. - PubMed
    1. Horner-Devine MC, Carney KM, Bohannan BJM. An ecological perspective on bacterial biodiversity. Proc Biol Sci. 2004;271(1535):113–122. - PMC - PubMed
    1. Franzosa EA, et al. Sequencing and beyond: Integrating molecular ‘omics’ for microbial community profiling. Nat Rev Microbiol. 2015;13(6):360–372. - PMC - PubMed

Publication types