. 2017 Jan 20;355(6322):289-294.
doi: 10.1126/science.aah3717. Epub 2016 Dec 22.

Evolutionary drivers of thermoadaptation in enzyme catalysis

Affiliations

Evolutionary drivers of thermoadaptation in enzyme catalysis

Vy Nguyen et al. Science. .

Abstract

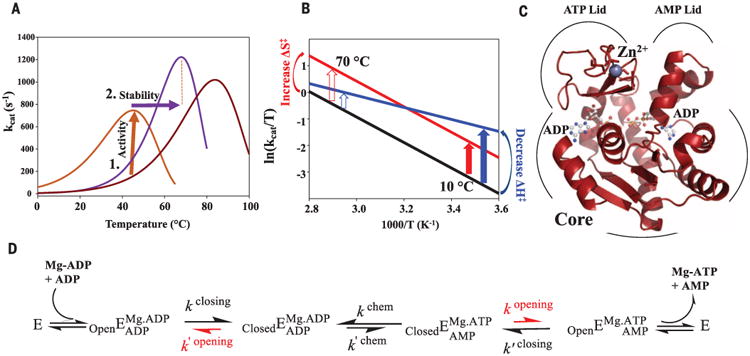
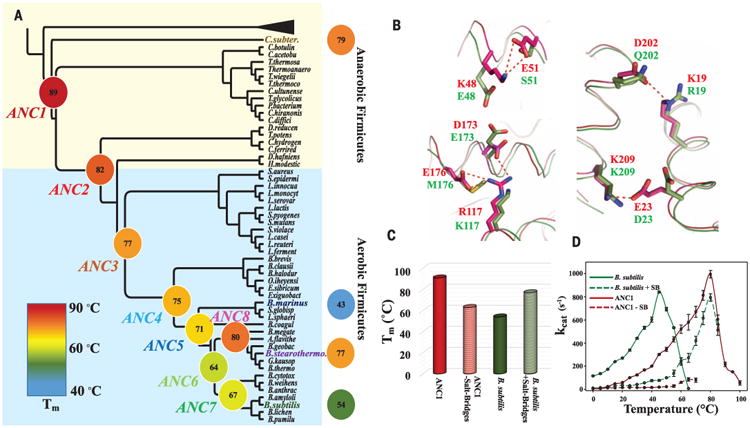
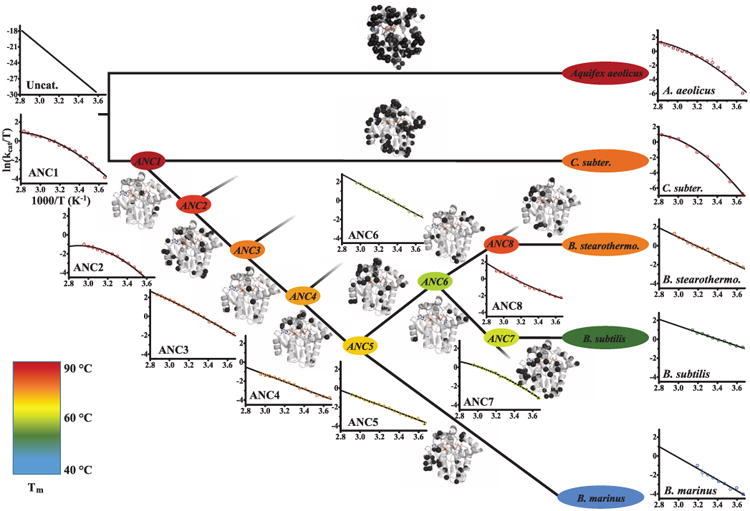
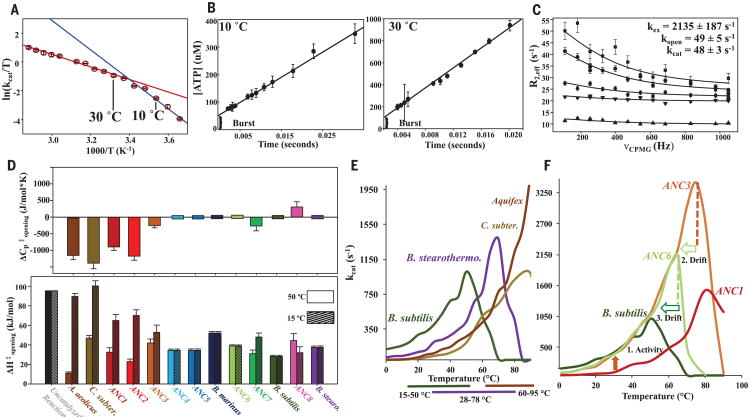
With early life likely to have existed in a hot environment, enzymes had to cope with an inherent drop in catalytic speed caused by lowered temperature. Here we characterize the molecular mechanisms underlying thermoadaptation of enzyme catalysis in adenylate kinase using ancestral sequence reconstruction spanning 3 billion years of evolution. We show that evolution solved the enzyme's key kinetic obstacle-how to maintain catalytic speed on a cooler Earth-by exploiting transition-state heat capacity. Tracing the evolution of enzyme activity and stability from the hot-start toward modern hyperthermophilic, mesophilic, and psychrophilic organisms illustrates active pressure versus passive drift in evolution on a molecular level, refutes the debated activity/stability trade-off, and suggests that the catalytic speed of adenylate kinase is an evolutionary driver for organismal fitness.


Figures

Fig. 1
Fig. 1. Evolutionary pressures on enzymes during adaptation to environmental temperature changes
(A) Hypothetical ancestral protein (dark red) needs to increase activity at lower temperatures (brown arrow), resulting in a second ancestral enzyme (brown). Evolution from cold to hot imposes pressure on increased stability (purple arrow), resulting in a modern thermophile (purple). (B) Eyring plot illustrating proposed mechanisms for increasing enzymatic activity at colder temperatures by increasing ΔS (red) versus decreasing ΔH (blue) relative to the uncatalyzed reaction (black) (12, 13, 34) with larger rate acceleration at low temperatures by ΔH (blue arrow). (C) The 1.2 Å x-ray structure of ANC1 Adk with two ADPs bound. (D) Reaction scheme for Adk catalysis, highlighting lid opening as the rate-limiting step (red) [from (22)].
Fig. 2
Fig. 2. Evolution of thermostability through the reconstructed Adk phylogeny spanning 2.5 to 3 bya
(A) Collapsed cladogram of the tree (see fig. S1) used to resurrect ancestral Adks (nomenclature and colors for the 12 Adks are used throughout the manuscript). Measured Tms are indicated and illustrated by a continuous color scale. (B) Superposition of ANC1 (red, 5G3Y) and B. subtilis Adk (green, 1P3J) structures suggests salt bridges (dotted red lines) in ANC1 responsible for high Tm. (C) Removing these salt bridges from ANC1 or adding them into B. subtilis results in a drastic decrease or increase in Tm, respectively. (D) Corresponding activity changes of these mutant proteins. Errors are standard errors from the linear fit based on eight time points for each temperature.
Fig. 3
Fig. 3. Evolution of enzyme activity over about 2.5 to 3 bya
Temperature dependence of kcat is shown as Eyring plots including the fits to Eq. 1, and is compared to the uncatalyzed reaction reported (34). Tms are shown using color code of Fig. 2. For fitting, only data for temperatures before unfolding set in are used, with a nonzero ΔCp term when validated by an F test (see fig. S6 for complete activity–temperature profiles). Along the evolutionary trajectory from ANC1 via mesophilic ANC6 to modern Adks, positive curvature evolved to straight Eyring plots. In contrast, C. subterraneus and A. aeolicus Adks retain positive curvature. Sites of mutations between the nodes are plotted as black spheres on the structure of ANC1. Error bars as in Fig. 2D.
Fig. 4
Fig. 4. Change in ΔCp as evolutionary driver for thermoadaptation of catalysis and implications for organismal fitness
(A) Eyring plot of ANC1 activity with theoretical explanation of curvature caused by a change in rate-limiting step between 10° and 30°C between two steps with different temperature dependencies (red and blue lines). (B) Quench-flow experiment of 100 μM ANC1 and 5 mM Mg/ADP shows a burst for fast phosphoryl transfer, followed by the rate-limiting lid opening (linear part) (mean ± SEM; N = 3 experiments). (C) 15N CPMG relaxation (22) data of representative residues of ANC1 during catalysis at saturating concentrations of Mg/ADP at 15°C. Error bars denote uncertainty in the ratio of cross-peaks, estimated as root mean square deviation from duplicates. (D) Heat capacity of activation for lid-opening dynamics ( ΔCpopening) for all Adk enzymes determined from the data of Fig. 3 fitted to Eq. 1 (top) and corresponding ΔH values at 50° and 15°C (bottom) (standard errors in the fitted parameters). (E) Correlation between activity–temperature profiles of modern Adks with their known growth temperatures (–38) (bottom bars). (F) Activity–temperature profiles along the evolutionary path from ANC1 to modern B. subtilis labeling active pressure for increased activity at lower temperatures (orange arrow from ANC1 to ANC3), creating a hyperactive and hyperstable enzyme in ANC3 and subsequently a slower passive drift to decreased stabilities via ANC6 to B. subtilis (light green and green open arrow).

References

    1. Clarke A, et al. PLOS ONE. 2013;8:e66207. - PMC - PubMed
    1. Cowan DA. Trends Microbiol. 2004;12:58–60. - PubMed
    1. Deming JW. Curr Opin Microbiol. 2002;5:301–309. - PubMed
    1. Blöchl E, et al. Extremophiles. 1997;1:14–21. - PubMed
    1. Ciccarelli FD, et al. Science. 2006;311:1283–1287. - PubMed

Publication types

Substances