. 2017 Feb 20;474(5):647-665.
doi: 10.1042/BCJ20160704.

Interacting post-muscarinic receptor signaling pathways potentiate matrix metalloproteinase-1 expression and invasion of human colon cancer cells

Affiliations

Interacting post-muscarinic receptor signaling pathways potentiate matrix metalloproteinase-1 expression and invasion of human colon cancer cells

Anan H Said et al. Biochem J. .

Abstract

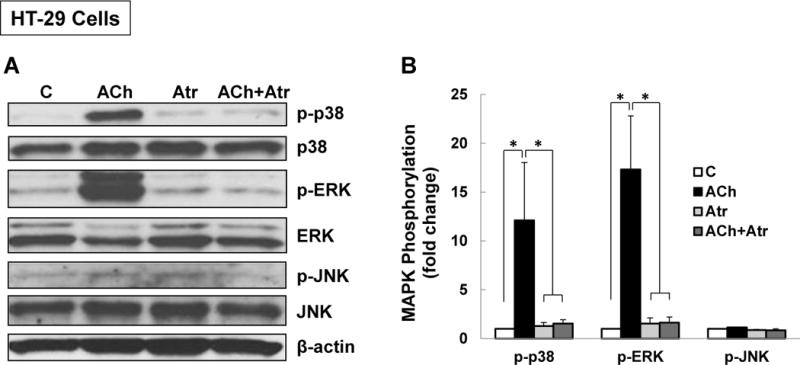
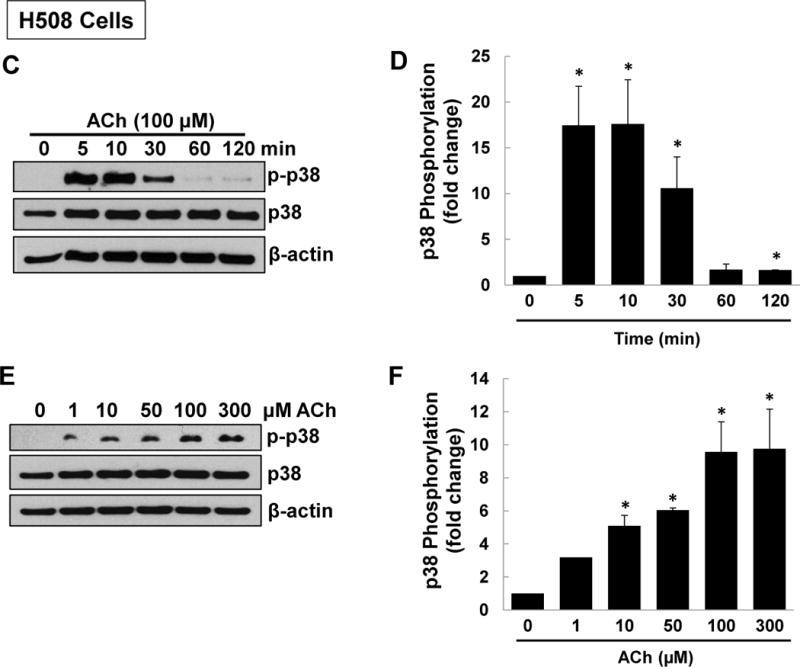
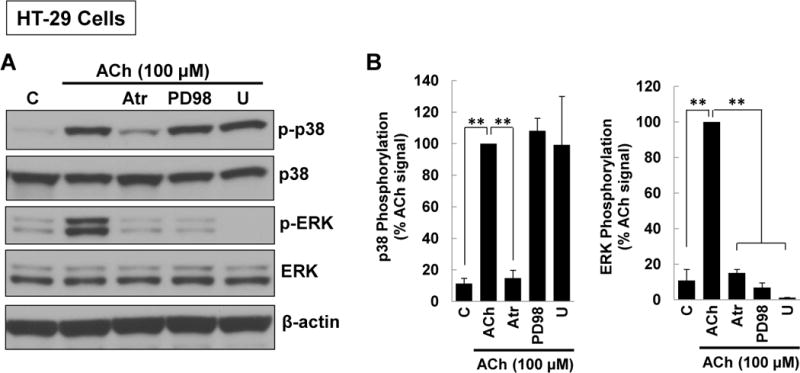
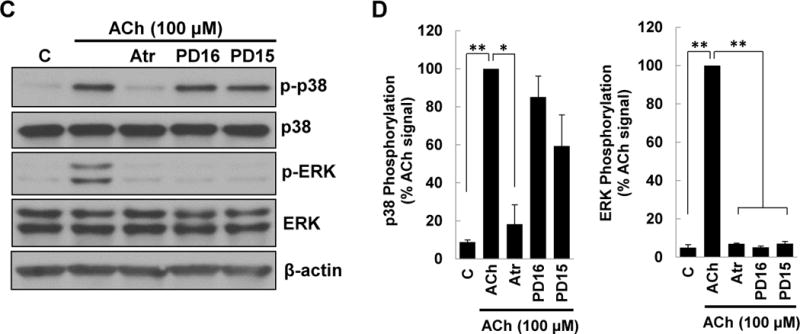
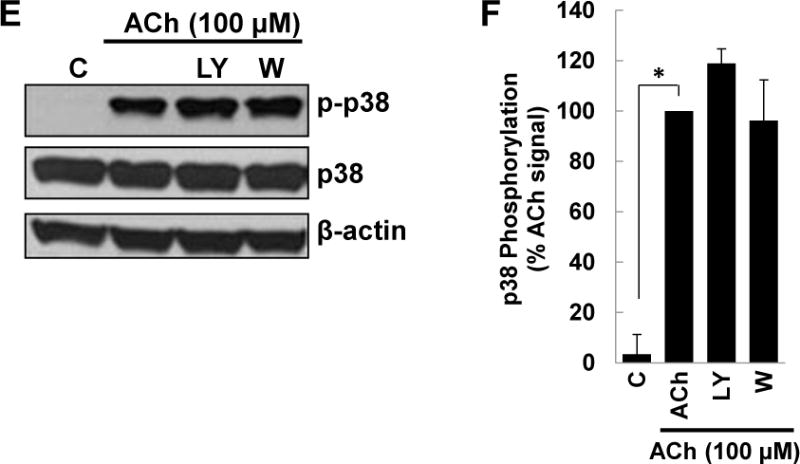
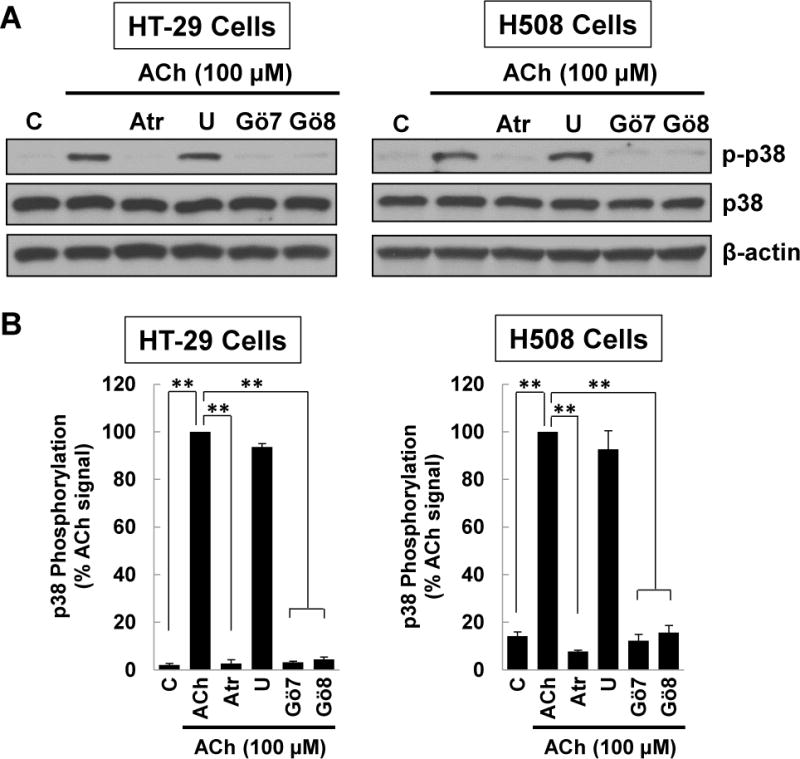
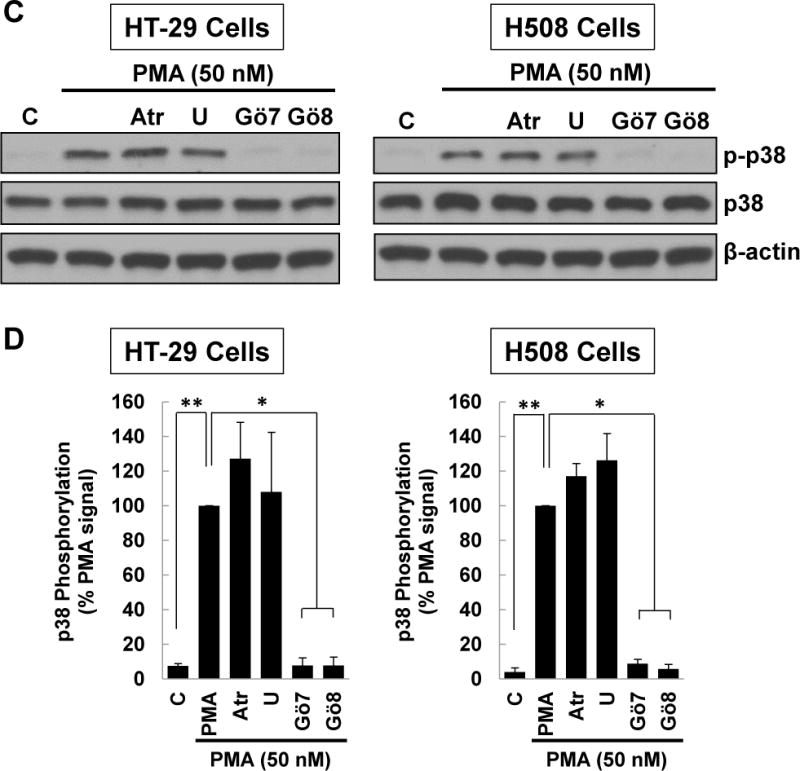
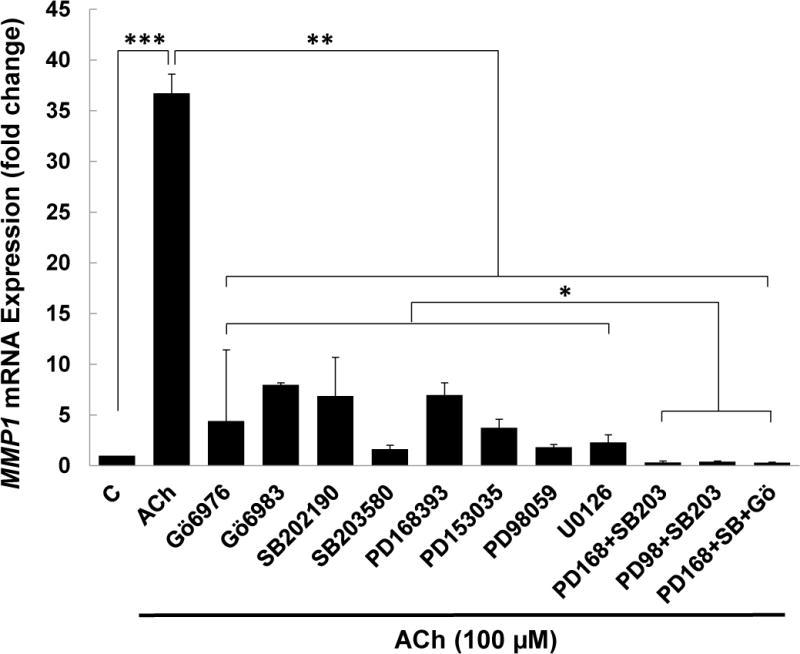
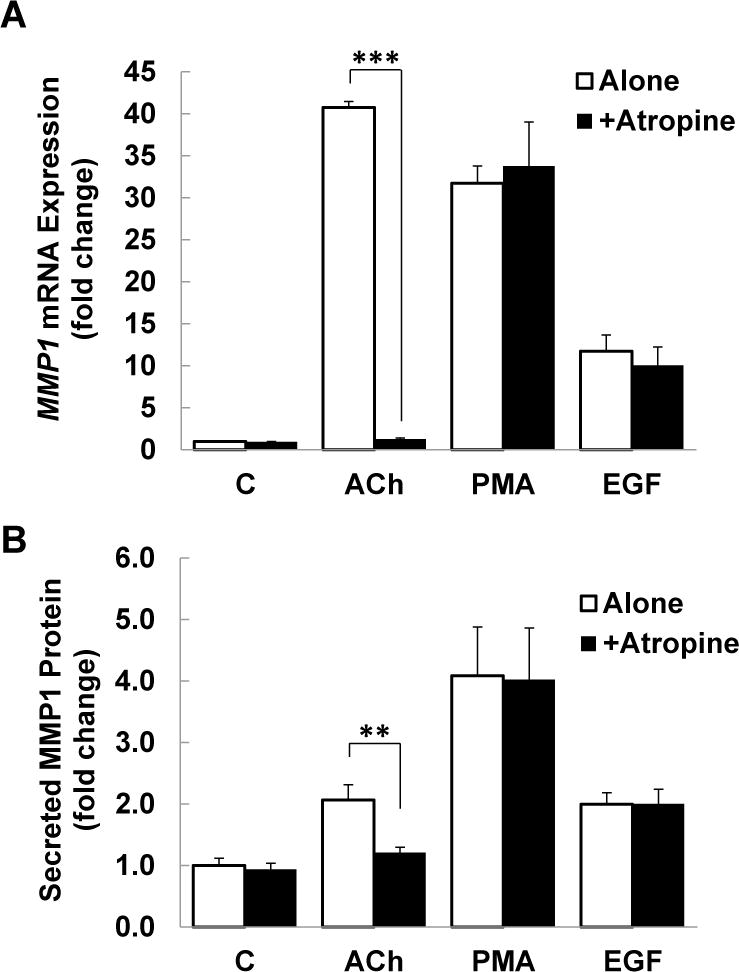
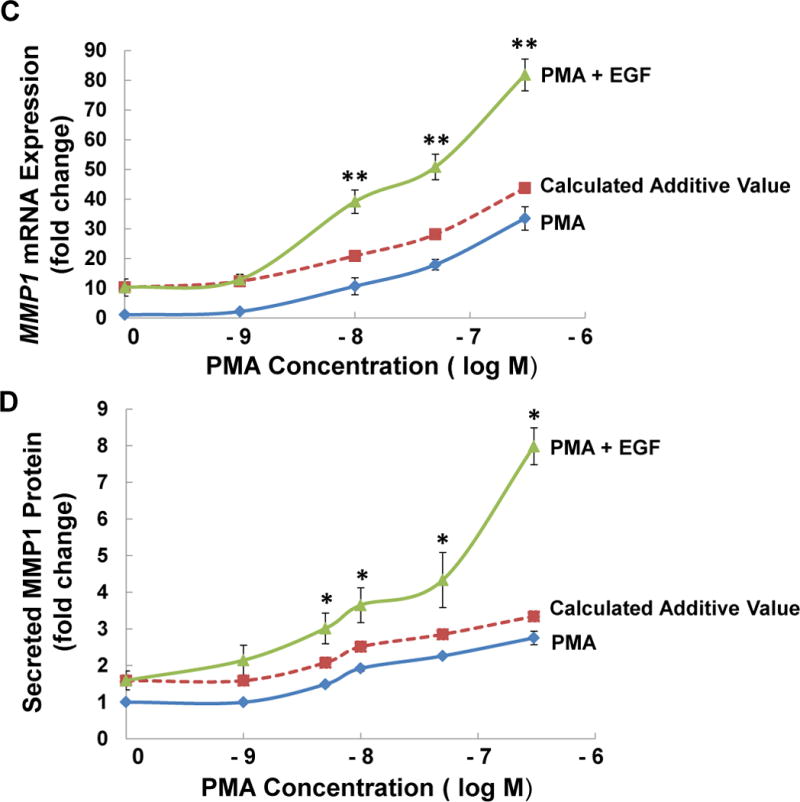
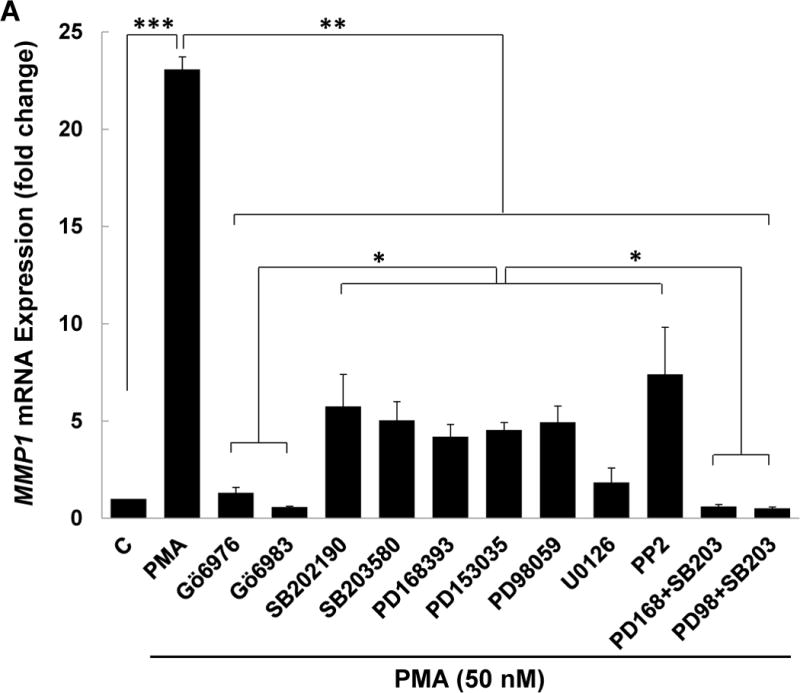
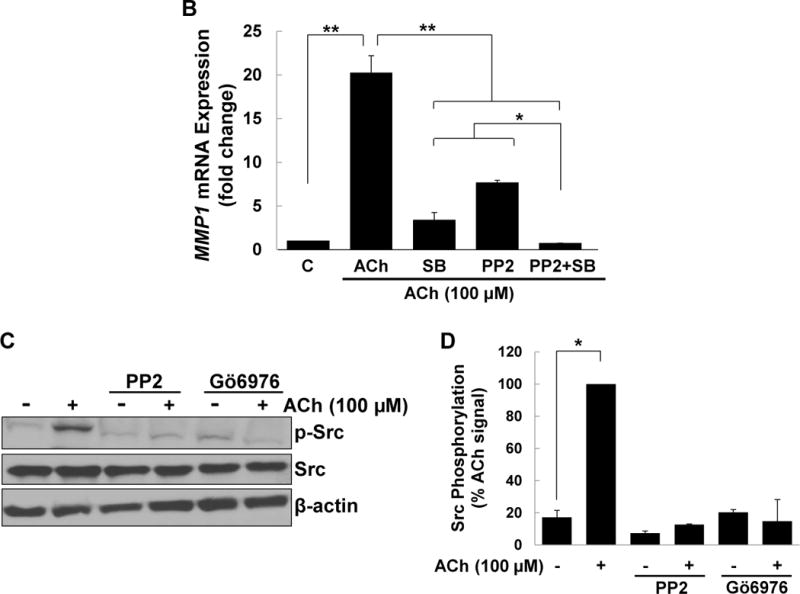
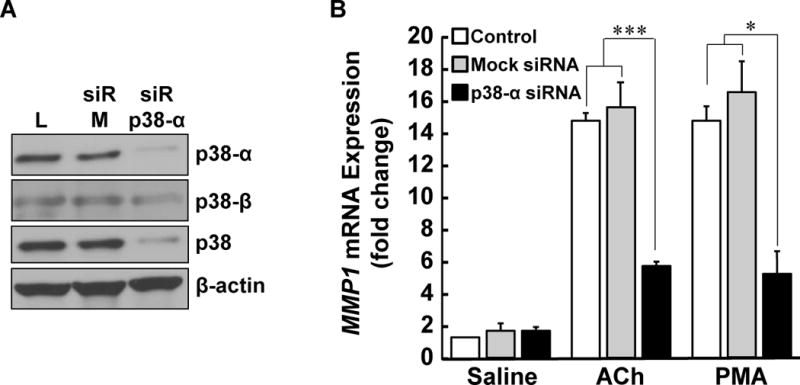
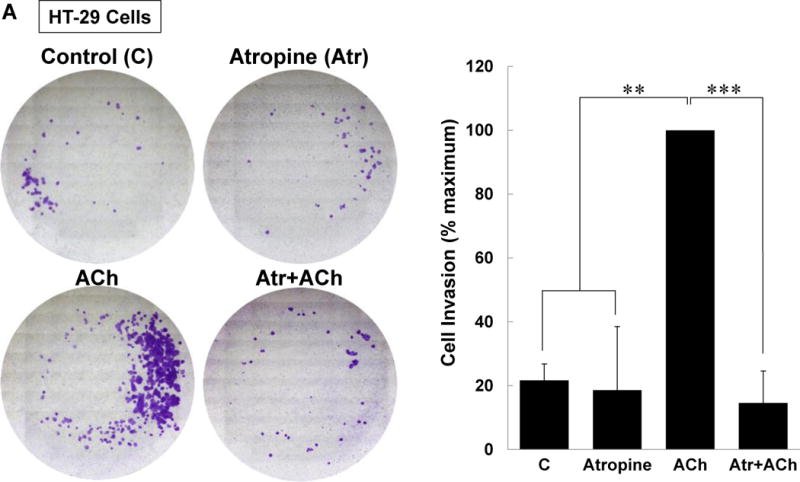
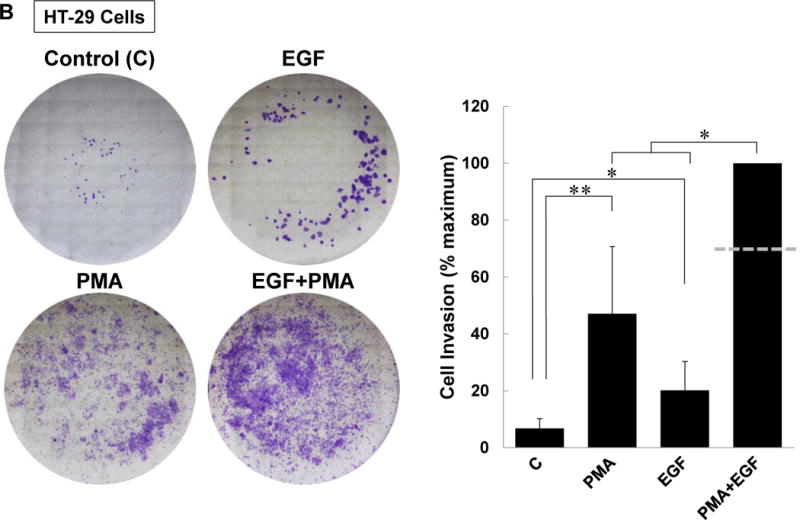
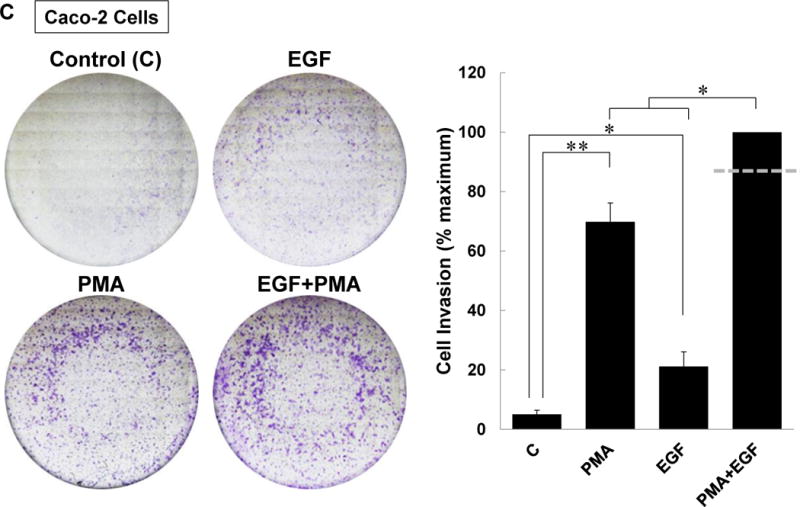
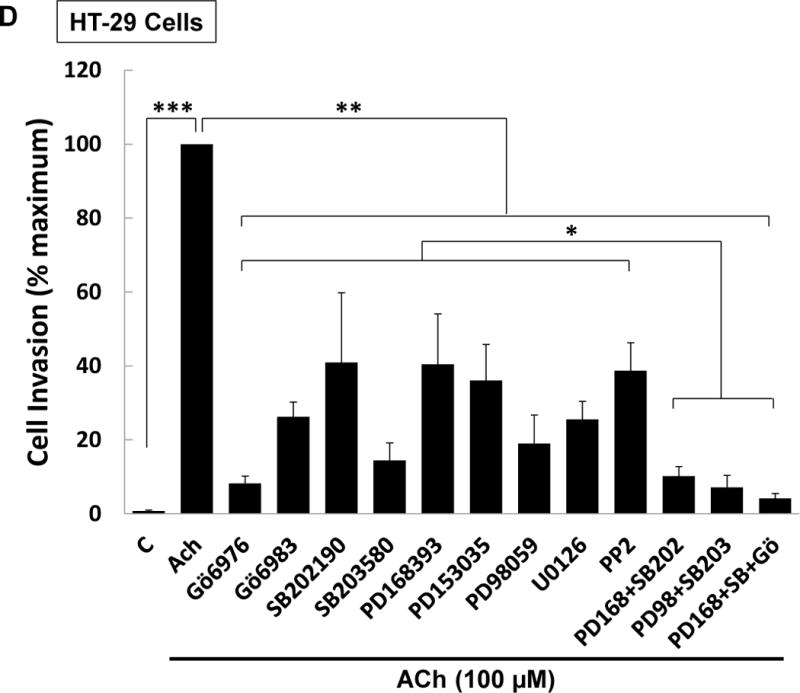
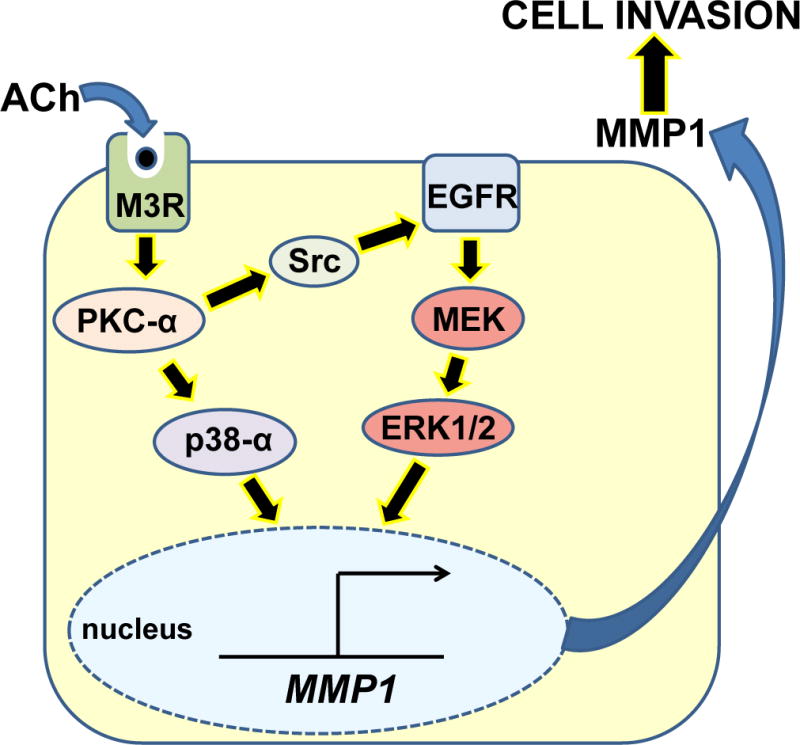
M3 muscarinic receptor (M3R) expression is increased in colon cancer; M3R activation stimulates colon cancer cell invasion via cross-talk with epidermal growth factor receptors (EGFR), post-EGFR activation of mitogen-activated protein kinase (MAPK) extracellular signal-related kinase 1/2 (ERK1/2), and induction of matrix metalloproteinase-1 (MMP1) expression. MMP1 expression is strongly associated with tumor metastasis and adverse outcomes. Here, we asked whether other MAPKs regulate M3R agonist-induced MMP1 expression. In addition to activating ERK1/2, we found that treating colon cancer cells with acetylcholine (ACh) stimulated robust time- and dose-dependent phosphorylation of p38 MAPK. Unlike ERK1/2 activation, ACh-induced p38 phosphorylation was EGFR-independent and blocked by inhibiting protein kinase C-α (PKC-α). Inhibiting activation of PKC-α, EGFR, ERK1/2, or p38-α/β alone attenuated, but did not abolish ACh-induced MMP1 expression, a finding that predicted potentiating interactions between these pathways. Indeed, ACh-induced MMP1 expression was abolished by incubating cells with either an EGFR or MEK/ERK1/2 inhibitor combined with a p38-α/β inhibitor. Activating PKC-α and EGFR directly with the combination of phorbol 12-myristate 13-acetate (PMA) and EGF potentiated MMP1 gene and protein expression, and cell invasion. PMA- and ACh-induced MMP1 expression were strongly diminished by inhibiting Src and abolished by concurrently inhibiting both p38-α/β and Src, indicating that Src mediates the cross-talk between PKC-α and EGFR signaling. Using siRNA knockdown, we identified p38-α as the relevant p38 isoform. Collectively, these studies uncover novel functional interactions between post-muscarinic receptor signaling pathways that augment MMP1 expression and drive colon cancer cell invasion; targeting these potentiating interactions has therapeutic potential.

Keywords: cell invasion; cell signaling; colorectal cancer; matrix metalloproteinases; muscarinic receptors; p38 MAPK.


Figures

Figure 1
Figure 1. M3R activation stimulates p38 MAPK and ERK1/2 phosphorylation
(A) Acetylcholine (ACh) stimulates p38 and ERK1/2 phosphorylation. HT-29 colon cancer cells were incubated for 5 min with 200 μM ACh and cell extracts were immunoblotted with antibodies against phosphorylated and total p38, ERK1/2, and JNK. (B) Densitometry of immunoblots from four separate experiments show that ACh stimulated robust phosphorylation of p38 and ERK1/2, but did not alter levels of total or phosphorylated JNK, total ERK1/2 or total p38. The actions of ACh were blocked by pre-incubating cells with 5 μM atropine (Atr) for 45 min. C, untreated control; *P < 0.05. (C) ACh stimulates time-dependent p38 phosphorylation. H508 colon cancer cells were incubated with 100 μM ACh for the indicated times. Cell extracts were immunoblotted with antibodies against phosphorylated and total p38. (D) Densitometry of immunoblots from three separate experiments show that ACh stimulated maximal p38 phosphorylation within 5 to 10 min which was nearly back to basal levels within 1 h. *P < 0.05 compared to Time 0. (E) ACh stimulates dose-dependent p38 phosphorylation. H508 colon cancer cells were incubated with the indicated concentrations of ACh for 10 min. Cell extracts were immunoblotted with antibodies against phosphorylated and total p38. (F) Densitometry of immunoblots from three separate experiments show ACh-induced p38 phosphorylation was detectable with 1 μM ACh and maximal with 100 to 300 μM ACh. *P < 0.05 compared to vehicle alone (no ACh). In all immunoblots, β-actin was used as a loading control.
Figure 2
Figure 2. ACh-induced p38 phosphorylation is not altered by inhibiting MEK/ERK1/2, EGFR, or PI3K/AKT activation
(A) HT-29 cells were pre-incubated for 45 min with M3R or MEK/ERK1/2 inhibitors before adding ACh (100 μM) for an additional 5-min incubation. Cell extracts were immunoblotted with antibodies against phosphorylated and total p38 and ERK1/2. (B) Densitometry of immunoblots from three separate experiments shows ACh-induced p38 phosphorylation was blocked by pre-incubating cells with 5 μM atropine (Atr) but not by MEK (ERK1/2) inhibitors [10 μM PD98059 (PD98), 10 μM U0126 (U)]. As positive controls, atropine and MEK (ERK1/2) inhibitors consistently blocked ACh-induced ERK1/2 phosphorylation. **P < 0.01 compared to 100 μM ACh alone. (C) HT-29 cells were pre-incubated for 45 min with inhibitors of M3R or EGFR inhibitors [5 μM PD168393 (PD16), 5 μM PD153035 (PD15)] before adding ACh (100 μM) for an additional 5-min incubation. Cell extracts were immunoblotted with antibodies against phosphorylated and total p38 and ERK1/2. (D) Densitometry of immunoblots from three separate experiments shows ACh-induced p38 phosphorylation was blocked by pre-incubating cells with atropine but not by EGFR inhibitors. As positive controls, atropine and EGFR inhibitors consistently blocked ACh-induced ERK1/2 phosphorylation. *P < 0.05, **P < 0.01 compared to 100 μM ACh alone. (E) HT-29 cells were pre-incubated for 45 min with PI3K/AKT signaling inhibitors [10 μM LY 294002 (LY), 5 nM Wortmannin (W)] before adding 100 μM ACh for an additional 5-min incubation. Cell extracts were immunoblotted with antibodies against phosphorylated and total p38. (F) Densitometry of immunoblots from three separate experiments shows ACh-induced p38 phosphorylation was not blocked by pre-incubating cells with PI3K/AKT inhibitors. *P < 0.05 compared to 100 μM ACh alone.
Figure 3
Figure 3. ACh-induced p38 phosphorylation is mediated by activation of PKC
(A) HT-29 and H508 cells were pre-incubated for 45 min with atropine, a MEK inhibitor [10 μM U0126 (U)] or PKC-α/β1 inhibitors [5 μM Gӧ6976 (Gӧ7), 5 μM Gӧ6983 (Gӧ8)] before adding 100 μM ACh for an additional 5-min incubation. Cell extracts were immunoblotted with antibodies against phosphorylated and total p38. (B) Densitometry of immunoblots from three separate experiments shows pre-incubating HT-29 and H508 cells with atropine or PKC-α/β1 inhibitors consistently attenuated ACh-induced p38 phosphorylation, but pre-incubation with atropine or the MEK inhibitor had no effect. **P < 0.01 compared to 100 μM ACh alone. (C) HT-29 and H508 cells were pre-incubated for 45 min with atropine, a MEK inhibitor [10 μM U0126 (U)], or PKC-α/β1 inhibitors [5 μM Gӧ6976 (Gӧ7), 5 μM Gӧ6983 (Gӧ8)] before adding 50 mM PMA for an additional 5-min incubation. Cell extracts were immunoblotted with antibodies against phosphorylated and total p38. (D) Densitometry of immunoblots from three separate experiments shows pre-incubating HT-29 and H508 cells with PKC-α/β1 inhibitors consistently attenuated PMA (50 nM)-induced p38 phosphorylation, but pre-incubation with atropine or the MEK inhibitor had no effect. *P < 0.05, **P < 0.01 compared to 50 nM PMA alone. β-actin was a loading control. C, untreated control.
Figure 4
Figure 4. Potentiating interactions between post-M3R signaling pathways govern ACh-induced MMP1 gene induction
HT-29 cells were pre-incubated for 45 min with PKC-α/β1, p38-α/β, EGFR, or MEK inhibitors, and then incubated for an additional 4 h with no additional test agents (C) or with ACh (100 μM). MMP1 mRNA levels were measured by qPCR. ACh-induced MMP1 expression was attenuated by inhibitors of PKC-α/β1 (5 μM Gӧ6976, 5 μM Gӧ6983), p38-α/β (10 μM SB202190, 10 μM SB203580), EGFR (5 μM PD168393, 5 μM PD153035), and MEK (10 μM PD98059, 10 μM U0126). Pre-incubating cells with a combination of p38-α/β plus EGFR inhibitors or p38-α/β plus MEK inhibitors abolished ACh-induced MMP1 gene expression, as did pre-incubation with a combination of p38-α/β, EGFR and PKC-α/β1 inhibitors. qPCR data were normalized to GAPDH and are means of four separate experiments. C, untreated control; *P < 0.05; **P < 0.01; ***P < 0.001.
Figure 5
Figure 5. Simultaneous activation of PKC and EGFR signaling potentiates MMP1 gene expression
(A) HT-29 cells were pre-incubated with 5 μM atropine (Atr) for 45 min and then incubated for an additional 4 h with no test agents (C), or with ACh (100 μM), a PKC activator (50 nM PMA), or an EGFR activator (10 ng/ml EGF). MMP1 mRNA levels were measured by qPCR. Treating HT-29 cells with PMA or EGF increased levels of MMP1 mRNA. Whereas the effects of ACh were blocked by pre-incubating cells with atropine, PMA- and EGF-induced changes in MMP1 expression were unaffected. C, untreated control; ***P < 0.001. (B) Similar findings were observed when HT-29 cells were treated under the same conditions and MMP1 protein expression was measured using ELISA. C, untreated control; **P < 0.01. (C) HT-29 cells were treated with increasing concentrations of PMA, as indicated, for 4 h and MMP1 gene expression was measured by qPCR. Increasing concentrations of PMA progressively increased MMP1 gene expression. Adding 10 ng/ml of EGF to each concentration of PMA significantly potentiated MMP1 gene expression. The dashed line represents the calculated additive values for 10 ng/ml of EGF plus the indicated concentration of PMA. (D) Similar findings were observed when HT-29 cells were treated under the same conditions and secreted MMP1 protein was measured using ELISA. qPCR data were normalized to GAPDH. Data represent mean ± SE of at least three separate experiments. *P < 0.05, **P < 0.01 compared to calculated additive value.
Figure 6
Figure 6. Potentiating interactions between post-PKC signaling pathways govern MMP1 gene induction
(A) HT-29 cells were pre-incubated for 45 min alone or with PKC-α/β1 inhibitors (5 μM Gӧ6976, 5 μM Gӧ6983), p38-α/β inhibitors (10 μM SB202190, 10 μM SB203580), EGFR inhibitors (5 μM PD168393, and PD153035), MEK inhibitors (10 μM PD98059, 10 μM U0126), or a Src inhibitor (10 μM PP2), alone or in combination, before adding 50 nM PMA for an additional 4-h incubation. MMP1 mRNA levels were measured by qPCR. PMA-induced MMP1 gene expression was abolished by pre-incubating cells with PKC-α/β1 inhibitors and attenuated by pre-incubating cells with inhibitors of p38-α/β, EGFR, MEK, and Src. Simultaneously blocking p38-α/β and EGFR, p38-α/β and MEK, or p38-α/β and Src abolished PMA-induced MMP1 gene expression. (B) HT-29 cells were pre-incubated for 45 min alone or with a p38-α/β (10 μM SB203580) or Src (10 μM PP2) inhibitor, alone or in combination, followed by an additional 4-h incubation with 100 μM ACh. MMP1 mRNA levels were measured by qPCR. ACh-induced MMP1 expression was attenuated by pre-incubation with p38-α/β and Src inhibitors and abolished by these inhibitors in combination. qPCR data were normalized to GAPDH and are the mean ± SE of three separate experiments. C, untreated control; *P < 0.05, **P < 0.01. (C) H508 cells were pre-incubated for 45 min with inhibitors of Src (10 μM PP2) and PKC-α/β1 (5 μM Gö6976) before adding ACh (100 μM) for an additional 5-min incubation. Cell extracts were immunoblotted with antibodies against phosphorylated and total Src. (D) Densitometry of immunoblots from two separate experiments shows ACh-induced Src phosphorylation was blocked by pre-incubating cells with Src and PKC-α/β1 inhibitors. *P < 0.05 compared to 100 μM ACh alone.
Figure 7
Figure 7. Effects of p38-α knockdown on ACh- and PMA-induced MMP1 expression
(A) HT-29 cells were transfected with Lipofectamine (L), 50 pmoles non-targeting mock siRNA (siR-M), or 50 pmoles siRNA targeting p38-α (siR-p38-α). p38-α, p38-β, total p38, and β-actin expression were measured by immunoblotting with specific antibodies. (B) HT-29 cells transfected with Lipofectamine (control), non-targeting mock siRNA, and siRNA targeting p38-α were incubated with saline, 100 μM ACh, or 50 nM PMA for 4 h at 37°C. MMP1 mRNA levels were measured by qPCR. qPCR data were normalized to GAPDH and are means of four separate experiments. *P < 0.05; ***P < 0.001.
Figure 8
Figure 8. Interactions between PKC and EGFR signaling potentiate colon cancer cell invasion
(A) ACh-induced colon cancer cell invasion is blocked by atropine. HT-29 cells were pre-incubated with 5 μM atropine (Atr) for 45 min and then incubated for an additional 48 h with no test agents, or with 100 μM ACh. Atropine alone had no effect but blocked ACh-induced cell invasion. (B) Directly activating PKC plus EGFR potentiated colon cancer cell invasion. HT-29 cells were incubated with PMA (50 nM) and EGF (10 ng/ml), alone or in combination, for 48 h. Simultaneous activation of PKC and EGFR significantly potentiates cell invasion; the dashed line represents the calculated additive value for PMA plus EGF (P < 0.05 for the observed vs. the calculated addition of PMA plus EGF). (C) Caco-2 cells were incubated with PMA (50 nM) and EGF (10 ng/ml), alone or in combination, for 48 h. Simultaneous activation of PKC and EGFR signaling potentiated cell invasion; the dashed line represents the calculated additive value for PMA plus EGF (P < 0.05 for the observed vs. the calculated addition of PMA plus EGF). (D) ACh-induced colon cancer cell invasion is blocked by inhibitors of PKC-α/β1 (5 μM Gӧ6976, 5 μM Gӧ6983), p38-α/β (10 μM SB202190, 10 μM SB203580), EGFR (5 μM PD168393, 5 μM PD153035), MEK (10 μM PD98059, 10 μM U0126), and Src (10 μM PP2). Pre-incubating cells with a combination of p38-α/β plus EGFR inhibitors or p38-α/β plus MEK inhibitors nearly abolished ACh-induced cell invasion, as did pre-incubation with a combination of EGFR, p38-α/β, and PKC-α/β1 inhibitors. In this set of experiments, cell invasion was measured using BD Biocoat Invasion Chambers with Matrigel inserts. Representative images of crystal violet-stained HT-29 cells that invaded through Matrigel inserts are shown for Fig. 8A–C. Data shown in bar graphs represent mean ± SE of at least three separate experiments. C, untreated control; *P < 0.05; **P < 0.01; ***P < 0.001.
Figure 9
Figure 9. Potentiating interactions between post-M3R signaling pathways govern MMP1 gene transcription and colon cancer cell invasion
The interaction of a muscarinic receptor agonist (acetylcholine; ACh) with M3 muscarinic receptors triggers downstream PKC-α activation which, in turn, activates Src and p38-α. Src interaction with EGFR stimulates signaling through the MEK/ERK1/2 pathway. Activated p38-α and ERK1/2 coordinately induce MMP1 gene transcription and enhance MMP1 protein expression. Besides degrading interstitial collagen and facilitating cell invasion, the resulting augmented release of MMP1 into the colon cancer cell microenvironment may catalyze release of EGFR ligands and further enhance ERFR activation. These interactions between post-M3R signaling pathways potentiate MMP1 expression and release, and culminate in augmented cancer cell invasion, thereby providing potential rescue mechanisms in the event that only one post-M3R signal transduction pathway is blocked.

Similar articles

Cited by

References

    1. Peery AF, Crockett SD, Barritt AS, Dellon ES, Eluri S, Gangarosa LM, Jensen ET, Lund JL, Pasricha S, Runge T, Schmidt M, Shaheen NJ, Sandler RS. Burden of Gastrointestinal, Liver, and Pancreatic Diseases in the United States. Gastroenterology. 2015;149:1731–1741 e1733. - PMC - PubMed
    1. Kohler BA, Sherman RL, Howlader N, Jemal A, Ryerson AB, Henry KA, Boscoe FP, Cronin KA, Lake A, Noone AM, Henley SJ, Eheman CR, Anderson RN, Penberthy L. Annual Report to the Nation on the Status of Cancer, 1975–2011, Featuring Incidence of Breast Cancer Subtypes by Race/Ethnicity, Poverty, and State. J Natl Cancer Inst. 2015;107 djv048. - PMC - PubMed
    1. Hayat MJ, Howlader N, Reichman ME, Edwards BK. Cancer statistics, trends, and multiple primary cancer analyses from the Surveillance, Epidemiology, and End Results (SEER) Program. Oncologist. 2007;12:20–37. - PubMed
    1. Markowitz SD, Bertagnolli MM. Molecular origins of cancer: Molecular basis of colorectal cancer. N Engl J Med. 2009;361:2449–2460. - PMC - PubMed
    1. Hanahan D, Weinberg RA. Hallmarks of cancer: the next generation. Cell. 2011;144:646–674. - PubMed

MeSH terms