

Trends in overall survival and costs of multiple myeloma, 2000-2014
- PMID: 28008176
- PMCID: PMC5596206
- DOI: 10.1038/leu.2016.380
Trends in overall survival and costs of multiple myeloma, 2000-2014
Abstract
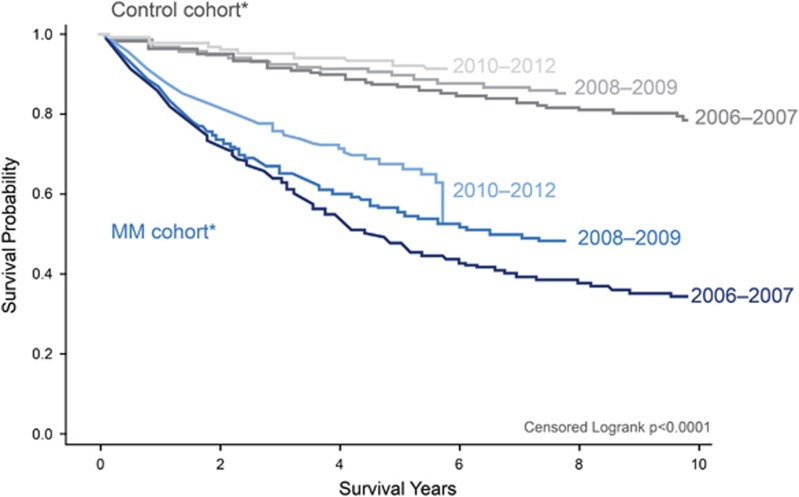
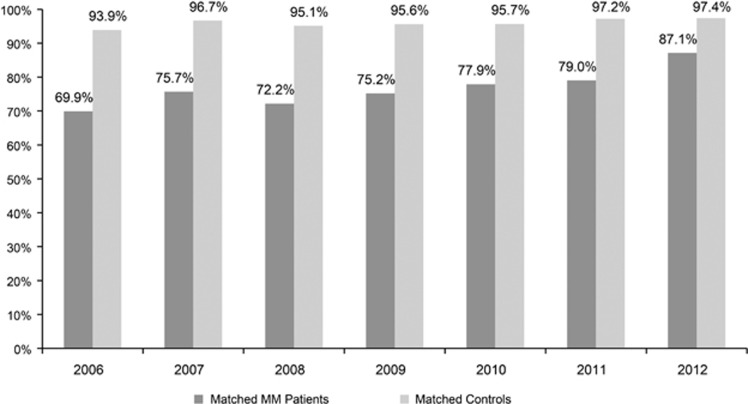
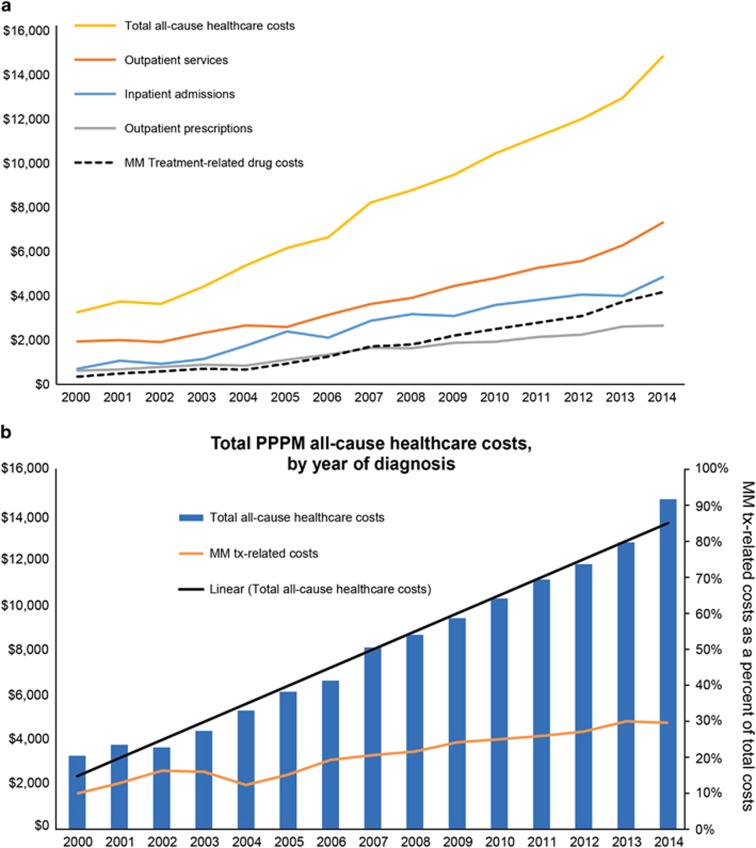
Little real-world evidence is available to describe the recent trends in treatment costs and outcomes for patients with multiple myeloma (MM). Using the Truven Health MarketScan Research Databases linked with social security administration death records, this study found that the percentage of MM patients using novel therapy continuously increased from 8.7% in 2000 to 61.3% in 2014. Compared with MM patients diagnosed in earlier years, those diagnosed after 2010 had higher rates of novel therapy use and better survival outcomes; patients diagnosed in 2012 were 1.25 times more likely to survive 2 years than those diagnosed in 2006. MM patients showed improved survival over the study period, with the 2-year survival gap between MM patients and matched controls decreasing at a rate of 3% per year. Total costs among MM patients have increased in all healthcare services over the years; however, the relative contribution of drug costs has remained fairly stable since 2009 despite new novel therapies coming to market. Findings from this study corroborate clinical data, suggesting a paradigm shift in MM treatment over the past decade that is associated with substantial survival gains. Future studies should focus on the impact on specific novel agents on patients' outcomes.
Conflict of interest statement
All authors were equally involved in the research, analysis and writing of the paper. Safiya Abouzaid and Kejal Parikh are employees of Celgene Corporation. Machaon Bonafede and Qian Cai are employees of Truven Health Analytics, an IBM company, who received funding from Celgene Corporation to conduct this study. Rafael Fonseca, Leon Cosler and Paul Richardson have served as consultants to Celgene Corporation.
Figures
References
-
- Seigel RL, Miller KD, Jemal A. Cancer Statistics. 2016CA Cancer J Clin 2016; 66: 7–30. - PubMed
-
- Howlader N, Noone AM, Krapcho M, Miller D, Bishop K, Altekruse SF et al SEER Cancer Statistics Review, 1975-2013, National Cancer Institute. Bethesda, MD. 2016http://seer.cancer.gov/statfacts/html/mulmy.html Accessed 13 June 2016.
-
- Multiple Myeloma Complications, 2012.http://www.themmrf.org/multiple-myeloma/multiple-myeloma-complications. Accessed June 2016.
-
- Mateos MV, San Miguel JF. How should we treat newly diagnosed multiple myeloma patients? Hematology Am Soc Hematol Educ Program 2013; 2013: 488–495. - PubMed
Publication types
MeSH terms
Grants and funding
LinkOut - more resources
Full Text Sources
Other Literature Sources
Medical
Miscellaneous
