. 2016 Dec 8:9:138.
doi: 10.3389/fnmol.2016.00138. eCollection 2016.

Specific Metabolomics Adaptations Define a Differential Regional Vulnerability in the Adult Human Cerebral Cortex

Affiliations

Specific Metabolomics Adaptations Define a Differential Regional Vulnerability in the Adult Human Cerebral Cortex

Rosanna Cabré et al. Front Mol Neurosci. .

Abstract

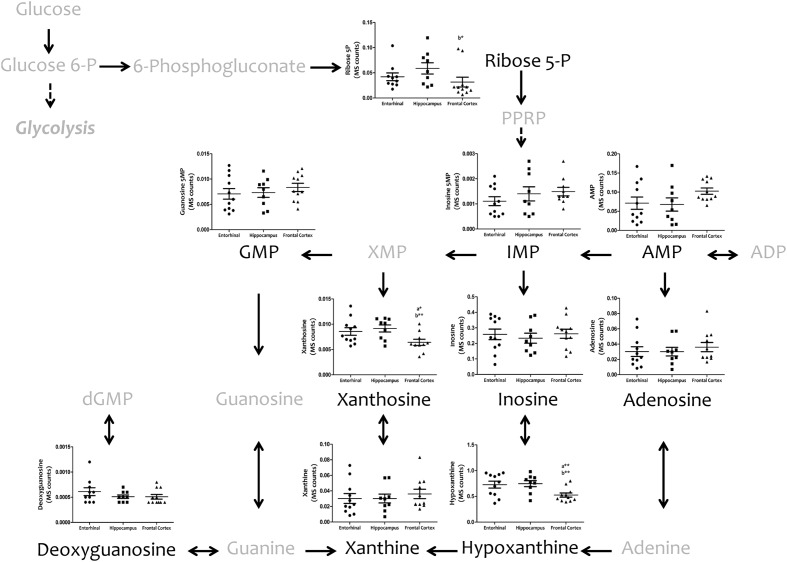
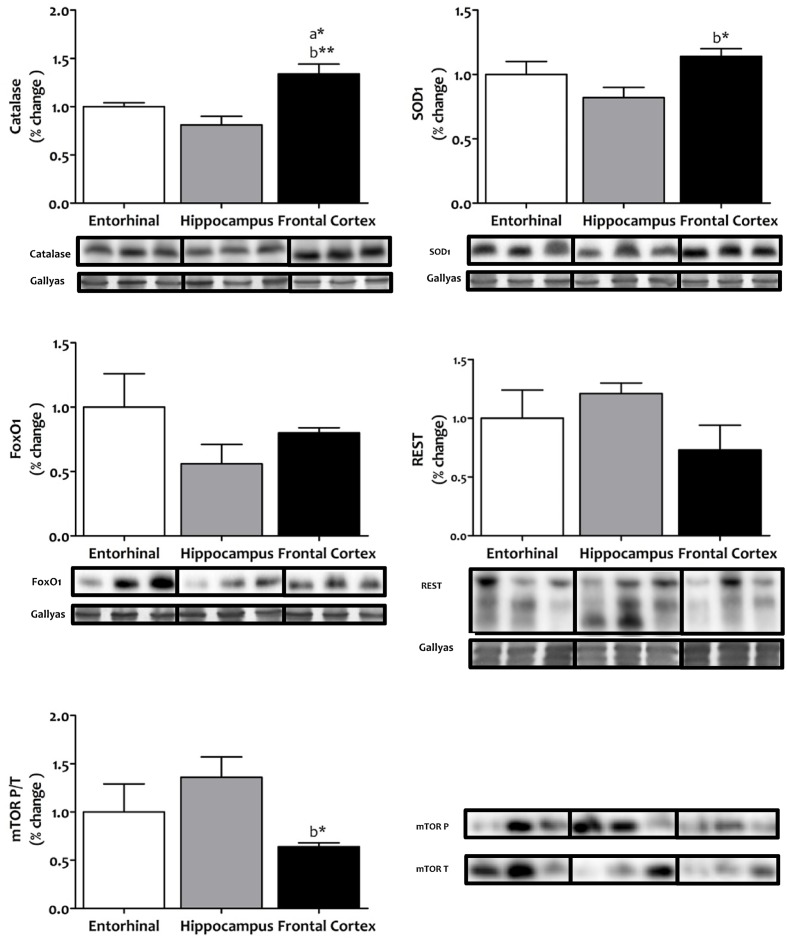
Brain neurons offer diverse responses to stresses and detrimental factors during development and aging, and as a result of both neurodegenerative and neuropsychiatric disorders. This multiplicity of responses can be ascribed to the great diversity among neuronal populations. Here we have determined the metabolomic profile of three healthy adult human brain regions-entorhinal cortex, hippocampus, and frontal cortex-using mass spectrometry-based technologies. Our results show the existence of a lessened energy demand, mitochondrial stress, and lower one-carbon metabolism (particularly restricted to the methionine cycle) specifically in frontal cortex. These findings, along with the better antioxidant capacity and lower mTOR signaling also seen in frontal cortex, suggest that this brain region is especially resistant to stress compared to the entorhinal cortex and hippocampus, which are more vulnerable regions. Globally, our results show the presence of specific metabolomics adaptations in three mature, healthy human brain regions, confirming the existence of cross-regional differences in cell vulnerability in the human cerebral cortex.

Keywords: energy metabolism; mammalian target of rapamycin (mTOR); metabolomics; methionine cycle; mitochondrial stress; nucleotide metabolism; one-carbon metabolism; selective neuronal vulnerability.


Figures

FIGURE 1
FIGURE 1
Content of neurons and glial cells in different regions of the adult human cerebral cortex. N-acetyl-Asp-Glu was used as a marker for neuronal content, and myoinositol and GFAP as markers for glial cell content. N-acetyl-Asp-Glu and myoinositol were determined with TQMS, while GFAP was measured with western blot. p < 0.05; ∗∗p < 0.01; ∗∗∗p < 0.001. a, significant differences with respect to entorhinal cortex; b, significant differences with respect to hippocampus.
FIGURE 2
FIGURE 2
Concentrations of metabolites involved in bioenergetics metabolism in different regions of the adult human cerebral cortex. Metabolites were detected and quantified with TQMS. The steady-state level of 2-SC was measured with GC-MS. p < 0.05; ∗∗p < 0.01; ∗∗∗p < 0.001. a, significant differences with respect to entorhinal cortex; b, significant differences with respect to hippocampus.
FIGURE 3
FIGURE 3
Tissue concentrations of metabolites from the serine, glycine and threonine metabolism in different regions of the adult human cerebral cortex. All metabolites were measured with TQMS. p < 0.05; ∗∗p < 0.01; ∗∗∗p < 0.001. a, significant differences with respect to entorhinal cortex; b, significant differences with respect to hippocampus.
FIGURE 4
FIGURE 4
Tissue concentrations of metabolites belonging to the methionine metabolism, including the methionine cycle and the trans-sulfuration pathway, in different regions of the adult human cerebral cortex. All metabolites were measured with TQMS. p < 0.05; ∗∗p < 0.01; ∗∗∗p < 0.001. a, significant differences with respect to entorhinal cortex; b, significant differences with respect to hippocampus.
FIGURE 5
FIGURE 5
Tissue concentrations of metabolites from the purine metabolism in different regions of the adult human cerebral cortex. All metabolites were measured with TQMS. p < 0.05; ∗∗p < 0.01; ∗∗∗p < 0.001. a, significant differences with respect to entorhinal cortex; b, significant differences with respect to hippocampus.
FIGURE 6
FIGURE 6
Tissue protein expression of factors associated with stress resistance and cell survival in different regions of the adult human cerebral cortex. The antioxidants catalase and SOD1, the FOXO transcriptional factor FOXO1, the repressor element 1-silencing transcription factor REST, and the master regulator that senses cell nutrient and energy status, mechanistic target of rapamycin mTOR, where all determined with western blot. p < 0.05; ∗∗p < 0.01; ∗∗∗p < 0.001. a, significant differences with respect to entorhinal cortex; b, significant differences with respect to hippocampus. All western blots can be found as Supplementary Figure S1.

References

    1. Bockaert J., Marin P. (2015). mTOR in brain physiology and pathologies. Physiol. Rev. 95 1157–1187. 10.1152/physrev.00038.2014 - DOI - PubMed
    1. Cáceres M., Lachuer J., Zapala M. A., Redmond J. C., Kudo L., Geschwind D. H., et al. (2003). Elevated gene expression levels distinguish human from non-human primate brains. Proc. Natl. Acad. Sci. U.S.A. 100 13030–13035. 10.1073/pnas.2135499100 - DOI - PMC - PubMed
    1. Chen G. G., Turecki G., Mamer O. A. (2009). A quantitative GC-MS method for three major polyamines in postmortem brain cortex. J. Mass Spectrom. 44 1203–1210. 10.1002/jms.1597 - DOI - PubMed
    1. Domínguez M., de Oliveira E., Odena M. A., Portero M., Pamplona R., Ferrer I. (2016). Redox proteomic profiling of neuroketal-adducted proteins in human brain: regional vulnerability at middle age increases in the elderly. Free Radic. Biol. Med. 95 1–15. 10.1016/j.freeradbiomed.2016.02.034 - DOI - PubMed
    1. Ferrer I. (2015). Selection of controls in the study of human neurodegenerative diseases in old age. J. Neural Transm. 122 941–947. 10.1007/s00702-014-1287-y - DOI - PubMed