. 2016 Dec 8:9:140.
doi: 10.3389/fnmol.2016.00140. eCollection 2016.

The Protective Role of microRNA-200c in Alzheimer's Disease Pathologies Is Induced by Beta Amyloid-Triggered Endoplasmic Reticulum Stress

Affiliations

The Protective Role of microRNA-200c in Alzheimer's Disease Pathologies Is Induced by Beta Amyloid-Triggered Endoplasmic Reticulum Stress

Qi Wu et al. Front Mol Neurosci. .

Abstract

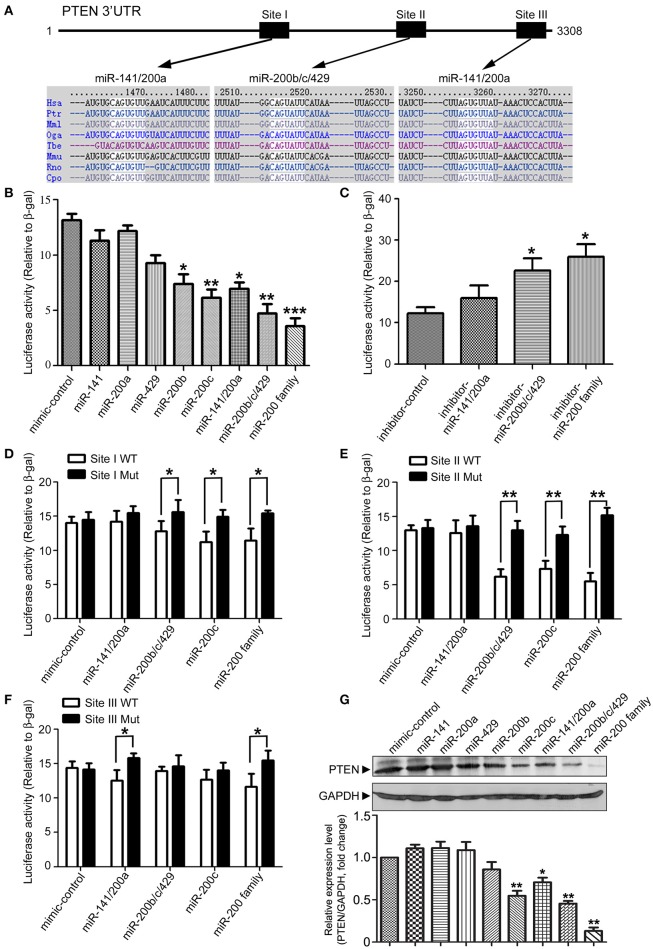
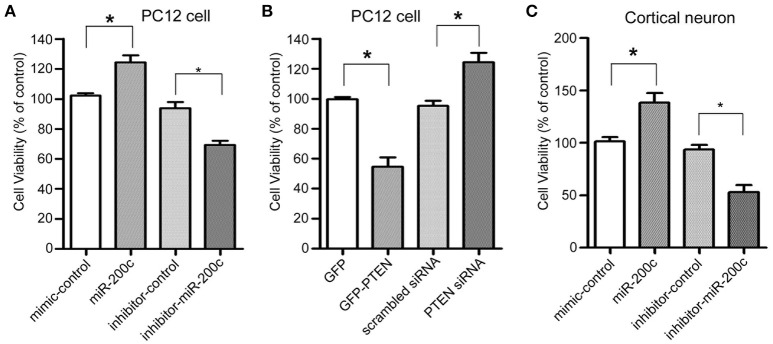
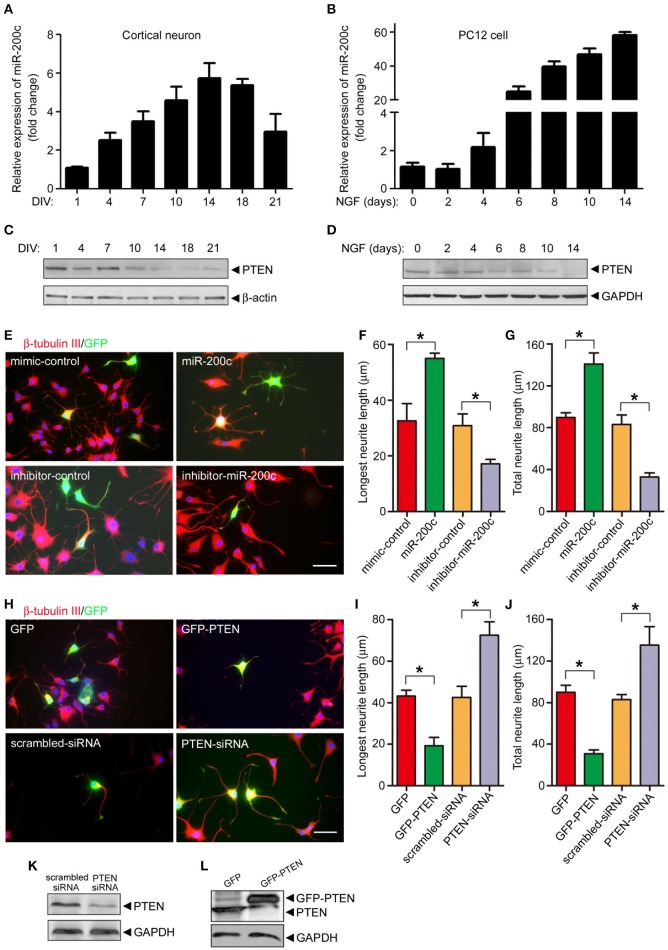
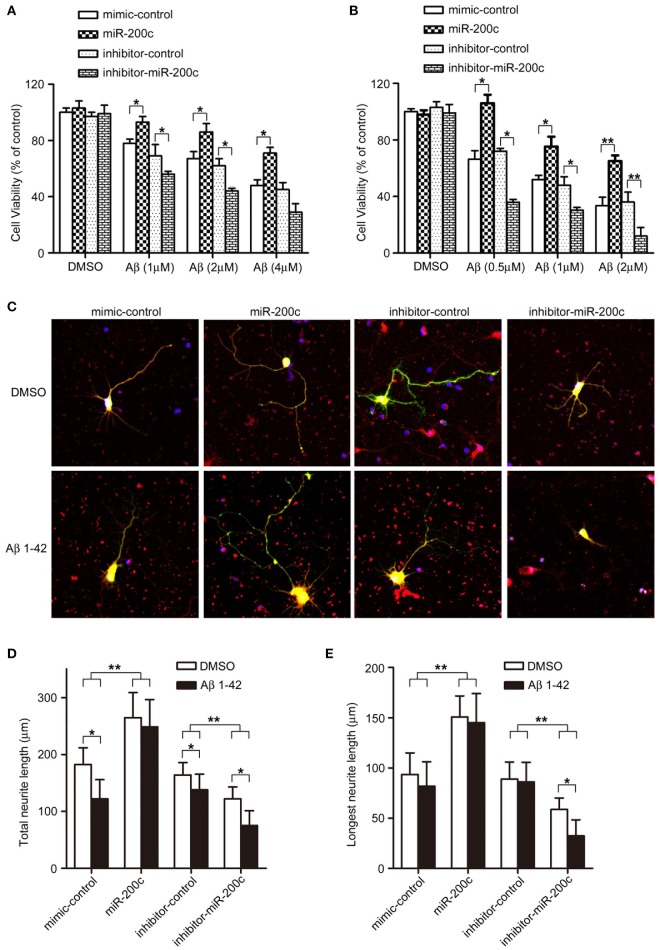
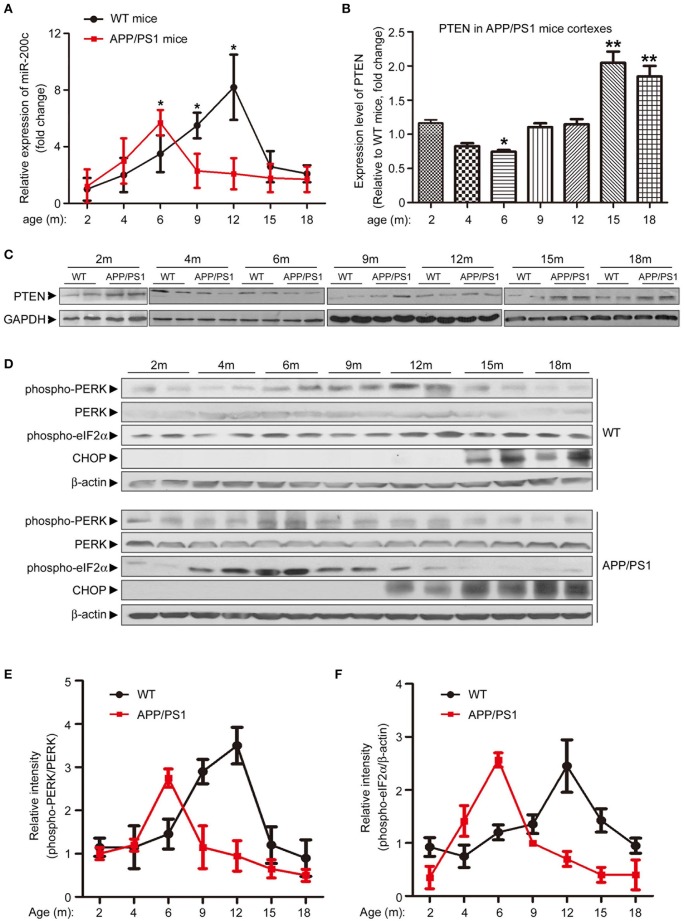
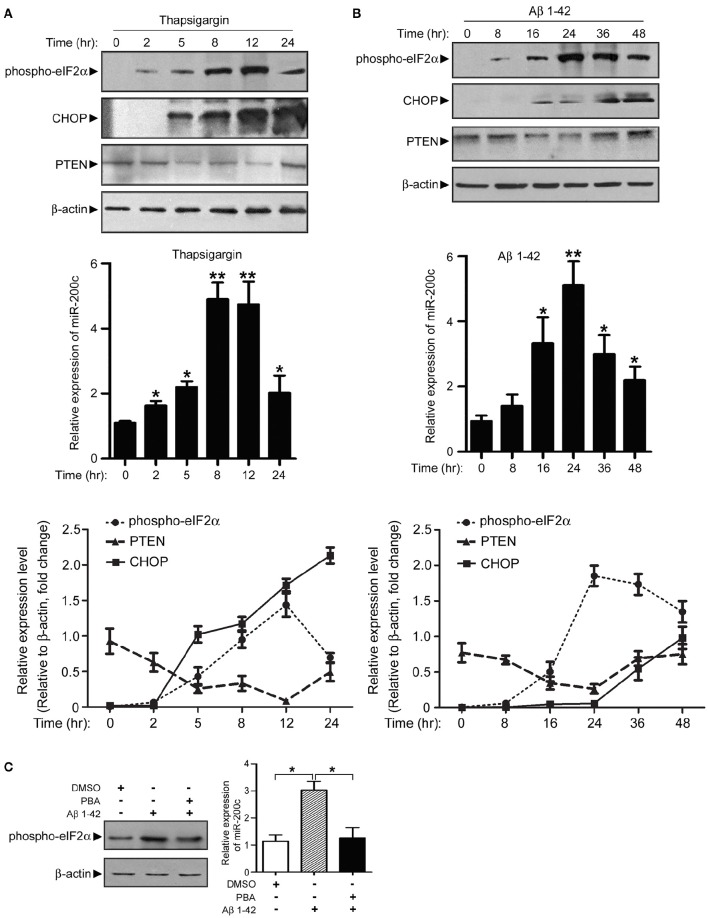
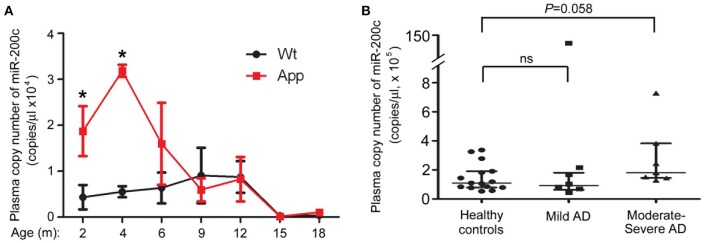
MicroRNAs are small non-coding RNAs that repress the expression of their target proteins. The roles of microRNAs in the development of Alzheimer's disease (AD) are not clear. In this study we show that miR-200c represses the expression of PTEN protein. PTEN downregulation by miR-200c supports the survival and differentiation of cultured neurons. AD is a progressive neurodegenerative disease signified by beta amyloid (Aβ) peptide aggregation and deposition. In a mouse model of AD that is induced by APPswe and PS1ΔE9 double transgenes, we found Aβ deposition results in neuronal ER stress that induces miR200c. Pharmacological blockade of ER stress inhibited Aβ-induced miR-200c overexpression in AD brains. MiR-200c was detected in the serum of both AD mice and human AD patients. These findings suggest that miR-200c functions as part of the neuronal cell-intrinsic adaptive machinery, and supports neuronal survival and differentiation in response to Aβ induced ER-stress by downregulating PTEN.

Keywords: Alzheimer's disease (AD); PTEN; beta amyloid peptide (Aβ); endoplasmic reticulum stress (ER stress); miR-200c; microRNA.


Figures

Figure 1
Figure 1
Identification of PTEN as a target of microRNA 200 family. (A) Schematic diagram of the putative mmu-miR-200 family binding sites in mouse PTEN 3′-UTR. As predicted by Targetscan (version 6.2, 2012), three miR-200 family bind sites (Site I and Site III for miR-141/200a, Site II for miR-200b/c/429) are highlighted. (B) 293T cells were transiently transfected with a pMIR-Reporter construct containing the full-length of 3′UTR of PTEN and an internal control plasmid (β-gal-pCMV), together with either individuals of miR-200 family (miR-141, miR-200a, miR-429, miR-200b, and miR-200c) or different mixtures of miR-200 family (miR-141/200a, miR-200b/c/429 or the whole miR-200 family). Luciferase activity was measured and normalized against the β-gal activity in the same samples. Experiments were repeated for three times. Data are represented as mean ± SEM. (n = 3) (*P < 0.05, **P < 0.01, ***P < 0.001, compared to miR-mimic-control transfected cells). (C) pMIR-Reporter-PTEN was transfected into 293T cells with different combination of miR-200 inhibitors (miR-141/200a inhibitors, miR-200b/c/429 inhibitors or miR-200 family inhibitors). Luciferase activity was measured similar as described in (B) and three independent experiments were performed. Data are represented as mean ± SEM. (n = 3) (*P < 0.05, vs. miR-inhibitor-control transfected cells). (D–F) Seed sequence of miR-200 binding sites (Site I to III) in 3′UTR of PTEN were mutated individually. pMIR-Reporter constructs containing either wild type or mutant fragments of PTEN 3′UTR were co-transfected into 293T cells with miR-200 family miRs (miR-141/200a, miR-200b/c/429, or miR-200c). Twenty four hour after transfection, cells were collected and subjected to luciferase assay. Experiments were repeated for three times independently. Data are represented as mean ± SEM. (*P < 0.05, **P < 0.01, compared to wild-type). (G) 293T cells were transfected with different miR-200 family members. Cell lysates were subjected to immunoblotting with antibodies against PTEN or GAPDH. The experiments were repeated for three times. Gray degree values are quantified by Image J software. The result was shown as the mean ± SEM. (Lower panel).
Figure 2
Figure 2
Effects of miR-200c and PTEN on neuronal cell viability. (A) PC12 cells were transfected with miR-200c mimic or inhibitor for 24 h, followed by NGF-induced differentiation [Cells were treated with 100 ng/ml NGF in DMEM supplemented with 0.5% HS and 0.5% FBS (differentiation medium)] for 48 h. Cell viability was measured by MTT assay. Three independent experiments were performed. Data are represented as mean ± SEM. (*P < 0.05, miR-200c vs. mimic/inhibitor control). (B) PC12 cells were transfected with GFP-PTEN or PTEN siRNA. After 2 days differentiation induced by NGF, MTT assay was performed to measure the cell viability. Three independent experiments were performed. Data are represented as mean ± SEM. (*P < 0.05, vs. control). (C) Rat primary cortical neurons were transfected at DIV0 with miR-200c mimic or inhibitor. Cell viability was measured by MTT assay at DIV3. Three independent experiments were performed. Data are represented as mean ± SEM. (*P < 0.05, miR-200c vs. mimic/inhibitor control).
Figure 3
Figure 3
miR-200c is important for neurite outgrowth in PC12 cells and cultural cortical neuron. (A–D) Total RNA was extracted from rat primary cortical neurons (A) or NGF-treated PC12 cells (B) followed by qPCR to detect the expression of miR-200c. Data was shown as the fold change compared with DIV1 (cortical neuron) or before NGF treatment (PC12 cell). The lysates of primary cortical neurons (C) or PC12 cells (D) were subjected to immunoblotting analysis using PTEN antibody. (E–G) PC12 cells were transfected with miR-200c mimic or inhibitor together with GFP. Twenty four hours after transfection, cells were treated with NGF for another 48 h. Neurite outgrowth was visualized by immunostaining with β-tubulin-III (E). Longest neurite length (F) and total neurite length (G) from 80 to 100 transfected cells were measured by the Metamorph software. Three independent experiments were performed. Data are represented as mean ± SEM. (*P < 0.05, miR-200c vs. mimic/inhibitor control). (H–L) PTEN was overexpressed or knocked-down by the transfection of GFP-PTEN or PTEN siRNA followed by NGF treatment and measurement of neurite outgrowth. Data are represented as mean ± SEM from at least 3 independent experiments. (*P < 0.05 vs. mimic/inhibitor control. Scale bars: 20 μm). PTEN expression level was measured by immunoblotting (K,L).
Figure 4
Figure 4
miR-200c protects neurons from Aβ-induced damage. (A,B) PC12 cells (A) or rat cortical neurons (B) were transfected with miR-200 (mimic or inhibitor). After 48-h culturing (PC12 cells were differentiated by NGF), the cells were treated with indicated doses of Aβ1−42 for 48 h. Cell viability was measured by MTT assay. Three independent experiments were performed. Data are represented as mean ± SEM. (*P < 0.05, **P < 0.01). (C) Rat cortical neurons at DIV0 were transfected with miR-200c mimic or inhibitor with GFP. Twenty four hours after transfection, cells were treated with Aβ (1 μM) for another 48 h. AChE positive cells was visualized by immunostaining (Red). (D,E) Total (D) or the longest neurite length (E) were measured as described in Figure 3. Three independent experiments were performed. Data are represented as mean ± SEM. (*P < 0.05, **P < 0.01).
Figure 5
Figure 5
Expression pattern of miR-200c and PTEN in APP/PS1 mice brains is correlated with ER stress makers. (A) Expression profile of miR-200c during the different developmental stages of APP/PS1 mice cortexes were examined by analyzing six pairs of APP/PS1 mice and WT mice at each stage. Total RNA was extracted from mice cortexes. Relative expression of miR-200c was detected by qPCR Data was represented as fold changes compared with the level at 2-month old; *P < 0.05). (B,C) PTEN expression profile during the different developmental stage of APP/PS1 mice cortexes was determined by Western blotting. Lysate extracted from APP/PS1 or WT mice cortexes were subjected to immunoblotting with PTEN antibody (C) and the signal was quantified (APP/PS1 vs. age-matched WT, *P < 0.05, **P < 0.01) (B). (D) Cortex from APP/PS1 or WT mice brains were lysed by RIPA buffer. Protein lysate was subjected to immunoblotting with anti-phospho-PERK, anti-total-PERK, anti-phospho-eIF2α and anti-CHOP antibodies. Anti-β–actin served as a loading control. (E,F) The expression ratio of phospho-PERK/PERK (E) and elF2α/β-actin (F) were quantified.
Figure 6
Figure 6
Expression of miR-200c is regulated by Aβ-induced ER stress. (A) PC12 cells were treated with thapsigargin and cell lysate was harvested at different time points as indicated. Phospho-elF2α, CHOP, and PTEN were detected by immunoblotting (left panel). Total RNA was also extracted and subjected to qPCR analysis of miR-200c (right panel). Expression level of miR-200c is represented as the fold change compared to time point 0. (B) PC12 cells were treated with Aβ, followed by similar experiments described in (A). Data are represented as mean ± SEM. (*P < 0.05, **P < 0.01, compared to time point 0). (C) NGF-differentiated PC12 cells were pretreated by ER stress inhibitor PBA for 2 h before 24 h Aβ treatment Phospho-eIF2α (left panel) or miR-200c (right panel) were detected by immunoblotting and qPCR, respectively. Data are represented as mean ± SEM. (*P < 0.01).
Figure 7
Figure 7
Detection of plasma-circulating miR-200c in AD mice model and patients. (A) Plasma samples were collected from six APP/PS1 and six WT mice at indicated ages (A) or from 14 AD patients and 15 age-matched healthy controls (B). Absolute copies of miR-200c in plasma were examined by TaqMan qRT-PCR (*P < 0.05, compared to relative WT control). AD patients were divided into two groups according to the disease severity. Data are represented as mean ± SEM. Statistical significance was determined by one-way ANOVA followed by post-hoc t-test.

Similar articles

Cited by

References

    1. Banzhaf-Strathmann J., Benito E., May S., Arzberger T., Tahirovic S., Kretzschmar H., et al. . (2014). MicroRNA-125b induces tau hyperphosphorylation and cognitive deficits in Alzheimer's disease. EMBO J. 33, 1667–1680. 10.15252/embj.201387576 - DOI - PMC - PubMed
    1. Borchelt D. R., Davis J., Fischer M., Lee M. K., Slunt H. H., Ratovitsky T., et al. . (1996). A vector for expressing foreign genes in the brains and hearts of transgenic mice. Genet. Anal. Biomol. Eng. 13, 159–163. 10.1016/S1050-3862(96)00167-2 - DOI - PubMed
    1. Chen Z., Chen B., Xu W. F., Liu R. F., Yang J., Yu C. X. (2012). Effects of PTEN inhibition on regulation of tau phosphorylation in an okadaic acid-induced neurodegeneration model. Int. J. Dev. Neurosci. 30, 411–419. 10.1016/j.ijdevneu.2012.08.003 - DOI - PubMed
    1. Choi P. S., Zakhary L., Choi W. Y., Caron S., Alvarez-Saavedra E., Miska E. A., et al. . (2008). Members of the miRNA-200 family regulate olfactory neurogenesis. Neuron 57, 41–55. 10.1016/j.neuron.2007.11.018 - DOI - PMC - PubMed
    1. Cornejo V. H., Hetz C. (2013). The unfolded protein response in Alzheimer's disease. Semin. Immunopathol. 35, 277–292. 10.1007/s00281-013-0373-9 - DOI - PubMed

LinkOut - more resources