

Chrysophanic Acid Suppresses Adipogenesis and Induces Thermogenesis by Activating AMP-Activated Protein Kinase Alpha In vivo and In vitro
- PMID: 28008317
- PMCID: PMC5143616
- DOI: 10.3389/fphar.2016.00476
Chrysophanic Acid Suppresses Adipogenesis and Induces Thermogenesis by Activating AMP-Activated Protein Kinase Alpha In vivo and In vitro
Abstract
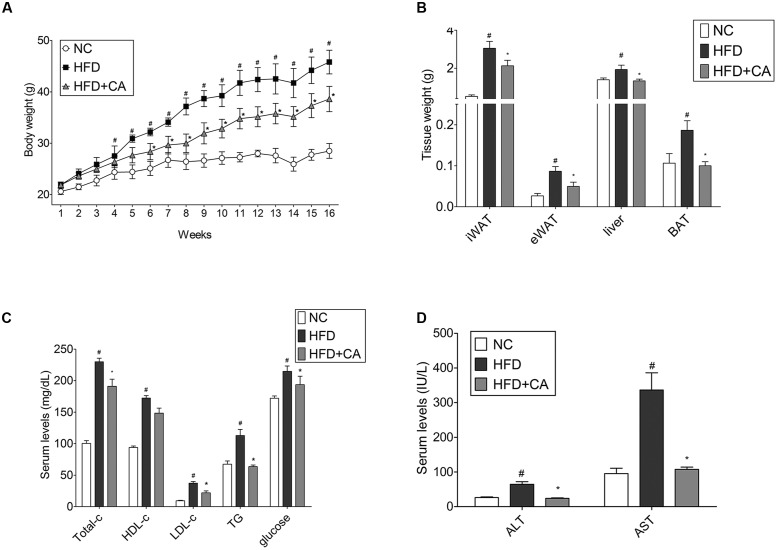
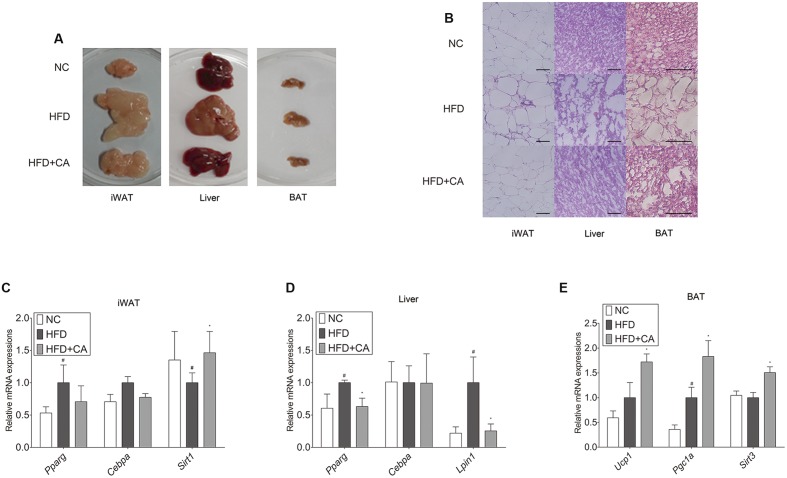
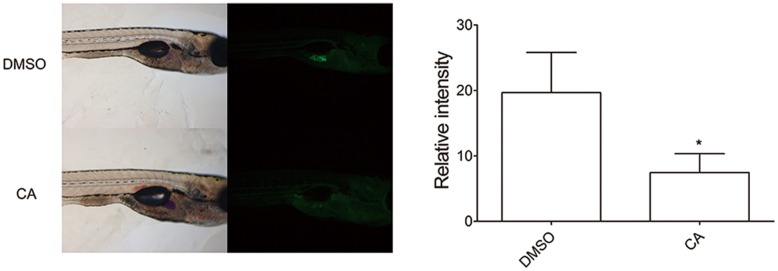
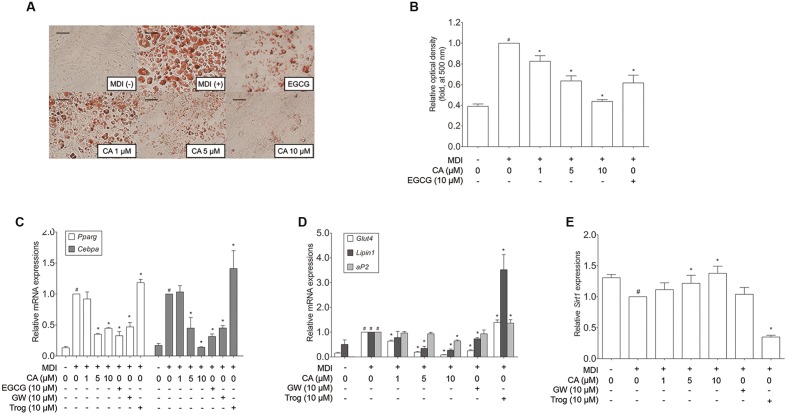
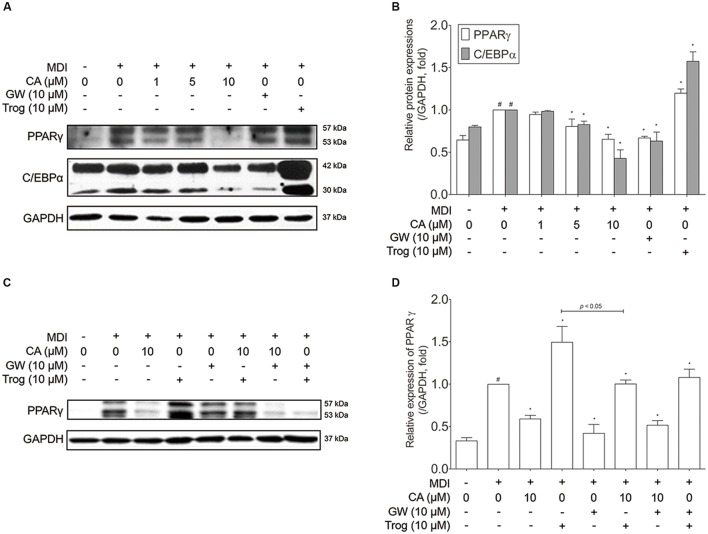
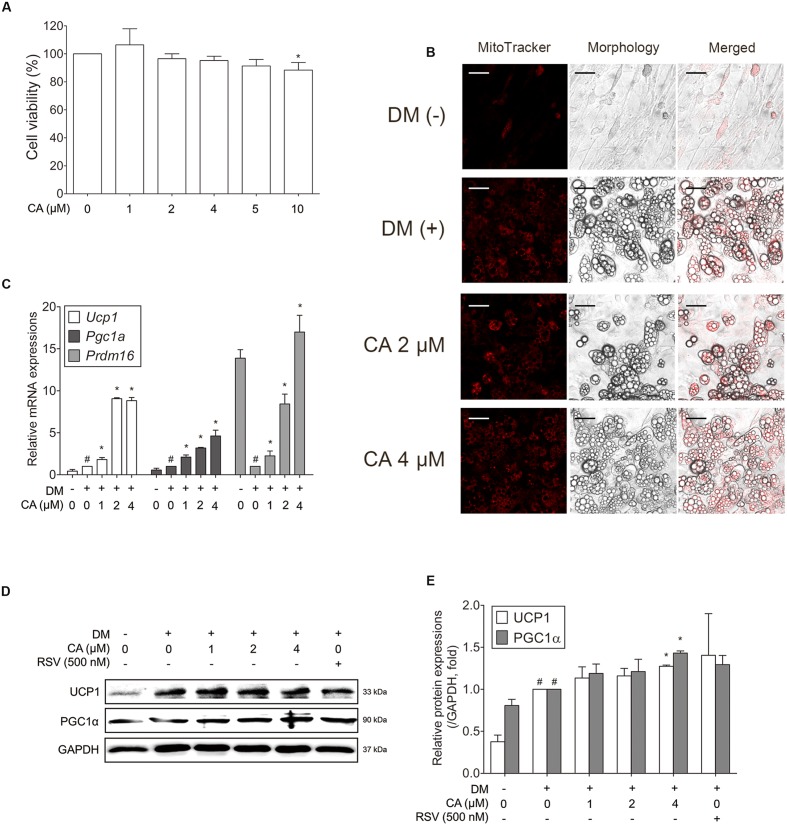
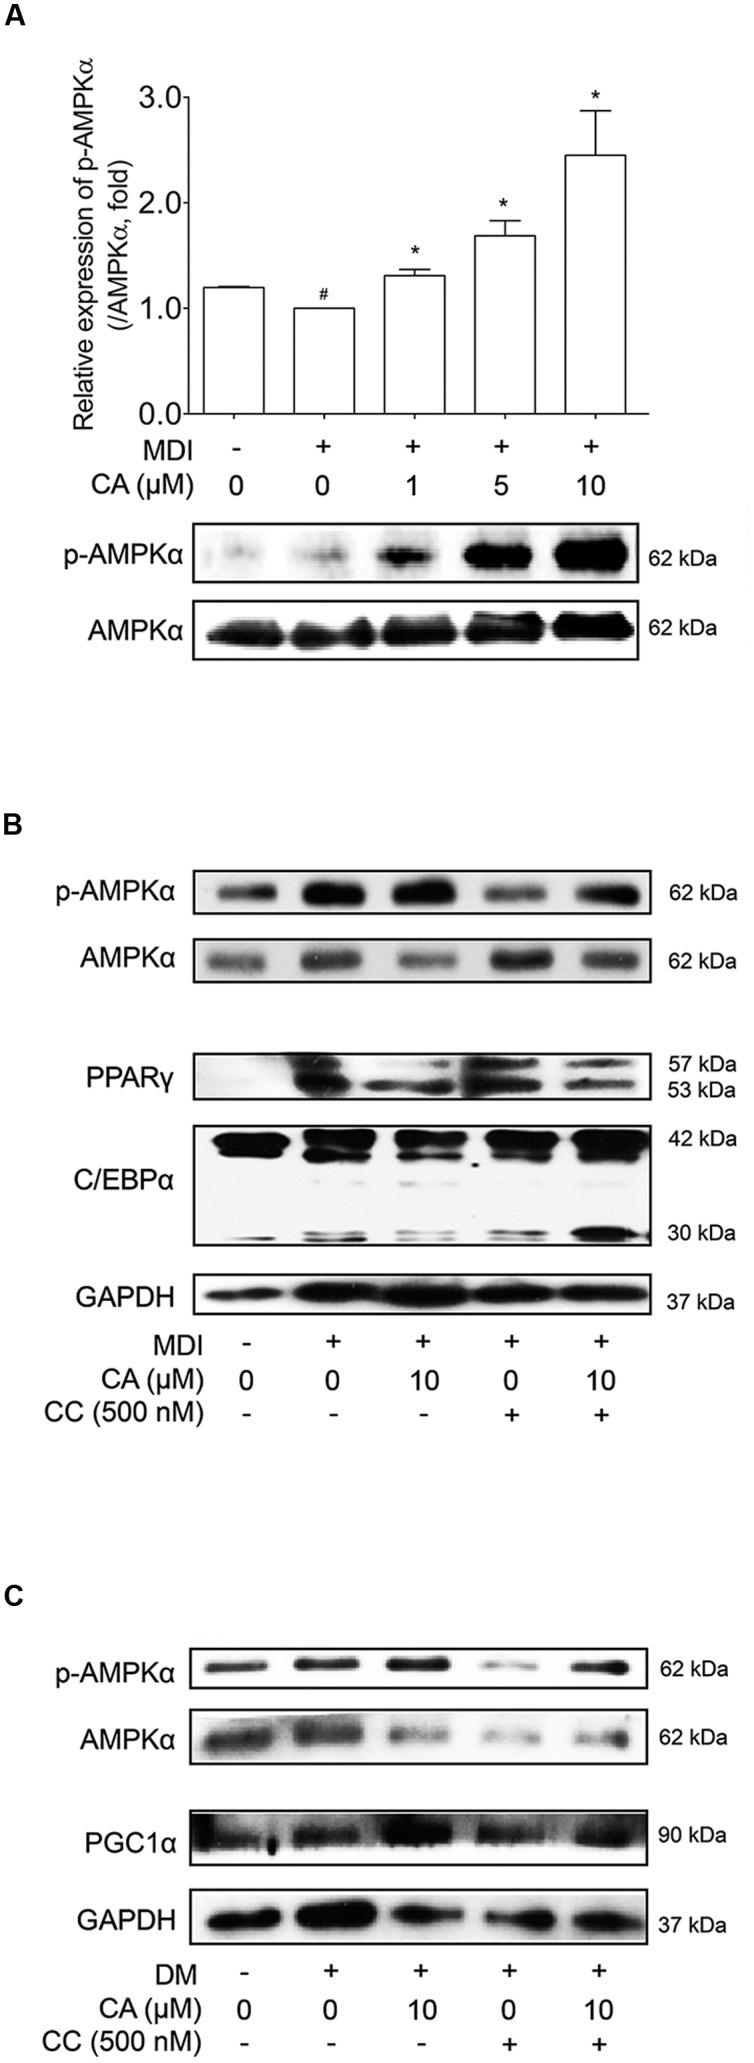
Chrysophanic acid (CA) is a member of the anthraquinone family abundant in rhubarb, a widely used herb for obesity treatment in Traditional Korean Medicine. Though several studies have indicated numerous features of CA, no study has yet reported the effect of CA on obesity. In this study, we tried to identify the anti-obesity effects of CA. By using 3T3-L1 adipocytes and primary cultured brown adipocytes as in vitro models, high-fat diet (HFD)-induced obese mice, and zebrafish as in vivo models, we determined the anti-obesity effects of CA. CA reduced weight gain in HFD-induced obese mice. They also decreased lipid accumulation and the expressions of adipogenesis factors including peroxisome proliferator-activated receptor gamma (PPARγ) and CCAAT/enhancer-binding protein alpha (C/EBPα) in 3T3-L1 adipocytes. In addition, uncoupling protein 1 (UCP1) and peroxisome proliferator-activated receptor gamma coactivator 1-alpha (PGC1α), the brown fat specific thermogenic genes, were up-regulated in brown adipocytes by CA treatment. Furthermore, when co-treated with Compound C, the AMP-activated protein kinase (AMPK) inhibitor, the action of CA on AMPKα was nullified in both types of adipocytes, indicating the multi-controlling effect of CA was partially via the AMPKα pathway. Given all together, these results indicate that CA can ameliorate obesity by controlling the adipogenic and thermogenic pathway at the same time. On these bases, we suggest the new potential of CA as an anti-obese pharmacotherapy.
Keywords: AMP-activated protein kinase alpha; adipogenesis; chrysophanic acid; obesity; thermogenesis.
Figures
Similar articles
-
Platycodin D, a novel activator of AMP-activated protein kinase, attenuates obesity in db/db mice via regulation of adipogenesis and thermogenesis.Phytomedicine. 2019 Jan;52:254-263. doi: 10.1016/j.phymed.2018.09.227. Epub 2018 Sep 27. Phytomedicine. 2019. PMID: 30599906
-
Vanillic acid attenuates obesity via activation of the AMPK pathway and thermogenic factors in vivo and in vitro.FASEB J. 2018 Mar;32(3):1388-1402. doi: 10.1096/fj.201700231RR. FASEB J. 2018. PMID: 29141998
-
Bitter Orange (Citrus aurantium Linné) Improves Obesity by Regulating Adipogenesis and Thermogenesis through AMPK Activation.Nutrients. 2019 Aug 22;11(9):1988. doi: 10.3390/nu11091988. Nutrients. 2019. PMID: 31443565 Free PMC article.
-
Formononetin, an isoflavone, activates AMP-activated protein kinase/β-catenin signalling to inhibit adipogenesis and rescues C57BL/6 mice from high-fat diet-induced obesity and bone loss.Br J Nutr. 2017 Mar;117(5):645-661. doi: 10.1017/S0007114517000149. Epub 2017 Apr 3. Br J Nutr. 2017. PMID: 28367764
-
Secoisolariciresinol diglucoside inhibits adipogenesis through the AMPK pathway.Eur J Pharmacol. 2018 Feb 5;820:235-244. doi: 10.1016/j.ejphar.2017.12.038. Epub 2017 Dec 18. Eur J Pharmacol. 2018. PMID: 29269018
Cited by
-
Role of anthraquinones in combating insulin resistance.Front Pharmacol. 2023 Nov 20;14:1275430. doi: 10.3389/fphar.2023.1275430. eCollection 2023. Front Pharmacol. 2023. PMID: 38053837 Free PMC article. Review.
-
Non-shivering Thermogenesis Signalling Regulation and Potential Therapeutic Applications of Brown Adipose Tissue.Int J Biol Sci. 2021 Jul 13;17(11):2853-2870. doi: 10.7150/ijbs.60354. eCollection 2021. Int J Biol Sci. 2021. PMID: 34345212 Free PMC article. Review.
-
Peanut Shell Extract and Luteolin Regulate Lipid Metabolism and Induce Browning in 3T3-L1 Adipocytes.Foods. 2022 Sep 3;11(17):2696. doi: 10.3390/foods11172696. Foods. 2022. PMID: 36076880 Free PMC article.
-
The Mechanism of Traditional Chinese Medicine for the Treatment of Obesity.Diabetes Metab Syndr Obes. 2020 Sep 25;13:3371-3381. doi: 10.2147/DMSO.S274534. eCollection 2020. Diabetes Metab Syndr Obes. 2020. PMID: 33061498 Free PMC article. Review.
-
Active compound chrysophanol of Cassia tora seeds suppresses heat-induced lipogenesis via inactivation of JNK/p38 MAPK signaling in human sebocytes.Lipids Health Dis. 2019 Jun 7;18(1):135. doi: 10.1186/s12944-019-1072-x. Lipids Health Dis. 2019. PMID: 31174532 Free PMC article.
References
-
- Andrade J. M., Frade A. C., Guimarães J. B., Freitas K. M., Lopes M. T., Guimarães A. L., et al. (2014). Resveratrol increases brown adipose tissue thermogenesis markers by increasing SIRT1 and energy expenditure and decreasing fat accumulation in adipose tissue of mice fed a standard diet. Eur. J. Nutr. 53 1503–1510. 10.1007/s00394-014-0655-6 - DOI - PubMed
LinkOut - more resources
Full Text Sources
Other Literature Sources
Molecular Biology Databases
Research Materials