. 2016 Dec 23:7:13720.
doi: 10.1038/ncomms13720.

The tumour microenvironment harbours ontogenically distinct dendritic cell populations with opposing effects on tumour immunity

Affiliations

The tumour microenvironment harbours ontogenically distinct dendritic cell populations with opposing effects on tumour immunity

Damya Laoui et al. Nat Commun. .

Abstract

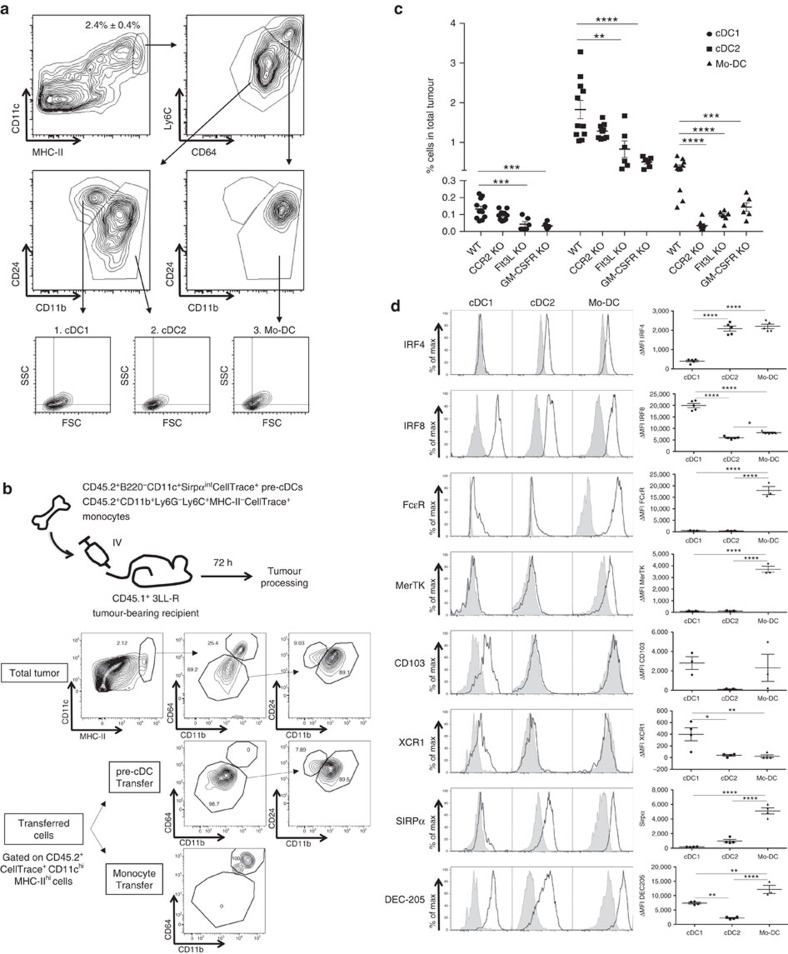
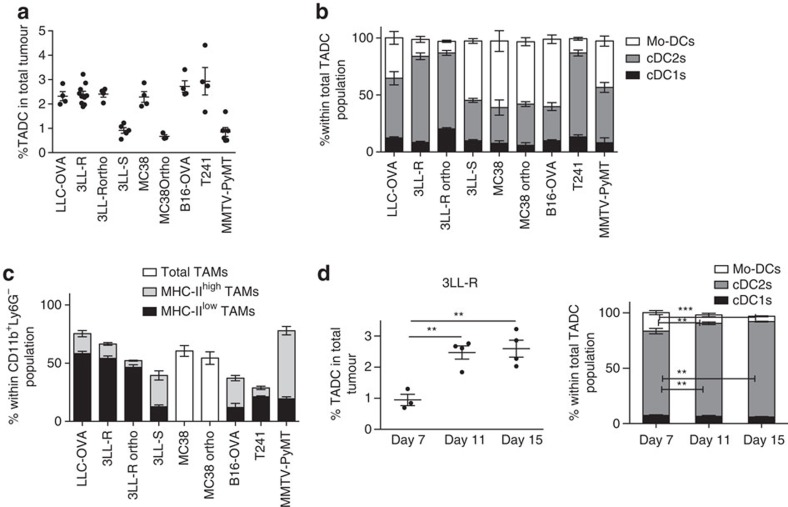
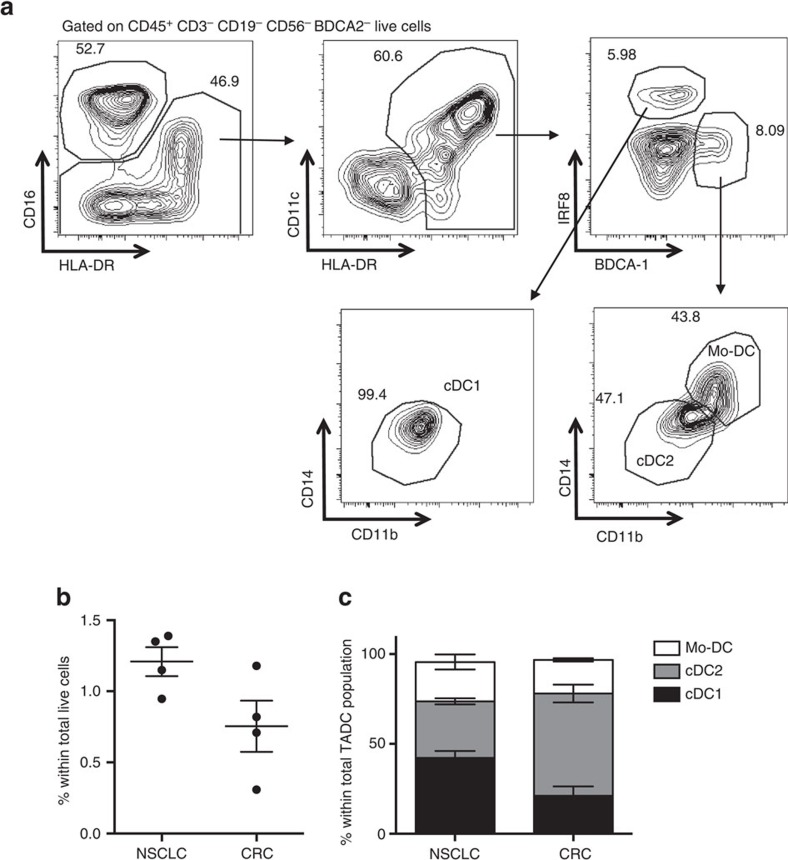
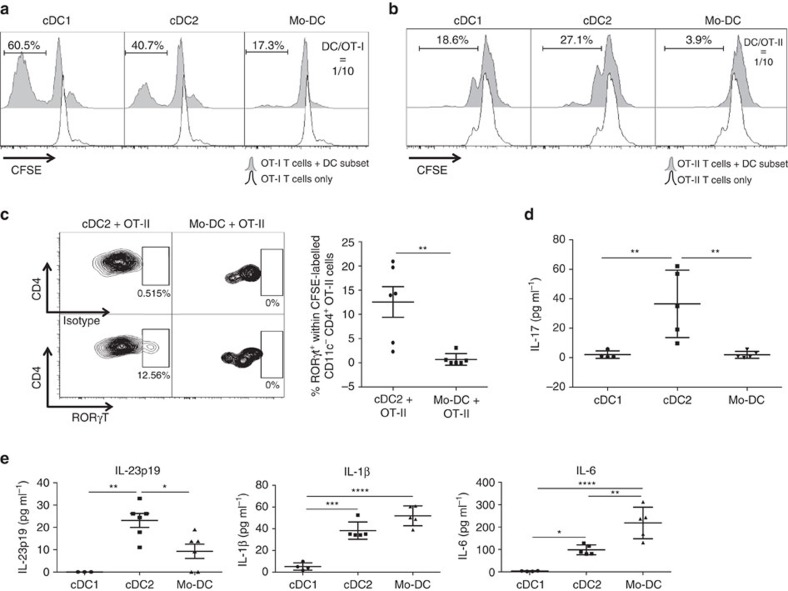
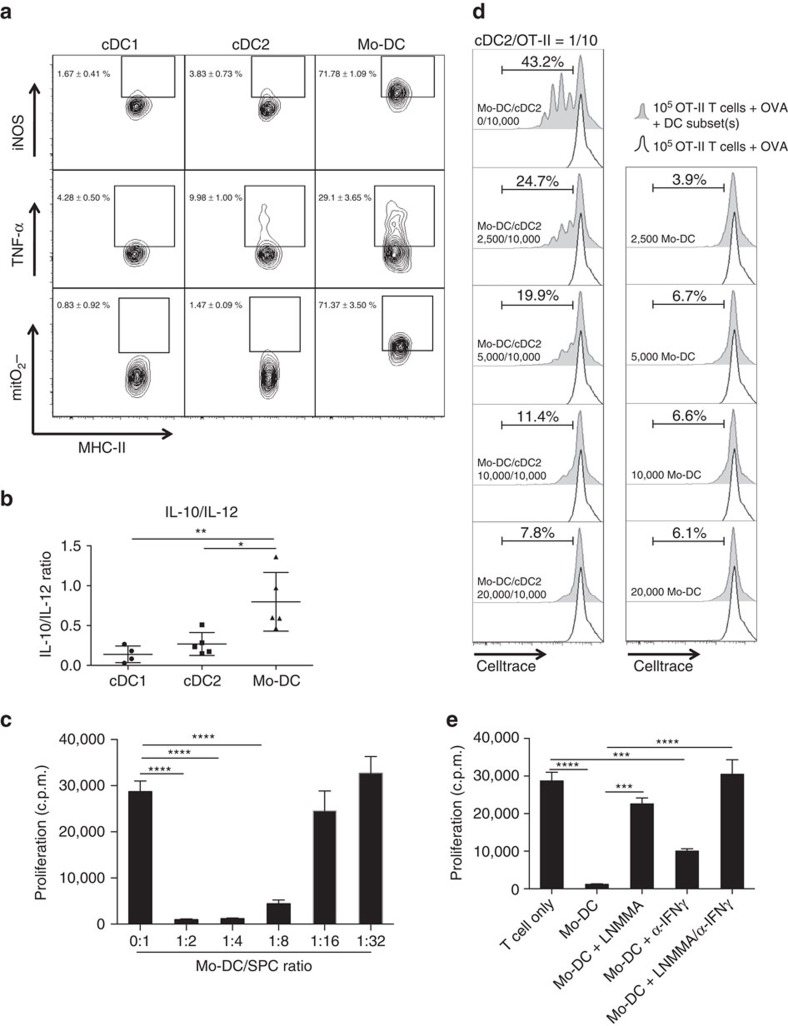
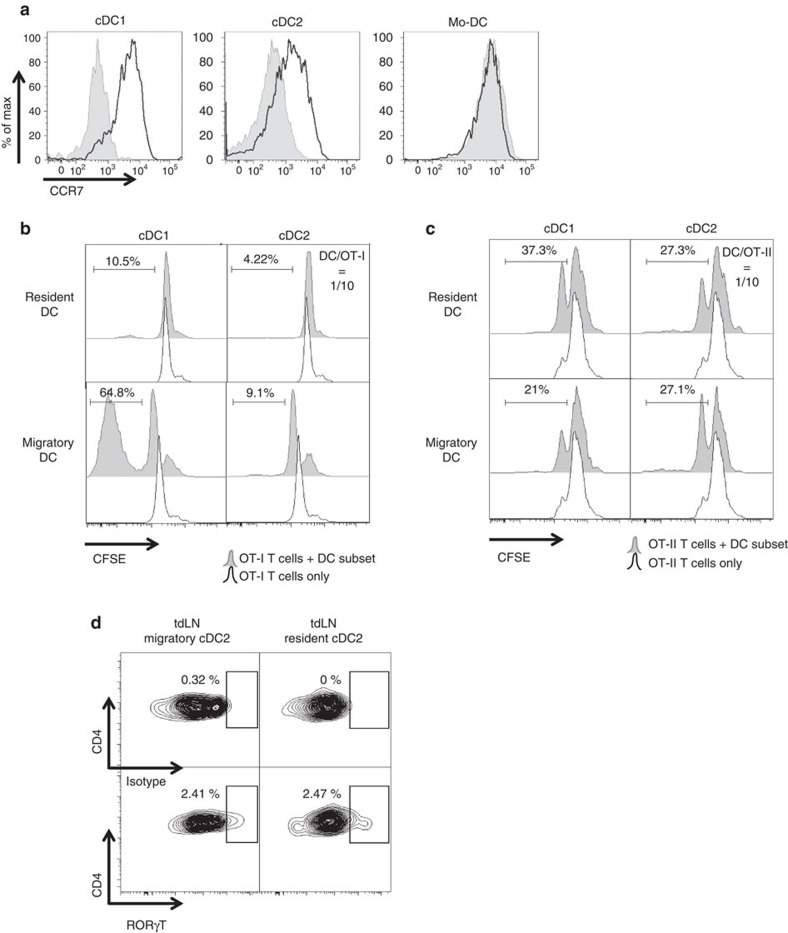
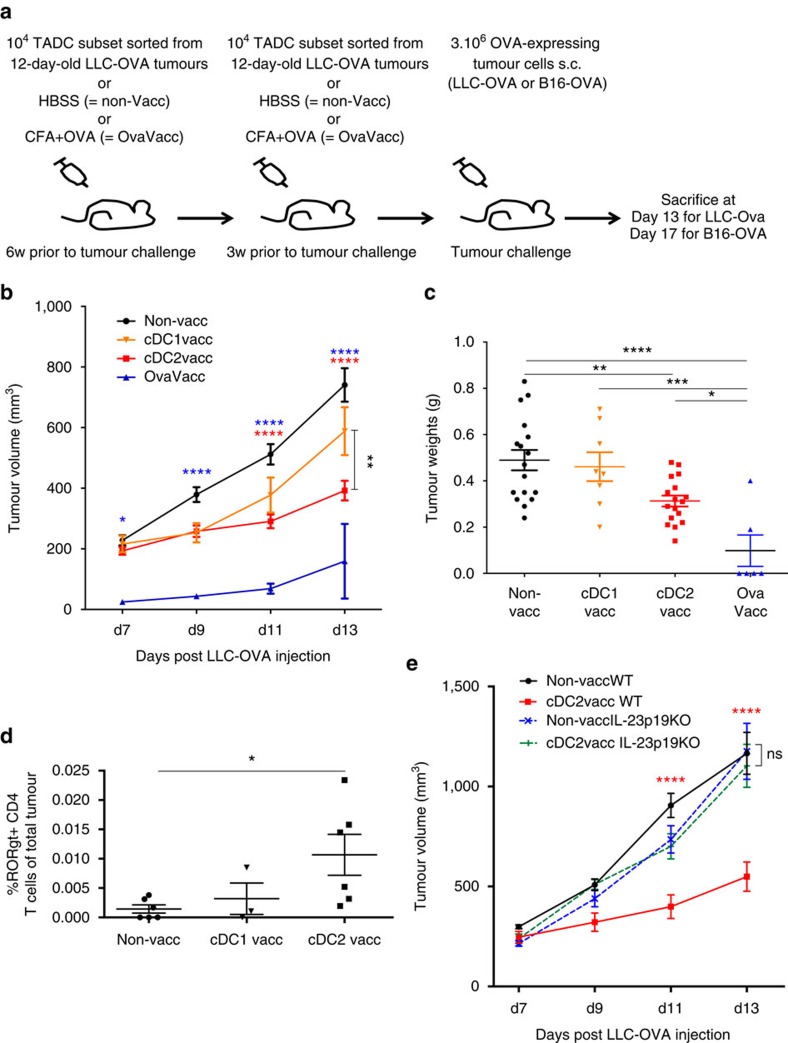
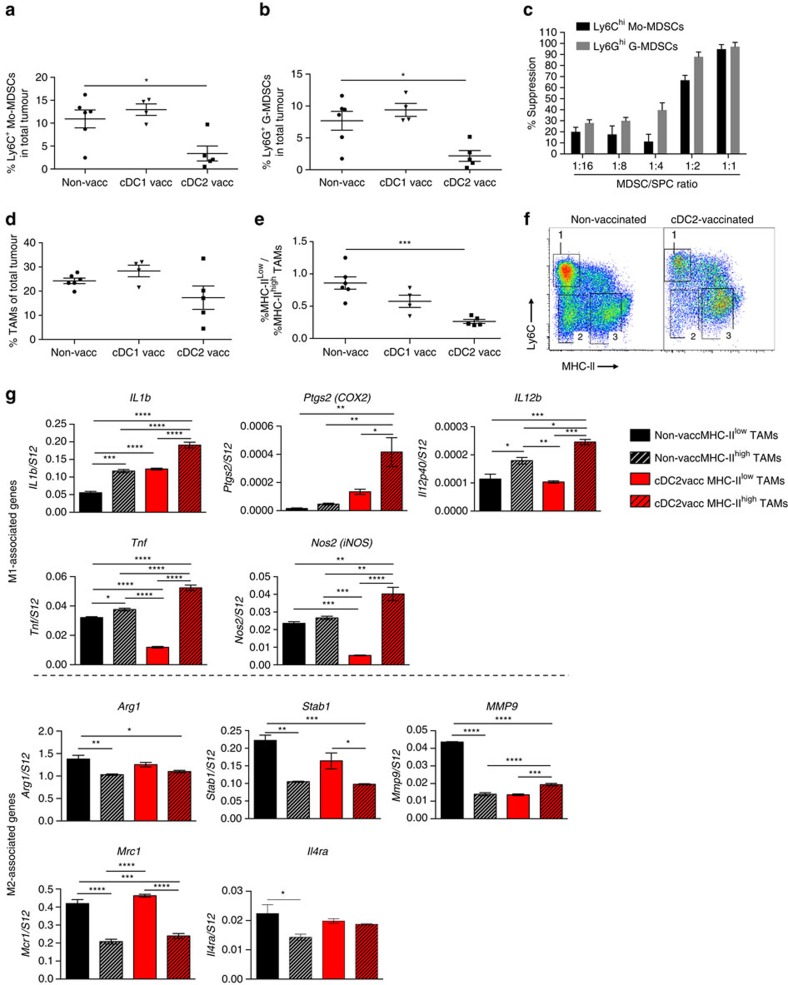
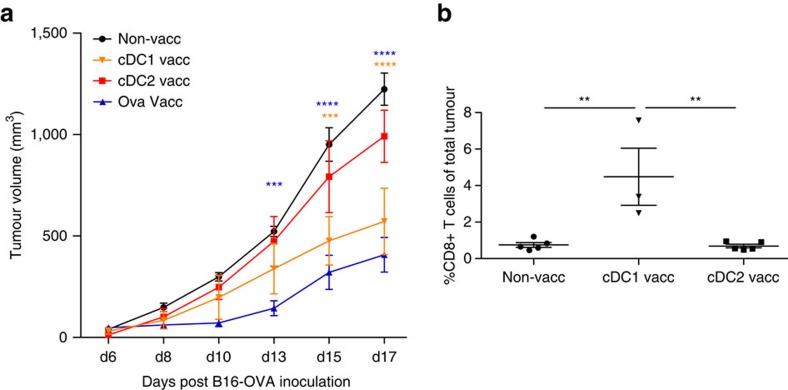
Various steady state and inflamed tissues have been shown to contain a heterogeneous DC population consisting of developmentally distinct subsets, including cDC1s, cDC2s and monocyte-derived DCs, displaying differential functional specializations. The identification of functionally distinct tumour-associated DC (TADC) subpopulations could prove essential for the understanding of basic TADC biology and for envisaging targeted immunotherapies. We demonstrate that multiple mouse tumours as well as human tumours harbour ontogenically discrete TADC subsets. Monocyte-derived TADCs are prominent in tumour antigen uptake, but lack strong T-cell stimulatory capacity due to NO-mediated immunosuppression. Pre-cDC-derived TADCs have lymph node migratory potential, whereby cDC1s efficiently activate CD8+ T cells and cDC2s induce Th17 cells. Mice vaccinated with cDC2s displayed a reduced tumour growth accompanied by a reprogramming of pro-tumoural TAMs and a reduction of MDSCs, while cDC1 vaccination strongly induces anti-tumour CTLs. Our data might prove important for therapeutic interventions targeted at specific TADC subsets or their precursors.


Figures

Figure 1
Figure 1. Origin of different TADC subpopulations.
(a) TADCs of 12-day-old 3LL-R tumours were subdivided into (1). CD64neg CD24pos CD11blo cDC1s, (2). CD64neg CD24neg CD11bpos Ly6Clo cDC2s and (3). CD64pos CD24int CD11bpos Ly6Chi Mo-DCs. For each subset, forward scatter versus side scatter plots are shown. Results are representative of four independent experiments with n≥4. (b) Pre-cDCs (B220CD11c+Sirpαint) and monocyte precursors (CD11b+Ly6GLy6C+MHC-II) were sorted from CD45.2+ bone marrow and labelled with CellTrace. Either 4 × 10⁵ pre-cDCs or 1 × 10⁶ monocytes were adoptively transferred (IV) to CD45.1 7-day-old 3LL-R tumour-bearing recipient mice. Three days later, tumours were processed and transferred cells were gated based on their CD45.1CD45.2+CellTrace+ phenotype. Results are representative of two independent experiments with n=2–4. (c) 3LL-R tumours were grown for 12 days in WT, CCR2-KO, Flt3L-KO and GM-CSFR KO mice. The percentage of each TADC subpopulation within the total tumour single-cell suspension was determined. Results are representative of two independent experiments with n=6. Statistical analysis by two-way ANOVA. *P<0.05; **P<0.01; ***P<0.001; ****P<0.0001. (d) Single-cell suspensions of 12-day-old 3LL-R tumours were stained for the indicated markers and histogram overlays are shown for the TADC subsets. Black line=expression of the indicated marker; shaded histogram=isotype control. ΔMFI±s.e.m. are indicated and represent (MFI marker−MFI control). Results are representative of two independent experiments with n≥4. Statistical analysis by one-way ANOVA. *P<0.05; **P<0.01; ***P<0.001; ****P<0.0001.
Figure 2
Figure 2. Several tumour types are infiltrated with distinct TADC subsets.
(a) TADCs were gated as doubletsneg live (AQUAneg) Ly6Gneg CD3neg CD19neg CD11cpos MHC-IIpos cells in single-cell suspensions of 20-day-old subcutaneous (s.c.) LLC-OVA lung carcinoma, 12-day-old s.c. 3LL-R lung carcinoma, 6-day-old 3LL-R orthotopically injected lung carcinoma, 35-day-old s.c. 3LL-S lung carcinoma, 17-day-old s.c. MC38 colon carcinoma, 28-day-old MC38 orthotopically injected colon carcinoma, 20-day-old B16-OVA s.c. melanoma, 20-day-old T241 s.c. fibrosarcoma and 16-week-old spontaneously grown MMTV-PyMT mammary carcinoma with tumours of similar volumes. (b) The percentage of each TADC subset within the total TADC population was determined for indicated tumours of similar volumes. (c) The percentage of each TAM subset within the total CD11b+ Ly6G population was determined for indicated tumours of similar volumes. (ac) Graphs show mean±s.e.m. Results are representative of two independent experiments with n=3–10. (d) Amount of total TADCs (d, left panel) and TADC subsets (d, right panel) was assessed in single-cell suspensions of 7-, 11- and 15-day-old 3LL-R tumours. Graphs show mean±s.e.m. Results are representative of three independent experiments with n≥4. Statistical analysis by one-way ANOVA. *P<0.05; **P<0.01; ***P<0.001; ****P<0.0001.
Figure 3
Figure 3. The presence of distinct TADC subsets can be recapitulated in human tumours.
(a) Human NSCLC tumour biopsies were pre-gated on CD45+ CD3 CD19 CD56 BDCA2 live cells and CD16 CD11chigh HLA-DR+ cells were subdivided into (i) BDCA1 IRF8+ CD14 CD11blow cDC1s, (ii) BDCA1+ IRF8 CD14 CD11b+ cDC2s and (iii) BDCA1+ IRF8 CD14+ CD11bhigh Mo-DCs. (b,c) The total percentage of TADCs (sum of three subsets) (b) and the percentage of each TADC subset within the total TADC population (c) was determined for (NSCLC) and colorectal (CRC) tumours. For all experiments, graphs show mean±s.e.m. n=4 patients per tumour type.
Figure 4
Figure 4. Antigen uptake and presentation differ in the distinct TADC subsets.
(a,b) In vitro OVA-uptake assay. (a) Single-cell suspensions of 12-day-old 3LL-R tumours were cultured in vitro, in the absence (control) or presence of OVA-AF488 for 15 min at 4 or 37 °C. (b) The percentage of the distinct TADC subsets within the total TADC gate or within the OVA+ TADC gate are given. Results are representative of two independent experiments with n≥4. Statistical analysis by one-way ANOVA. ***P<0.001; ****P<0.0001. (c) DQ-OVA processing. 12-day-old 3LL-R tumour subsets were allowed to take up and process DQ-OVA for 15′ at 0 or 37 °C. Free DQ-OVA was subsequently removed from the culture medium and cells were given an additional 15, 30, 60 or 90 min to process internalized DQ-OVA. DQ-OVA processing results in the formation of fluorescent peptides and % of DQ-OVA+ TADCs are shown for each time point. n=3 pools of 4 tumours. Statistical analysis by two-way ANOVA. ****P<0.0001. (d) Cross-presentation by the different TADC subsets in LLC-OVA was assessed by staining for the OVA-derived peptide SIINFEKL in association with MHC-I. Black line=SIINFEKL expression of TADCs in LLC-OVA tumours; shaded histograms=SIINFEKL expression of TADCs in LLC tumours (control). ΔMFI are indicated and represent (MFI SIINFEKL in LLC-OVA−MFI SIINFEKL in LLC). Results are representative of two independent experiments with n=4.
Figure 5
Figure 5. TADC subsets show distinct T-cell proliferative capacities.
(a,b) Sorted TADC subsets were co-cultured with OT-I (a) or OT-II (b) T cells for 3 days at a DC/T-cell ratio of 1/10. The histograms represent CFSE dilution, indicative for T-cell proliferation. Black line=non-stimulated T cells without TADCs; shaded histogram=T cells in the presence of TADCs. Results are representative of three independent experiments with n=pool of 10–12 tumours. (c) Intracellular staining on OT-II T cells co-cultured with cDC2s or Mo-DCs for 3 days at a DC/OT-II ratio of 1/5 was performed for the Th-inducing transcription factor RORγt. Isotype control and transcription factor staining are depicted. n=6. Statistical analysis by one-way ANOVA. **P<0.01. (d) Supernatants of co-cultures of TADC subsets and OT-II T cells (DC/OT-II=1/10) were tested for the presence of IL-17 by luminex. n≥4. Statistical analysis by one-way ANOVA. **P<0.01. (e) Supernatants of TADC subsets cultured for 48 h were tested for the presence of IL-23p19, IL-6 and IL-1β by luminex. n≥4. Statistical analysis by one-way ANOVA. *P<0.05; **P<0.01; ***P<0.001; ****P<0.0001.
Figure 6
Figure 6. Mo-DCs display an immune suppressive TIP-DC phenotype.
(a) Intracellular staining for iNOS, TNF-α and mitochondrial superoxide anion was performed on single-cell suspensions of 12-day-old 3LL-R tumours. n=4. (b) Supernatants of TADC subsets cultured for 48 h were tested for the presence of IL-10 and IL-12 by luminex. The graph depicts the IL-10/IL-12 ratio. n≥4. Statistical analysis by one-way ANOVA. *P<0.05; **P<0.01. (c) Mo-DCs were sorted from 12-day-old 3LL-R tumour single-cell suspensions and added at different ratios to splenocytes stimulated with anti-CD3 and anti-CD28 during 42 h and the proliferation of T cells was measured via 3H-thymidine incorporation (c.p.m.). Results are representative of two independent experiments with n=pool of 12 tumours. Statistical analysis by one-way ANOVA, ****P<0.0001. (d) Sorted Mo-DCs were added at increasing concentrations to 105 OVA-stimulated OT-II T cells in the presence (left panels) or absence (right panels) of sorted cDC2s at a cDC2/OT-II ratio of 1/10. The histograms represent CellTrace dilution, indicative for T-cell proliferation. Black line=OVA-stimulated T cells without TADCs; shaded histogram=OVA-stimulated T cells in the presence of TADCs. n=pool of 12 tumours. (e) Sorted Mo-DCs were co-cultured with anti-CD3/CD28-stimulated splenocytes at a Mo-DC/SPC ratio of 1/4 with or without iNOS inhibitor (LNMMA) and/or α-IFN-γ. T-cell proliferation was measured via 3H-thymidine incorporation after 42 h (c.p.m.). n=pool of 12 tumours. Statistical analysis by one-way ANOVA, ***P<0.001; ****P<0.0001.
Figure 7
Figure 7. Both tumour-associated cDC subsets migrate to tumour draining lymph nodes and differentially activate CD8+ and CD4+ T cells.
(a) Single-cell suspensions of 12-day-old 3LL-R tumours were stained for CCR7 and histogram overlays are shown. Black line=expression of CCR7; shaded histogram=isotype control. Results are representative of three independent experiments with n=4. (b,c) The indicated amount of sorted DC subsets from tumour-draining lymph nodes were co-cultured for 3 days with 105 purified CD8+ OT-I T cells (b) or CD4+ OT-II T cells (c). The histograms represent CFSE dilution, indicative for T-cell proliferation. Black line=non-stimulated T cells without TADCs; shaded histogram=T cells in the presence of TADCs. Results are representative of three independent experiments with n=pool of 10–12 tumours. (d) Intracellular staining on OT-II T cells co-cultered with sorted tumour-draining lymph nodes cDC2 subsets for 3 days at a DC/OT-II ratio of 1/10 was performed for the Th17-inducing transcription factor RORγt. Isotype control and transcription factor staining are depicted. n=pool of 10.
Figure 8
Figure 8. cDC2 vaccination is more beneficial than cDC1 vaccination in LLC-OVA tumour-bearing mice and induces a Th17 phenotype.
(a) Schematic representation of the vaccination protocol. (b,c) Growth curve (b) and tumour weights (c) of LLC-OVA tumours after vaccination with LLC-OVA TADC subsets. (d) Percentages RORγt+ CD4+ T cells in LLC-OVA tumours after vaccination with LLC-OVA TADC subsets following the protocol depicted in (a). For all experiments, results are representative of two independent experiments with n=4–15 tumours. (e) Growth curve of LLC-OVA tumours after vaccination with LLC-OVA derived cDC2s in WT or IL-23p19 KO mice. n=8. Statistical analysis by one-way ANOVA. *P<0.05; **P<0.01; ***P<0.001; ****P<0.0001.
Figure 9
Figure 9. cDC2 vaccination reduces the MDSC infiltrate and reprograms TAMs from a protumoral M2-like to an M1-like phenotype.
(a,b) Percentages of Mo-MDSCs (a) and G-MDSCs (b) in LLC-OVA tumours after vaccination with LLC-OVA TADC subsets following the protocol depicted in Fig. 8a. Results are representative of two independent experiments with n=4–15 tumours. Statistical analysis by one-way ANOVA. *P<0.05. (c) CD11b+ Ly6Chi Ly6G Mo-MDSCs and CD11b+ Ly6Cint Ly6G+ G-MDSCs were sorted from 12-day-old 3LL-R tumour single-cell suspensions and added at different ratios to anti-CD3-stimulated splenocytes during 42 h and the proliferation T cells was measured via 3H-thymidine incorporation (c.p.m.). Results are representative of three independent experiments with n=pool of 6 tumours. (d,e) Percentages of CD11b+ Ly6G+ Ly6C TAMs (d) and the ratio of M2-like MHC-IIlow TAMs/M1-like MHC-IIhigh TAMs (e) in LLC-OVA tumours after vaccination with LLC-OVA TADC subsets following the protocol depicted in Fig. 8a. Results are representative of two independent experiments with n=4–15 tumours. Statistical analysis by one-way ANOVA. ***P<0.001. (f) Representative plot of LLC-OVA tumours of cDC2- or HBSS-vaccinated mice gated on CD11b+ Ly6G- single cells, showing (1) Ly6C+monocytes, (2) MHC-IIlow TAMs and (3) MHC-IIhigh TAMs. (g) Expression of indicated M1 and M2 associated genes in sorted MHC-IIlow and MHC-IIhigh TAM subsets of LLC-OVA tumour-bearing mice vaccinated with cDC2 or HBSS was assessed using qRT-PCR. The expression was normalized based on the S12 housekeeping gene. n=pool of 6 tumours. Statistical analysis by one-way ANOVA. *P<0.05; **P<0.01; ***P<0.001; ****P<0.0001.
Figure 10
Figure 10. cDC1 vaccination is more effective than cDC2 vaccination in B16 melanoma tumour-bearing mice.
(a,b) Growth curve of B16-OVA tumours (a) and percentages of CD8+ T cells in B16-OVA tumours (b) after vaccination with LLC-OVA TADC subsets following the protocol depicted in Fig. 8a. n=4–6 tumours. Statistical analysis by one-way ANOVA. **P<0.01; ***P<0.001; ****P<0.0001.

References

    1. Steinman R. M. & Banchereau J. Taking dendritic cells into medicine. Nature 449, 419–426 (2007). - PubMed
    1. Goc J. et al.. Dendritic cells in tumor-associated tertiary lymphoid structures signal a Th1 cytotoxic immune contexture and license the positive prognostic value of infiltrating CD8+ T cells. Cancer Res. 74, 705–715 (2014). - PubMed
    1. Fridman W. H. et al.. Prognostic and predictive impact of intra- and peritumoral immune infiltrates. Cancer Res. 71, 5601–5605 (2011). - PubMed
    1. Gabrilovich D. Mechanisms and functional significance of tumour-induced dendritic-cell defects. Nat. Rev. Immunol. 4, 941–952 (2004). - PubMed
    1. Vicari A. P., Caux C. & Trinchieri G. Tumour escape from immune surveillance through dendritic cell inactivation. Semin Cancer Biol. 12, 33–42 (2002). - PubMed

Publication types