. 2016 Dec 23:7:13965.
doi: 10.1038/ncomms13965.

Ecological networks are more sensitive to plant than to animal extinction under climate change

Affiliations

Ecological networks are more sensitive to plant than to animal extinction under climate change

Matthias Schleuning et al. Nat Commun. .

Abstract

Impacts of climate change on individual species are increasingly well documented, but we lack understanding of how these effects propagate through ecological communities. Here we combine species distribution models with ecological network analyses to test potential impacts of climate change on >700 plant and animal species in pollination and seed-dispersal networks from central Europe. We discover that animal species that interact with a low diversity of plant species have narrow climatic niches and are most vulnerable to climate change. In contrast, biotic specialization of plants is not related to climatic niche breadth and vulnerability. A simulation model incorporating different scenarios of species coextinction and capacities for partner switches shows that projected plant extinctions under climate change are more likely to trigger animal coextinctions than vice versa. This result demonstrates that impacts of climate change on biodiversity can be amplified via extinction cascades from plants to animals in ecological networks.


Figures

Figure 1
Figure 1. Biotic specialization in relation to climatic niche breadth and vulnerability to climate change.
Associations of (a,b) realized climatic niche breadth (climatic hypervolume, OMI climatic niche breadth61) and (c,d) projected climatic suitability change (RCP 6.0, RCP 8.5 scenarios; year 2070) with the effective number of partners (eH) of plant (n=295) and animal (n=414) species in 13 mutualistic interaction networks from central Europe. Specialization is the effective number of interaction partners of plant (blue) and animal (red) species in each network (shown on a log-scale). Trend lines indicate the estimated slope (β) in a mixed-effects model accounting for effects of network identity and animal and plant taxonomy on model intercepts. Shown are species' mean partial residuals plus intercept from these models; symbol size is proportional to the weight of each species in the analysis, corresponding to its number of occurrences across networks and, in the case of climatic suitability change, the accuracy of the species distribution model (TSSmax value64); given are slope estimates±1 s.e. for plants and animals, P values were derived by Kenward–Roger approximation: **P<0.01 and ***P<0.001 (for full statistics see Supplementary Table 1).
Figure 2
Figure 2. Secondary animal and plant extinction under climate change.
Shown are (a,b) secondary animal extinction in response to plant extinction and (c,d) secondary plant extinction in response to animal extinction for a seed-dispersal network from Białowieża forest (network ID=S1; 12 plant and 29 bird species). (a,c) Species (rectangles in red (animals) and blue (plants), connected by weighted interaction links; box and line width correspond to interaction frequencies) are removed sequentially according to projected suitability changes in climatic conditions. Low ranks (light shade) correspond to a high vulnerability to climate change, high ranks (dark shade) correspond to a low vulnerability; thus, light links are prone to extinction, whereas dark links are the persisting backbone of interactions under climate change. The corresponding secondary extinction plots (b) for animals (red) and (d) plants (blue) show network sensitivity to species extinction (filled area above the extinction curve) under four scenarios of species' flexibility (solid to dotted lines) to reallocate interactions to persisting partners (constrained rewiring); here secondary extinction is triggered after 50% interaction loss. In this network, sensitivity to plant extinction (red area) was larger than sensitivity to animal extinction (blue area), that is, animal species went more quickly secondarily extinct than plant species. Secondary extinction plots for the 12 other interaction networks are shown in Supplementary Fig. 1.
Figure 3
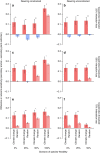
Figure 3. Differences in sensitivity to species extinction across 13 mutualistic networks.
Shown are differences in network sensitivity to plant versus animal extinction for different scenarios of species' sensitivity to coextinction, rewiring capacity and flexibility. Coextinction thresholds varied between (a,b) 25%, (c,d) 50% and (e,f) 75% of interaction loss. Species were able to rewire interactions (a,c,e) to persisting partners (constrained rewiring) or (b,d,f) to all persisting species in each network (unconstrained rewiring). Flexibility values (0%, 25%, 50%, 100%) indicate the proportion of lost interactions that was reallocated to other species in the respective scenario; we omitted the very unlikely scenario of unconstrained rewiring and 100% flexibility as it requires all species to go extinct to trigger secondary extinction. Shown are mean differences (±1 s.e.) across the 13 pollination and seed-dispersal networks between the impact of plant versus animal extinction; values >0 (red bars) indicate a higher risk of secondary animal than secondary plant extinction and values <0 (blue bars) indicate the opposite. Secondary animal versus secondary plant extinction was compared between climate change and random extinction using two-sided, pair-wise t-tests (+P<0.1; *P<0.05; **P<0.01). Here climatic projections of the models of species' vulnerability to climate change follow the RCP 8.5 scenario; results were identical for the RCP 6.0 scenario (see Supplementary Fig. 2).

References

    1. Dawson T. P., Jackson S. T., House J. I., Prentice I. C. & Mace G. M. Beyond predictions: biodiversity conservation in a changing climate. Science 332, 53–58 (2011). - PubMed
    1. Bellard C., Bertelsmeier C., Leadley P., Thuiller W. & Courchamp F. Impacts of climate change on the future of biodiversity. Ecol. Lett. 15, 365–377 (2012). - PMC - PubMed
    1. Blois J. L., Zarnetske P. L., Fitzpatrick M. C. & Finnegan S. Climate change and the past, present, and future of biotic interactions. Science 341, 499–504 (2013). - PubMed
    1. HilleRisLambers J., Harsch M. A., Ettinger A. K., Ford K. R. & Theobald E. J. How will biotic interactions influence climate change-induced range shifts? Ann. NY Acad. Sci. 1297, 112–125 (2013). - PubMed
    1. Brown J. H. On the relationship between abundance and distribution of species. Am. Nat. 124, 255–279 (1984).

Publication types