. 2016 Dec 23:6:38967.
doi: 10.1038/srep38967.

Acoustic micro-tapping for non-contact 4D imaging of tissue elasticity

Affiliations

Acoustic micro-tapping for non-contact 4D imaging of tissue elasticity

Łukasz Ambroziński et al. Sci Rep. .

Abstract

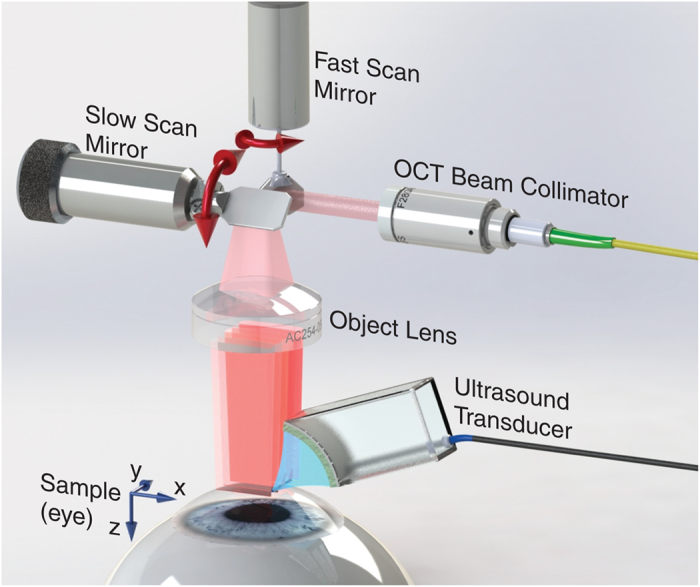
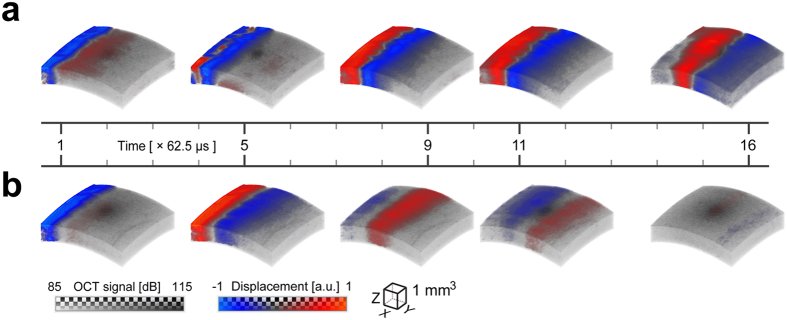
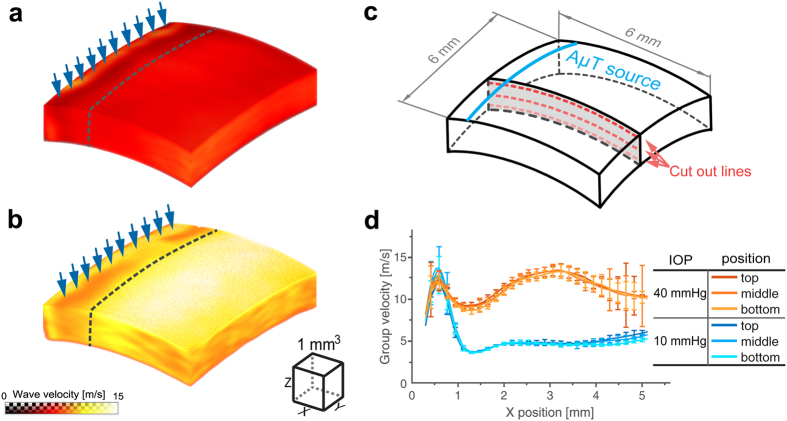
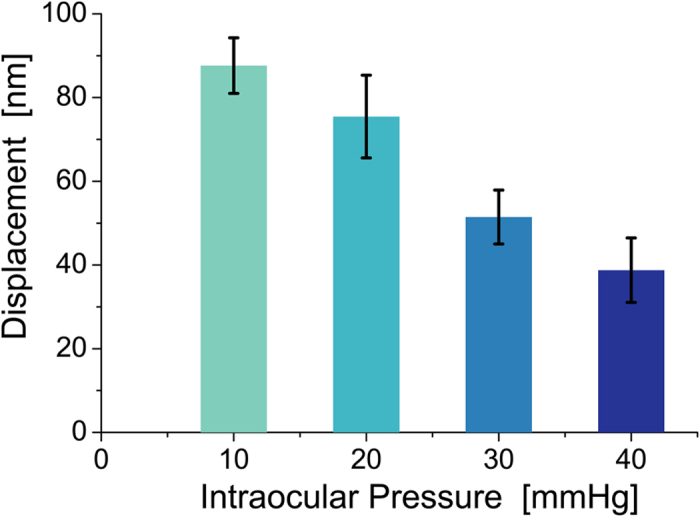
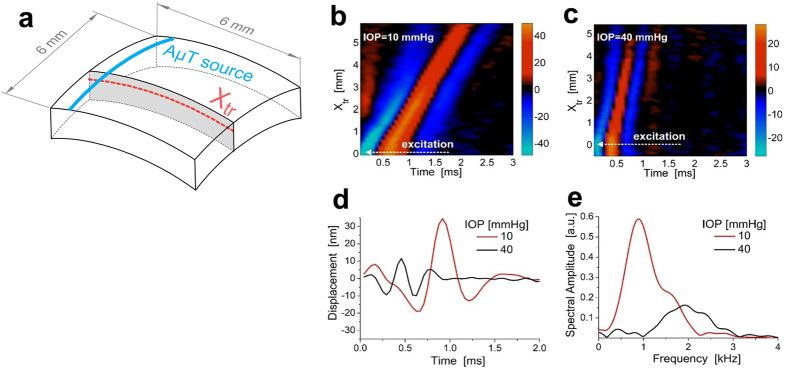
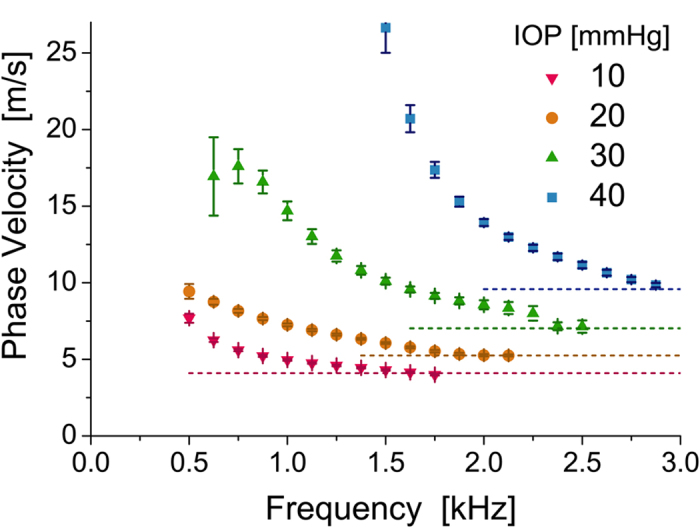
Elastography plays a key role in characterizing soft media such as biological tissue. Although this technology has found widespread use in both clinical diagnostics and basic science research, nearly all methods require direct physical contact with the object of interest and can even be invasive. For a number of applications, such as diagnostic measurements on the anterior segment of the eye, physical contact is not desired and may even be prohibited. Here we present a fundamentally new approach to dynamic elastography using non-contact mechanical stimulation of soft media with precise spatial and temporal shaping. We call it acoustic micro-tapping (AμT) because it employs focused, air-coupled ultrasound to induce significant mechanical displacement at the boundary of a soft material using reflection-based radiation force. Combining it with high-speed, four-dimensional (three space dimensions plus time) phase-sensitive optical coherence tomography creates a non-contact tool for high-resolution and quantitative dynamic elastography of soft tissue at near real-time imaging rates. The overall approach is demonstrated in ex-vivo porcine cornea.


Figures

Figure 1
Figure 1. Layout of acoustic micro-tapping and 4D PhS-OCT imaging system for soft tissue elastography.
A focused acoustic beam is launched in air with a home-made air-coupled piezoelectric transducer to form a strip acoustic intensity distribution at its focus near the air/medium interface (along Y-axis). The transducer is a cylindrical segment of a piezoelectric tube, 26 mm inner diameter and 30 mm outer diameter (cat. #42–1051, American Piezo International Ltd., Mackeyville, PA 17750 USA), with electrodes on both sides cut to an angle of 75 degrees and length of 9 mm. A matching layer (0.45 μm pore size nylon membrane filter, Cat. No. 7404-004, “GE Healthcare UK Limited”, Little Chalfont, UK) is glued with silicone to its front surface for efficient transfer of US into air at a carrier frequency of 1 MHz. The acoustic intensity field emitted by the transducer can be found in Supplementary Fig. S2. The transducer is tilted to the tissue normal by about 45 degrees to not block the OCT beam. Reflection of the acoustic beam from the air/medium interface produces significant ARF toward the medium, inducing a transient displacement at that surface (including a shear one) and ultimately generating a propagating mechanical wave in the lateral (transverse to the medium normal) direction. We call this effect acoustic micro-tapping (AμT). A 15,900 frame rate PhS-OCT system is used to track mechanical wave propagation with time. Repeated B-Scans are acquired on each imaging (XZ) plane for one AμT pulse, resulting in only 3 ms time to fully track mechanical wave propagation in a (XZ) plane in space and time. Rapid sweeping of the B-Scan plane to another Y position (for 102 different Y positions in total spaced 58.8 μm each other) is used to acquire the entire 4D data set of 102 imaging planes over a 6 × 6 mm lateral field of view in 0.3 s. One AμT firing is performed for a single B-scan. The procedure is repeated 10 times to improve the signal-to-noise ratio, resulting in 3 s total data acquisition time.
Figure 2
Figure 2. Transient displacement of a mechanical wave propagating in ex-vivo porcine eye.
A blue-red colormap is used to map the displacement interleaved with the gray-scale of the OCT amplitude image. The bottom of the colorbar indicates the voxel color and the top indicates the transparency applied to any voxel, on a checkerboard background. Five time instants of 3D transient displacement associated with mechanical wave propagation within an ex-vivo porcine eye are shown at two different intraocular pressures (a) – 10 mmHg, and (b) – 40 mmHg for propagation at 0°. The displacement amplitudes are normalized for both data sets by their maxima in the excitation area (62 nm and 34 nm, respectively). The sampling interval between volumes is 62.5 μs, and the time indexes of selected time instants are marked on the timeline. All time instants of wave propagation are shown in Supplementary Movie S3. As seen, the wave propagates much faster for 40 mmHg IOP. At this pressure, the wave already exits the region by the 16th time instant, but for the 10 mmHg case the wave is near the middle of the image area at the same instant.
Figure 3
Figure 3. Mechanical wave group velocity in ex-vivo porcine eye cornea.
3D maps at two different intraocular pressures (a) −10 mmHg, and (b) −40 mmHg for propagation at 0°. The group velocity is calculated at each point within the 6 mm × 6 mm lateral field of view using temporal profiles of recorded signals and the phase zero-crossing method applied to the cross-correlation function between neighboring signals with no averaging applied to recorded signals. To create the velocity maps, a moving average procedure is applied to the computed velocity distributions within an effective volume of 294 μm × 294 μm × 114 μm in X, Y and Z directions, respectively. The excitation line is indicated by blue arrows. The dashed line approximately indicates the near field region of wave propagation. Three lines are chosen for different depths of wave propagation in the cornea (close to the top surface, in the middle and close to the bottom of the cornea) as depicted in (c). Group velocity on these lines is plotted in (d) for both intraocular pressures. High fluctuations of group velocity at distances far from the AμT source are related with reduced signal-to-noise ratio in that region.
Figure 4
Figure 4. Amplitude of vertical displacement in the propagating mechanical wave versus intraocular pressure (IOP).
AμT source and area of OCT scanning were kept the same at all IOPs for propagation at 0°. Error bars indicate RMS fluctuations of displacement amplitude over the excitation area. As seen, the efficiency of AμT mechanical wave excitation decreases as intraocular pressure increases.
Figure 5
Figure 5. Time and spectral characteristics of the propagating mechanical wave.
Two dimensional maps of the temporal profiles (lateral coordinate along the trajectory shown in panel (a), Xtr, versus time, t) at a depth of about 0.1 mm from the surface in porcine eye cornea at different intraocular pressures: (b) −IOP = 10 mmHg, (c) −IOP = 40 mmHg for propagation at 0°. Typical temporal profiles of transverse mechanical waves (d) and their spectra (e). Decreased displacement amplitude and a shift of the carrier signal frequency to higher frequencies are observed with increased intraocular pressure.
Figure 6
Figure 6. Phase velocity dispersion in ex-vivo porcine eye cornea.
Temporal profiles of propagating mechanical waves and their subsequent Fourier transform can be used to calculate the velocity of different frequency components, i.e. phase velocity. The phase velocity shows a strong frequency dispersion in the low-frequency range due to the top and bottom boundaries of the cornea, and approaches a high-frequency limit (dashed lines) that differs at different intraocular pressures for propagation at 0°. The high-frequency threshold of phase velocity can be used to evaluate cornea elasticity.

References

    1. Ophir J., Céspedes I., Ponnekanti H., Yazdi Y. & Li X. Elastography: A quantitative method for imaging the elasticity of biological tissues. Ultrasonic Imaging 13, 111–134 (1991). - PubMed
    1. Nightingale K. R., Nightingale R. W., Palmeri M. L. & Trahey G. E. A finite element model of remote palpation of breast lesions using radiation force: Factors affecting tissue displacement. Ultrasonic Imaging 22, 35–54 (2000). - PubMed
    1. Sarvazyan A. P., Rudenko O. V., Swanson S. D., Fowlkes J. B. & Emelianov S. Y. Shear wave elasticity imaging: a new ultrasonic technology of medical diagnostics. Ultrasound in Medicine & Biology 24, 1419–1435 (1998). - PubMed
    1. Sandrin L., Tanter M., Catheline S. & Fink M. Shear modulus imaging with 2-D transient elastography. IEEE Transactions on Ultrasonics, Ferroelectrics and Frequency Control 49, 426–435 (2002). - PubMed
    1. O’Donnell M., Skovoroda A. R., Shapo B. M. & Emelianov S. Y. Internal displacement and strain imaging using ultrasonic speckle tracking. IEEE Transactions on Ultrasonics Ferroelectrics and Frequency Control 41, 314–325 (1994).

Publication types

MeSH terms