. 2016 Dec 23:6:39653.
doi: 10.1038/srep39653.

A rapid method for detecting protein-nucleic acid interactions by protein induced fluorescence enhancement

Affiliations

A rapid method for detecting protein-nucleic acid interactions by protein induced fluorescence enhancement

Sona Valuchova et al. Sci Rep. .

Abstract

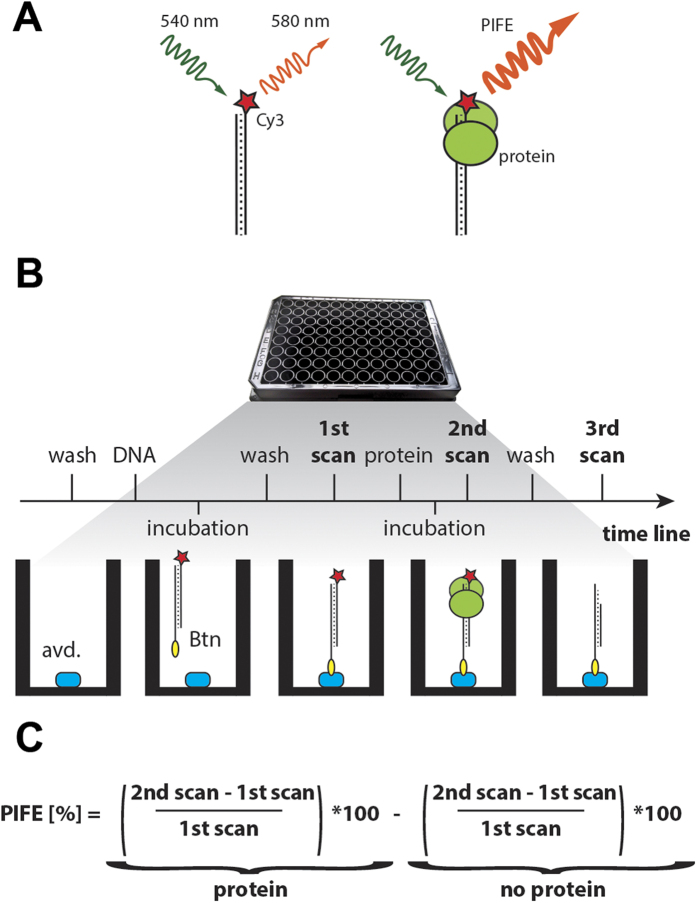
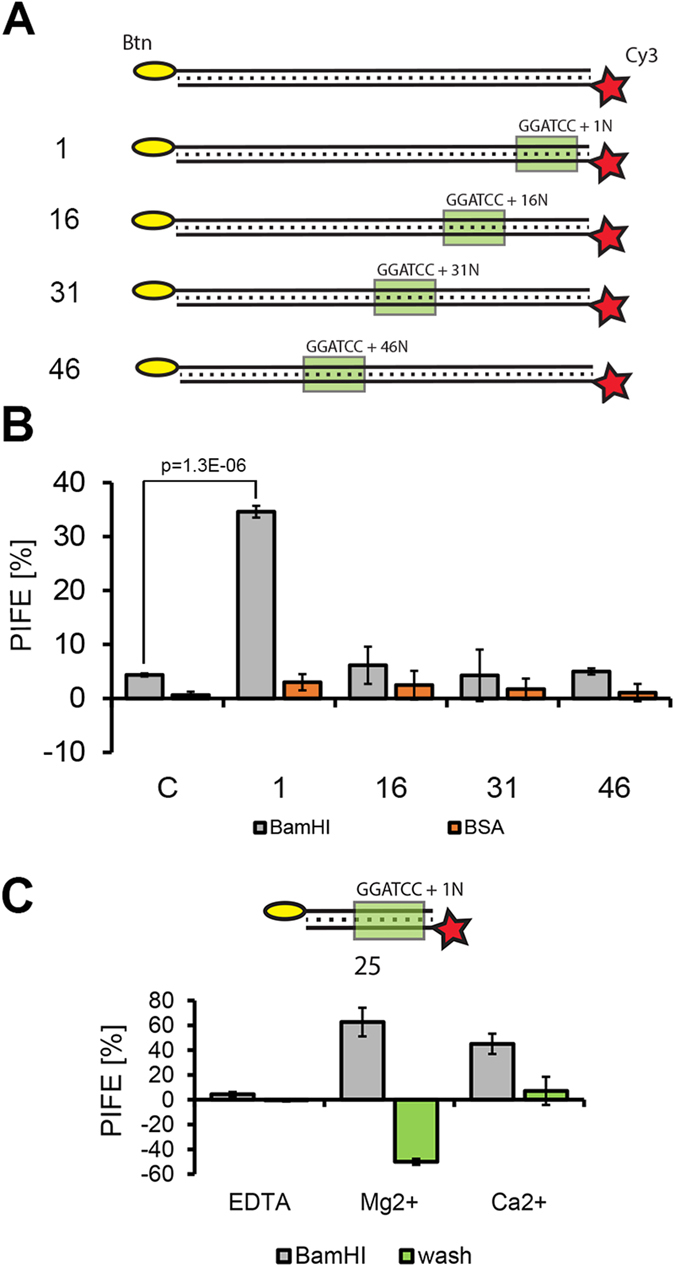
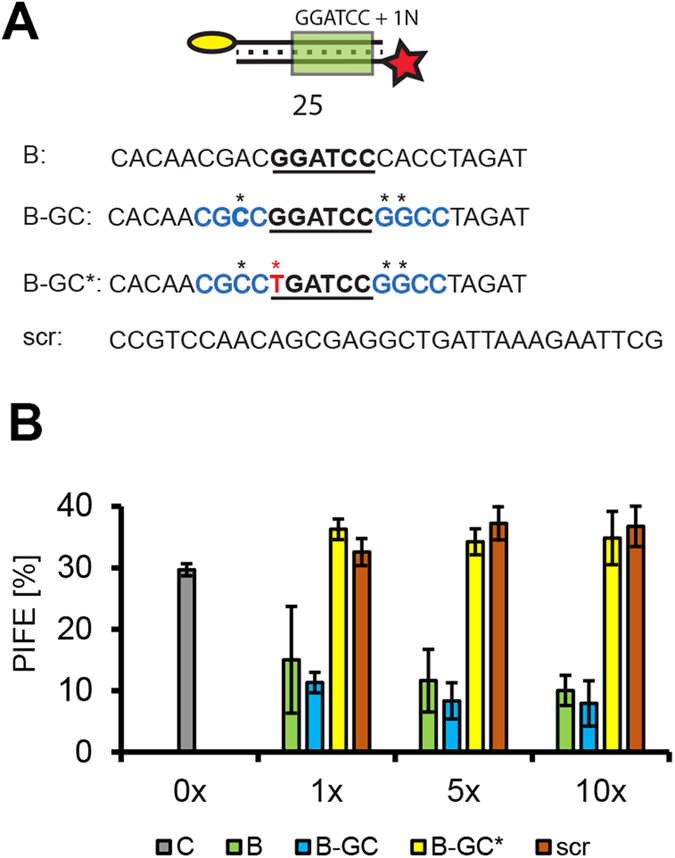
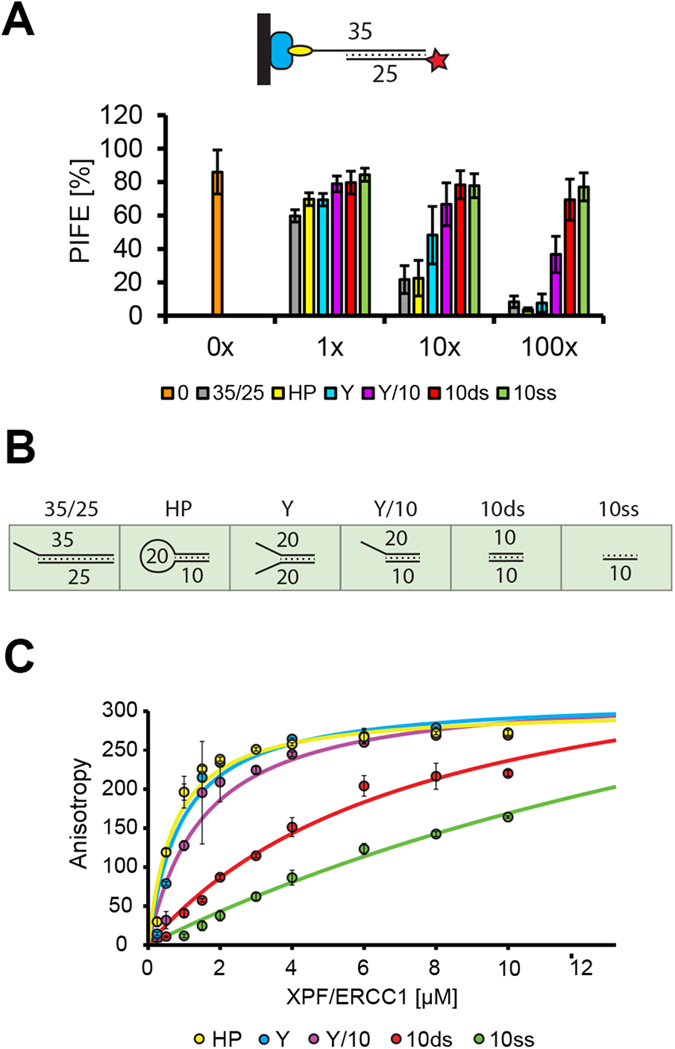
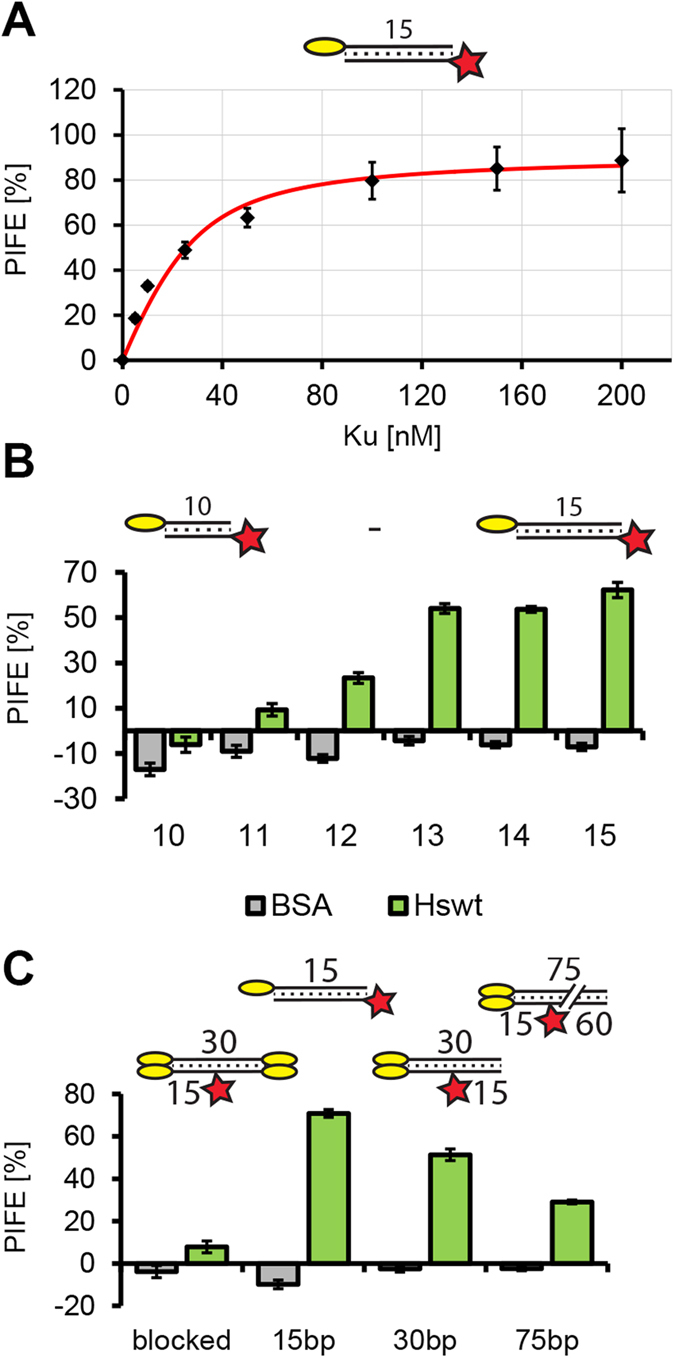
Many fundamental biological processes depend on intricate networks of interactions between proteins and nucleic acids and a quantitative description of these interactions is important for understanding cellular mechanisms governing DNA replication, transcription, or translation. Here we present a versatile method for rapid and quantitative assessment of protein/nucleic acid (NA) interactions. This method is based on protein induced fluorescence enhancement (PIFE), a phenomenon whereby protein binding increases the fluorescence of Cy3-like dyes. PIFE has mainly been used in single molecule studies to detect protein association with DNA or RNA. Here we applied PIFE for steady state quantification of protein/NA interactions by using microwell plate fluorescence readers (mwPIFE). We demonstrate the general applicability of mwPIFE for examining various aspects of protein/DNA interactions with examples from the restriction enzyme BamHI, and the DNA repair complexes Ku and XPF/ERCC1. These include determination of sequence and structure binding specificities, dissociation constants, detection of weak interactions, and the ability of a protein to translocate along DNA. mwPIFE represents an easy and high throughput method that does not require protein labeling and can be applied to a wide range of applications involving protein/NA interactions.


Figures

Figure 1
Figure 1. Detection of protein/NA association by mwPIFE.
(A) Binding of a protein in the physical vicinity of Cy3 leads to fluorescence enhancement. (B) Experimental workflow of mwPIFE. Neutravidin coated microwell plate is washed and biotinylated oligonucleotide is bound. The fluorescence of a bound oligonucleotide is measured with a fluorescence plate reader. After incubation with protein a second scan is performed. An optional washing step is followed by a third scan. (C) Formula used to calculate PIFE.
Figure 2
Figure 2. Detection of BamHI/DNA interaction by mwPIFE.
(A) Scheme of DNA probes for detecting BamHI binding. Position of the BamHI restriction site is indicated. (B) Normalized PIFE values obtained with different probes incubated with BSA or BamHI. Error bars indicate standard deviations from measurements of three independent wells. P value was calculated by two-tailed t-test. (C) Effect of divalent cations on BamHI binding and cleavage. A 25 bp oligonucleotide with the restriction site 1 bp from Cy3 was used as a probe. Chart shows normalized PIFE values obtained upon addition of BamHI and after the subsequent wash. Error bars indicate standard deviations from measurements of three independent wells.
Figure 3
Figure 3. Sequence specificity of BamHI binding.
(A) The DNA probe and competitors used in the experiment. (B) Different dsDNA competitors were added in 1–10x excess over labelled and immobilized DNA probe. PIFE was calculated after incubation with 50U of BamHI. Error bars indicate standard deviations from measurements of three independent wells.
Figure 4
Figure 4. Structure specific binding of XPF/ERCC1.
(A) Immobilized 35/25 bp DNA with terminal 5′ Cy3 was used as a probe. Different competitors were added in 1x, 10x, and 100x excess and PIFE values were calculated. Error bars indicate standard deviations from measurements of three independent wells. (B) Structure of different oligonucleotides used as competitors. Numbers indicate lengths of annealed oligonucleotides in nt. (C) Binding curves of XPF/ERCC1 to oligonucleotides used as competitors in panel (A) determined by fluorescence anisotropy. Each curve was constructed from 3 independent measurements. Calculated Kd values for each substrate are: HP (0.64 ± 0.1 μM), Y (0.81 ± 0.1 μM), Y/10 (1.32 ± 0.2 μM), 10ds (4.75 ± 0.8 μM), 10ss (8.65 ± 1.3 μM).
Figure 5
Figure 5. Analysis of Ku-DNA interaction by mwPIFE.
(A) The magnitude of mwPIFE depends on Ku concentration. A 15 bp duplex oligonucleotide with Cy3 at the free 5′end was used as a probe. The binding curve was reconstituted from 3 independent replicas with standard deviations indicated. (B) Minimal binding site of human Ku determined by mwPIFE with 10–15 bp oligonucleotides with 3′ terminal Cy3. Error bars indicate standard deviations from measurements of three independent wells. (C) Translocation of Ku estimated by mwPIFE using oligonucleotides with Cy3 at different positions from the DNA termini. Probes used in the experiment are indicated above the chart; numbers indicate length in nucleotides; Cy3 is shown as an asterisk. Normalized PIFE values represent averages form thee replicates. Standard deviations are indicated.

References

    1. Jolma A. et al. DNA-binding specificities of human transcription factors. Cell 152, 327–339, doi: 10.1016/j.cell.2012.12.009 (2013). - DOI - PubMed
    1. Hallikas O. et al. Genome-wide prediction of mammalian enhancers based on analysis of transcription-factor binding affinity. Cell 124, 47–59, doi: 10.1016/j.cell.2005.10.042 (2006). - DOI - PubMed
    1. Luscombe N. M., Laskowski R. A. & Thornton J. M. Amino acid-base interactions: a three-dimensional analysis of protein-DNA interactions at an atomic level. Nucleic Acids Res 29, 2860–2874 (2001). - PMC - PubMed
    1. Yap J. L. et al. Small-molecule inhibitors of dimeric transcription factors: Antagonism of protein-protein and protein-DNA interactions. Medchemcomm 3, 541–551, doi: 10.1039/c2md00289b (2012). - DOI
    1. Dey B. et al. DNA-protein interactions: methods for detection and analysis. Molecular and cellular biochemistry 365, 279–299, doi: 10.1007/s11010-012-1269-z (2012). - DOI - PubMed

Publication types