

Disentangling genetic and environmental risk factors for individual diseases from multiplex comorbidity networks
- PMID: 28008973
- PMCID: PMC5180180
- DOI: 10.1038/srep39658
Disentangling genetic and environmental risk factors for individual diseases from multiplex comorbidity networks
Abstract
Most disorders are caused by a combination of multiple genetic and/or environmental factors. If two diseases are caused by the same molecular mechanism, they tend to co-occur in patients. Here we provide a quantitative method to disentangle how much genetic or environmental risk factors contribute to the pathogenesis of 358 individual diseases, respectively. We pool data on genetic, pathway-based, and toxicogenomic disease-causing mechanisms with disease co-occurrence data obtained from almost two million patients. From this data we construct a multiplex network where nodes represent disorders that are connected by links that either represent phenotypic comorbidity of the patients or the involvement of a certain molecular mechanism. From the similarity of phenotypic and mechanism-based networks for each disorder we derive measure that allows us to quantify the relative importance of various molecular mechanisms for a given disease. We find that most diseases are dominated by genetic risk factors, while environmental influences prevail for disorders such as depressions, cancers, or dermatitis. Almost never we find that more than one type of mechanisms is involved in the pathogenesis of diseases.
Figures
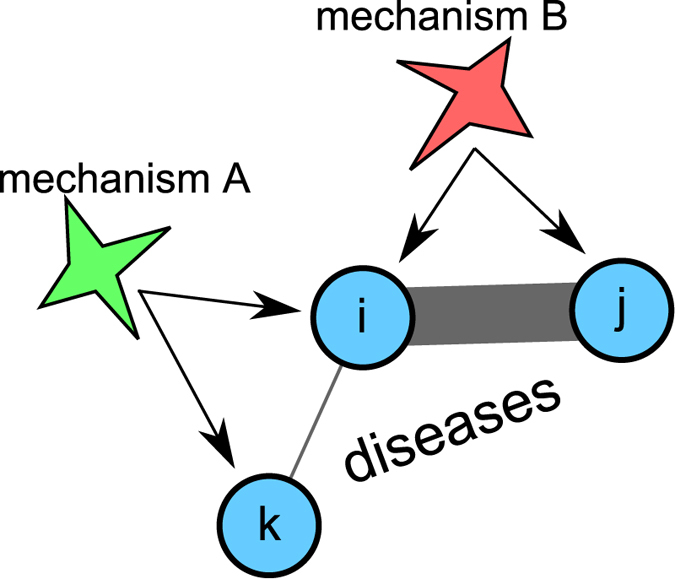
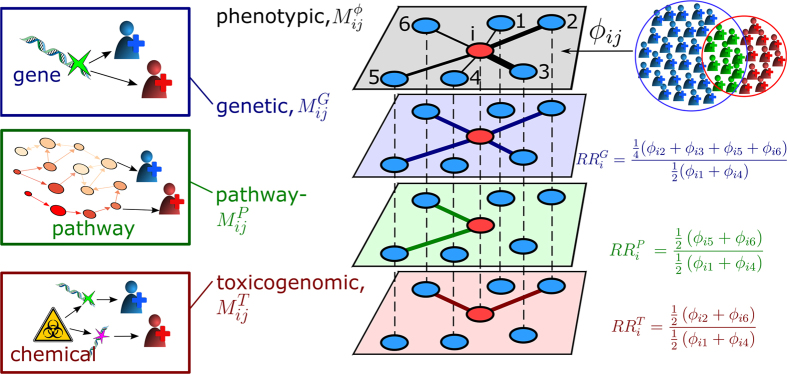
 , encodes phenotypic comorbidity relations. The link-weights in this layer are given by the comorbidity strengths ϕij that measure how often two diseases i and j co-occur within the same patients, i.e. the numbers of patients with either disease i (red individuals) or j (blue) are compared to the numbers of patients with both diseases (green). The second layer,
  , contains genetic comorbidities (blue links) where two different phenotypes (illustrated as blue and red individuals) are related to the same genetic defect or alteration. The third type of links are pathway-based comorbidities (green links), layer
  . Here, two different alterations occur in a pathway that is involved in two or more different diseases. Finally, the fourth layer,
  , is given by toxicogenomic comorbidities (red links), where a chemical substance is known to trigger different disease-causing mechanisms. Disorder i is shown as a red node in the HDMN, together with other phenotypes (blue nodes) that are in i’s neighborhood in at least one of the layers. The relative comorbidity risks
  measure to which extent shared disease-causing mechanisms between two diseases lead to their phenotypic comorbidity.
  is the average comorbidity strength of all neighbors of i in layer α, normalized to the average comorbidity strength over all phenotypes that share no disease-causing mechanism of any type with i. In the above example the greatest similarity to the phenotype network ϕij has obviously the genetic one,
  , and disease i is most likely of genetic origin.
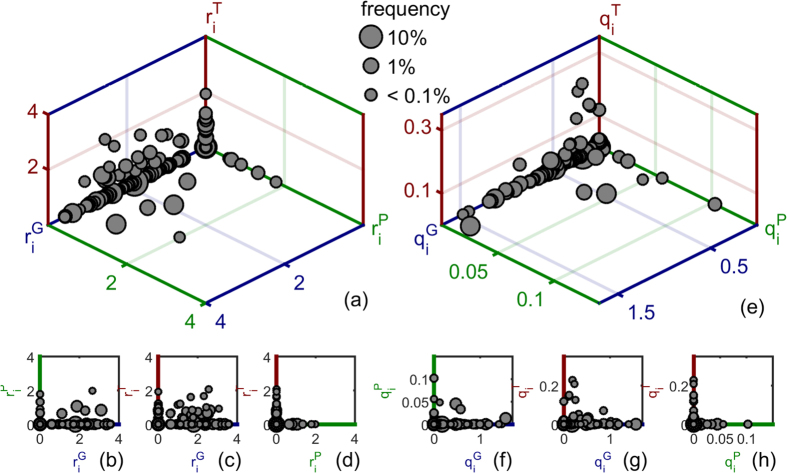
 and (e–h) their re-scaled versions,
  . Circle size is proportional to the number of disease occurrences. Re-scaling the risks by the degrees leads to almost perfect clustering of the diseases around one of the axes. The per-link contribution to the relative comorbidity risk is always dominated by one specific mechanism. Only a comparably small number of diseases cluster around the toxicogenomic axis. The comorbidity risks for most pathologies are dominated by genetic disease-causing mechanisms.
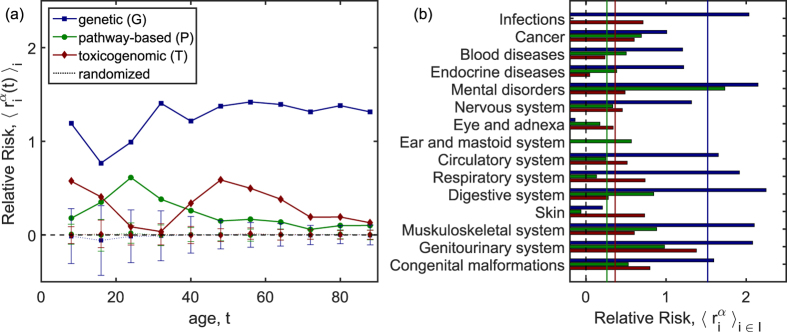
 , clearly exceed the pathway-based,
  , and toxicogenomic,
  , risks across all ages of patients. The results for all three types of mechanisms exceed their expectations from the randomization test (markers connected by dotted lines, error bars show the standard deviation over 5,000 randomizations). (b) Averages of the relative risks are shown for the chapters of the ICD10 classification, the solid vertical lines show the values of genetic (blue), pathway-based (green) and toxicogenomic (red) risks averaged over all diseases. Diseases of the digestive system, mental disorders, and infections show the highest genetically caused comorbidity risk, whereas cancers, diseases of the skin, eye, and ear show the lowest genetic risks. Pathway-based contributions are also highest for mental disorders and toxicogenomic contributions assume their maximum for diseases of the genitourinary system.
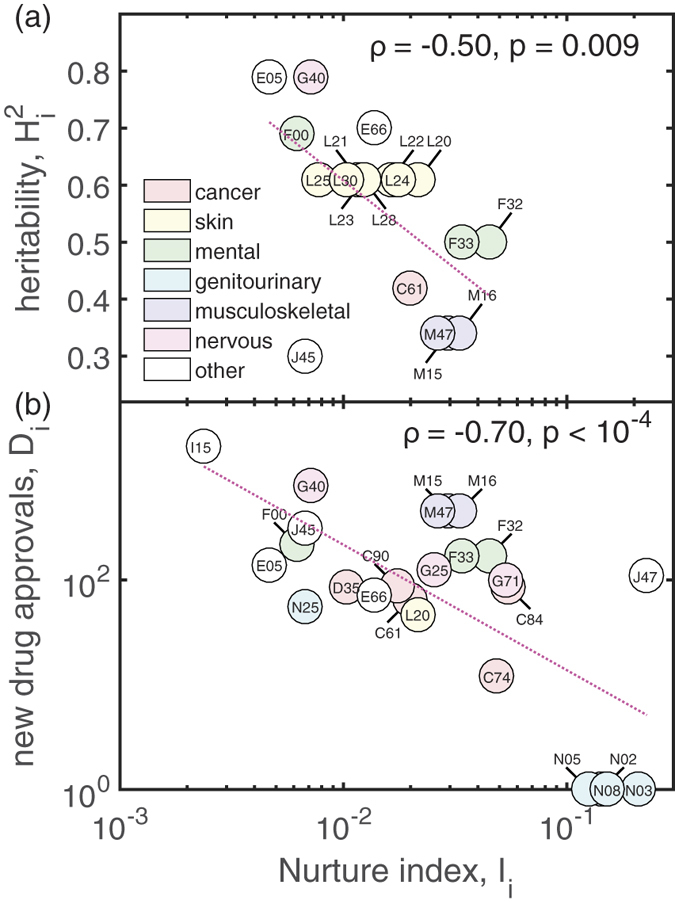
 , (a) and the number of newly developed drugs Di (b) are negatively correlated with the relevance of environmental risk factors for diseases. Each circle corresponds to one disease phenotype, labeled by its three-digit ICD10 code. Both,
  and Di are shown as a function of the nurture index. Colors indicate the main ICD chapter to which the diseases belong. We observe particularly high Ii values for diseases of the genitourinary system, various cancers, depression, and bronchiectasis.
References
Publication types
MeSH terms
LinkOut - more resources
Full Text Sources
Other Literature Sources
