

Circulating tumor cell detection in hepatocellular carcinoma based on karyoplasmic ratios using imaging flow cytometry
- PMID: 28009002
- PMCID: PMC5180239
- DOI: 10.1038/srep39808
Circulating tumor cell detection in hepatocellular carcinoma based on karyoplasmic ratios using imaging flow cytometry
Abstract
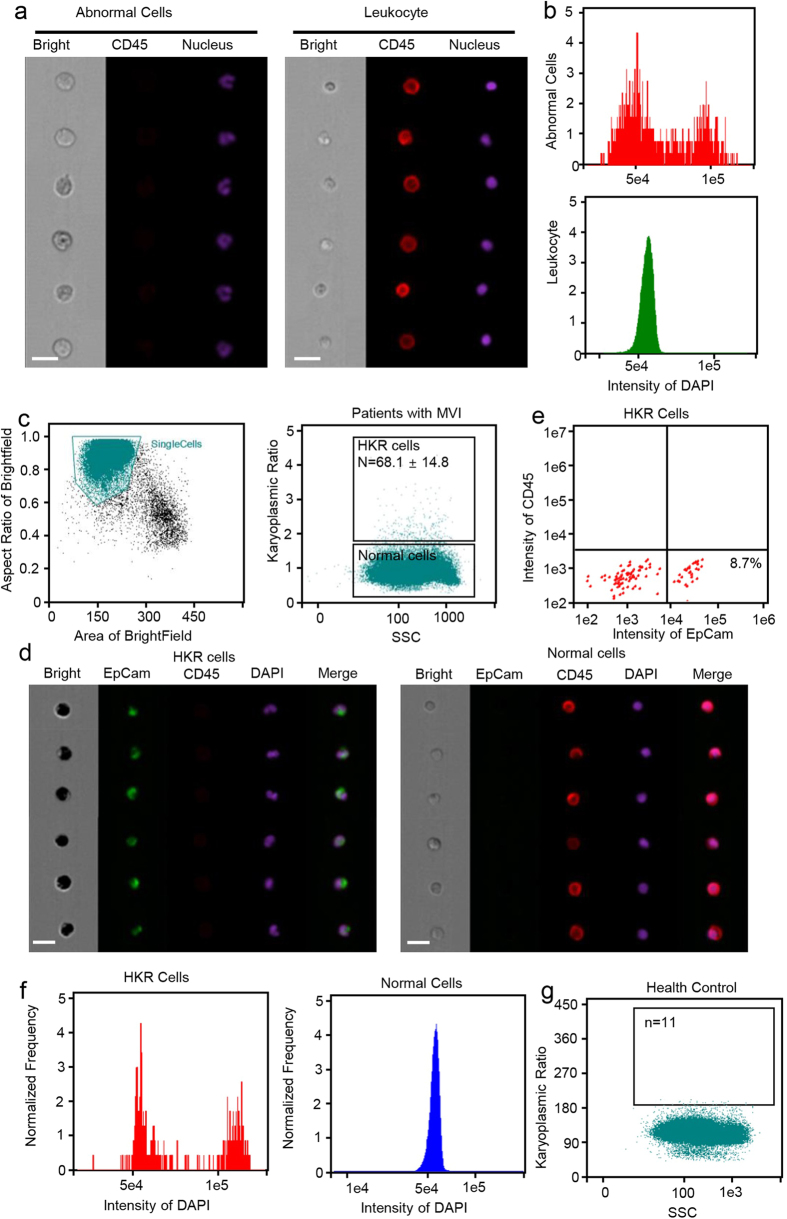
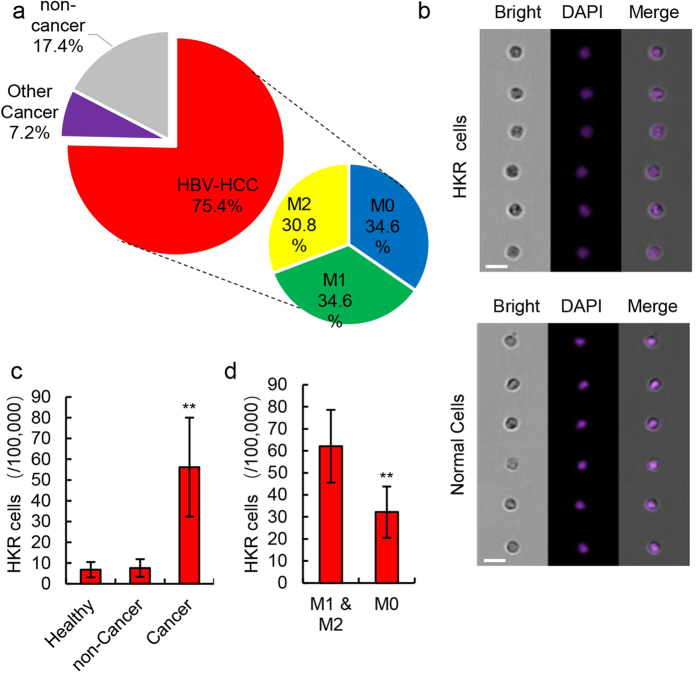
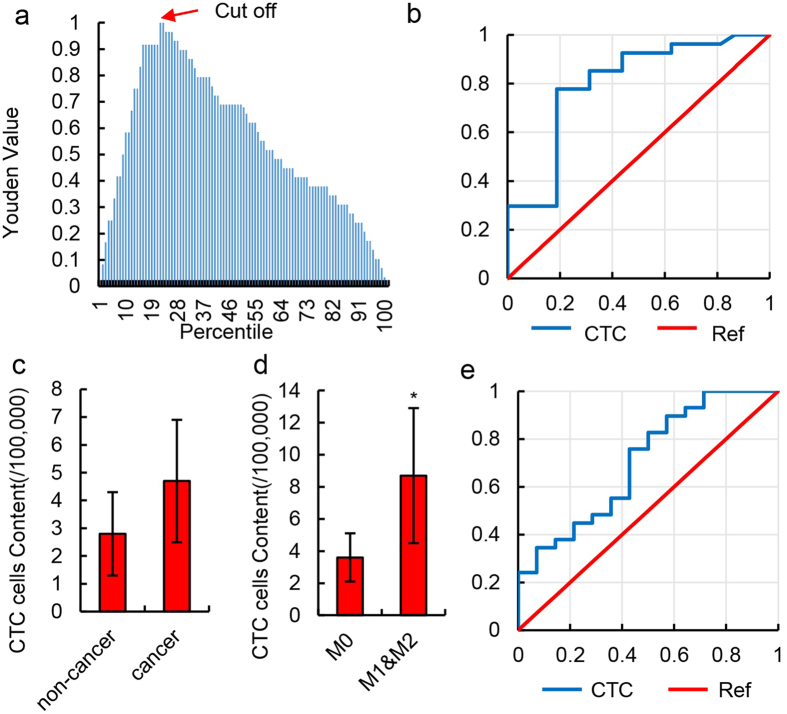
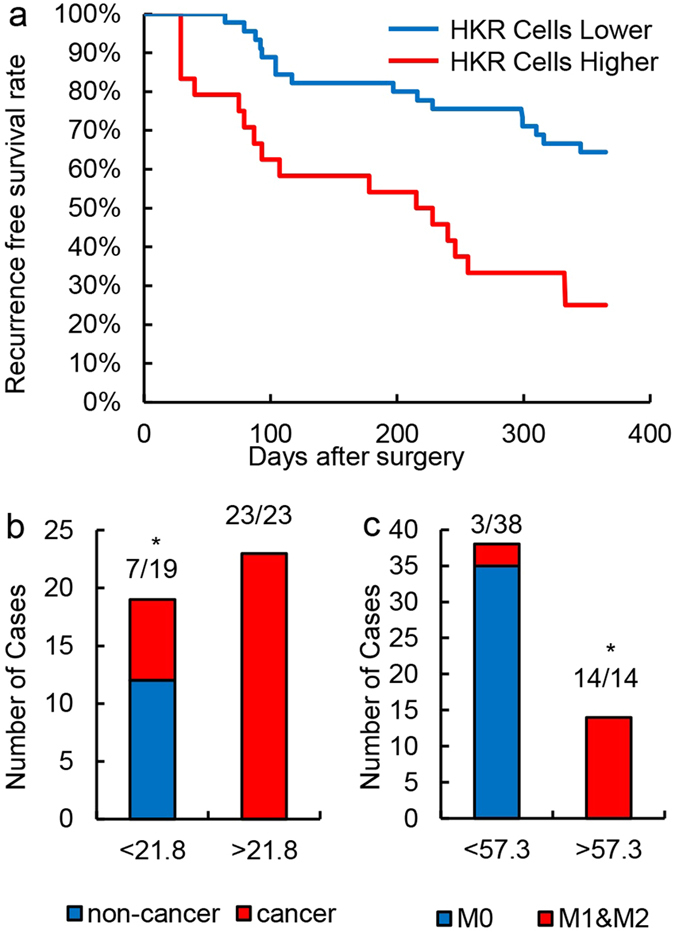
Circulating tumor cells (CTCs) originate from tumor tissues and are associated with cancer prognosis. However, existing technologies for CTC detection are limited owing to a lack of specific or accurate biomarkers. Here, we developed a new method for CTC detection based on the karyoplasmic ratio, without biomarkers. Consecutive patients with liver cancer or non-cancer liver diseases were recruited. CTCs in blood samples were analyzed by imaging flow cytometry based on the karyoplasmic ratio as well as EpCAM and CD45. Microvascular invasion (MVI), tumor recurrence, and survival were recorded for all patients. A total of 56.2 ± 23.8/100,000 cells with high karyoplasmic ratios (HKR cells) were detected in cancer patients, which was higher than the number of HKR cells in the non-cancer group (7.6 ± 2.2/100,000). There was also a difference in HKR cells between liver cancer patients with and without MVI. Based on a receiver operating characteristic curve analysis, the threshold was 21.8 HKR cells per 100,000 peripheral blood mononuclear cells, and the area under the curve was higher than those of traditional methods (e.g., CD45 and EpCAM staining). These results indicate that the new CTC detection method was more sensitive and reliable than existing methods. Accordingly, it may improve clinical CTC detection.
Figures
Similar articles
-
Presence of EpCAM-positive circulating tumor cells as biomarker for systemic disease strongly correlates to survival in patients with hepatocellular carcinoma.Int J Cancer. 2013 Nov;133(9):2165-71. doi: 10.1002/ijc.28230. Epub 2013 Jun 11. Int J Cancer. 2013. PMID: 23616258
-
Improved method increases sensitivity for circulating hepatocellular carcinoma cells.World J Gastroenterol. 2015 Mar 14;21(10):2918-25. doi: 10.3748/wjg.v21.i10.2918. World J Gastroenterol. 2015. PMID: 25780289 Free PMC article.
-
Detection of circulating tumor cells by reverse transcription‑quantitative polymerase chain reaction and magnetic activated cell sorting in the peripheral blood of patients with hepatocellular carcinoma.Mol Med Rep. 2017 Nov;16(5):5894-5900. doi: 10.3892/mmr.2017.7372. Epub 2017 Aug 28. Mol Med Rep. 2017. PMID: 28849093 Free PMC article.
-
Circulating tumor cells in hepatocellular carcinoma: detection techniques, clinical implications, and future perspectives.Semin Oncol. 2012 Aug;39(4):449-60. doi: 10.1053/j.seminoncol.2012.05.012. Semin Oncol. 2012. PMID: 22846862 Review.
-
[Disseminated and circulating tumor cells in gastrointestinal oncology].Bull Cancer. 2012 May;99(5):535-44. doi: 10.1684/bdc.2012.1581. Bull Cancer. 2012. PMID: 22531892 Review. French.
Cited by
-
Anthracycline Treatment and Left Atrial Function in Children: A Real-Time 3-Dimensional Echocardiographic Study.Pediatr Cardiol. 2022 Mar;43(3):645-654. doi: 10.1007/s00246-021-02769-w. Epub 2021 Nov 17. Pediatr Cardiol. 2022. PMID: 34787697
-
Liquid Biopsy in Hepatocellular Carcinoma: The Significance of Circulating Tumor Cells in Diagnosis, Prognosis, and Treatment Monitoring.Int J Mol Sci. 2023 Jun 26;24(13):10644. doi: 10.3390/ijms241310644. Int J Mol Sci. 2023. PMID: 37445822 Free PMC article. Review.
-
Clinical applications of liquid biopsy as prognostic and predictive biomarkers in hepatocellular carcinoma: circulating tumor cells and circulating tumor DNA.J Exp Clin Cancer Res. 2018 Sep 3;37(1):213. doi: 10.1186/s13046-018-0893-1. J Exp Clin Cancer Res. 2018. PMID: 30176913 Free PMC article. Review.
-
Establishment of an optimized CTC detection model consisting of EpCAM, MUC1 and WT1 in epithelial ovarian cancer and its correlation with clinical characteristics.Chin J Cancer Res. 2022 Apr 30;34(2):95-108. doi: 10.21147/j.issn.1000-9604.2022.02.04. Chin J Cancer Res. 2022. PMID: 35685992 Free PMC article.
-
Circulating tumor cells as a potential biomarker for postoperative clinical outcome in HBV-related hepatocellular carcinoma.Cancer Manag Res. 2018 Nov 15;10:5639-5647. doi: 10.2147/CMAR.S175489. eCollection 2018. Cancer Manag Res. 2018. PMID: 30532586 Free PMC article.
References
-
- Krebs M. G. et al.. Molecular analysis of circulating tumour cells—biology and biomarkers. Nat. Rev. Clin. Oncol. 11, 129–144 (2014). - PubMed
-
- Alix-Panabieres C. & Pantel K. Circulating tumor cells: liquid biopsy of cancer. Clin. Chem. 59, 110–118 (2013). - PubMed
-
- Zhang Y. et al.. Circulating tumor cells in hepatocellular carcinoma: detection techniques, clinical implications, and future perspectives. Sem. Oncol. 39, 449–460 (2012). - PubMed
-
- Alix-Panabieres C. & Pantel K. Challenges in circulating tumour cell research. Nat. Rev. Cancer. 14, 623–631 (2014). - PubMed
Publication types
MeSH terms
LinkOut - more resources
Full Text Sources
Other Literature Sources
Medical
Research Materials
Miscellaneous
