. 2017 Feb;81(2):212-226.
doi: 10.1002/ana.24846.

Cytokine therapy-mediated neuroprotection in a Friedreich's ataxia mouse model

Affiliations

Cytokine therapy-mediated neuroprotection in a Friedreich's ataxia mouse model

Kevin C Kemp et al. Ann Neurol. 2017 Feb.

Abstract

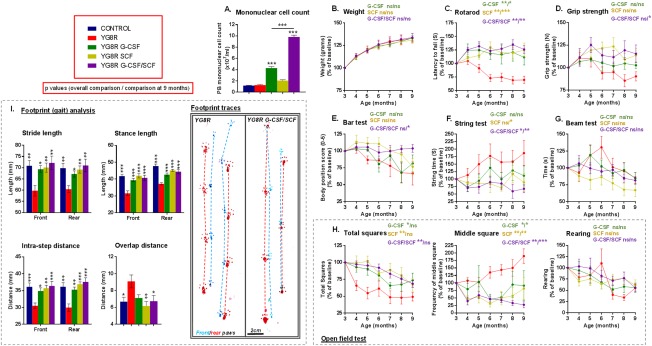
Objectives: Friedreich's ataxia is a devastating neurological disease currently lacking any proven treatment. We studied the neuroprotective effects of the cytokines, granulocyte-colony stimulating factor (G-CSF) and stem cell factor (SCF) in a humanized murine model of Friedreich's ataxia.

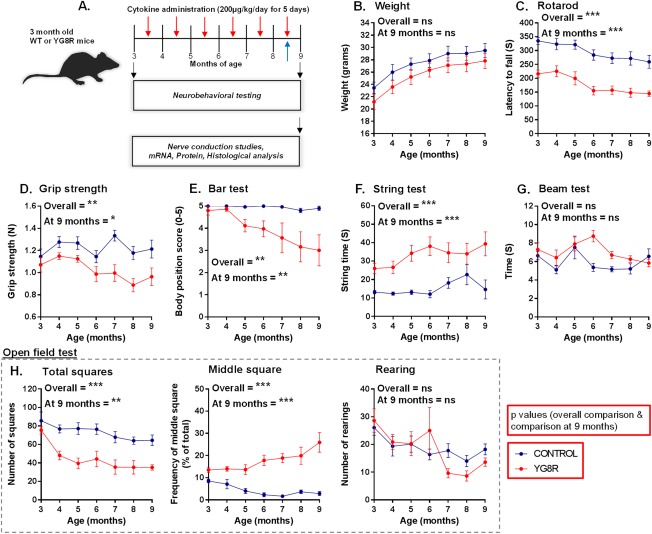
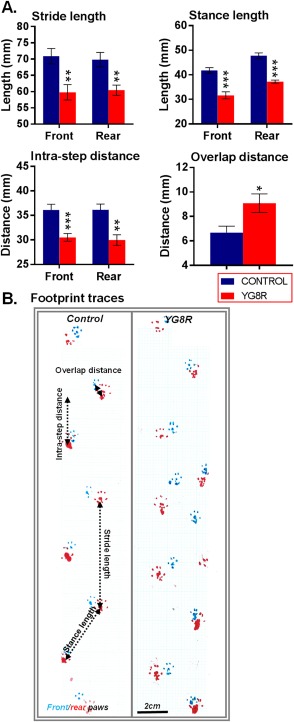
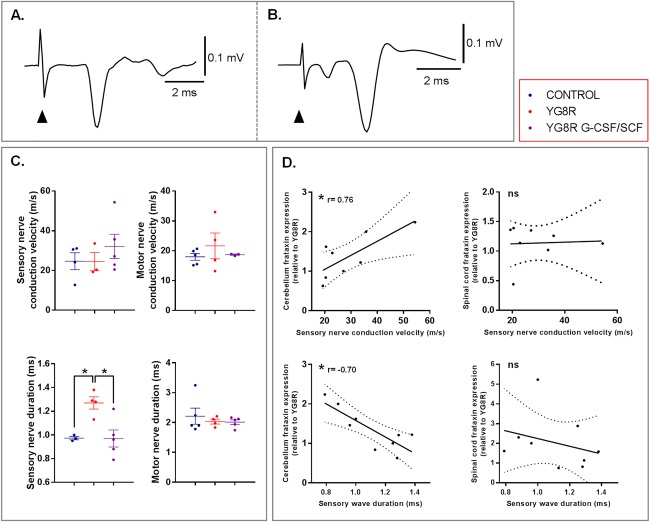
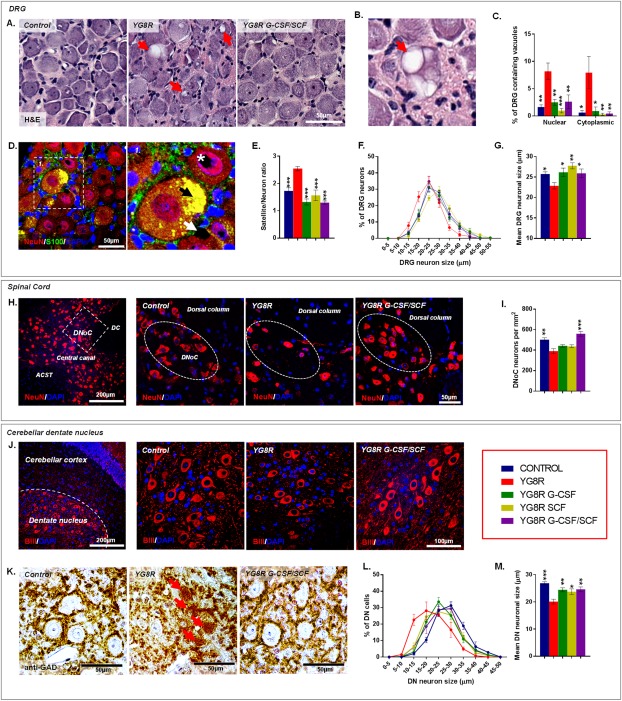
Methods: Mice received monthly subcutaneous infusions of cytokines while also being assessed at monthly time points using an extensive range of behavioral motor performance tests. After 6 months of treatment, neurophysiological evaluation of both sensory and motor nerve conduction was performed. Subsequently, mice were sacrificed for messenger RNA, protein, and histological analysis of the dorsal root ganglia, spinal cord, and cerebellum.

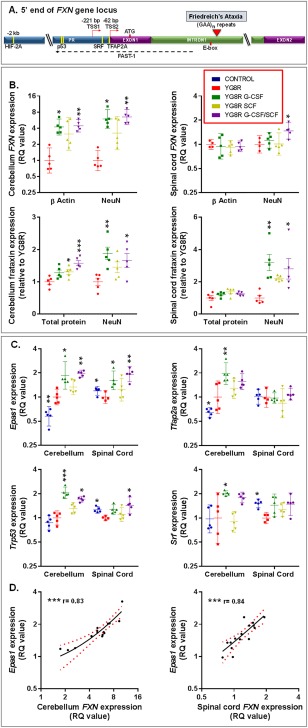
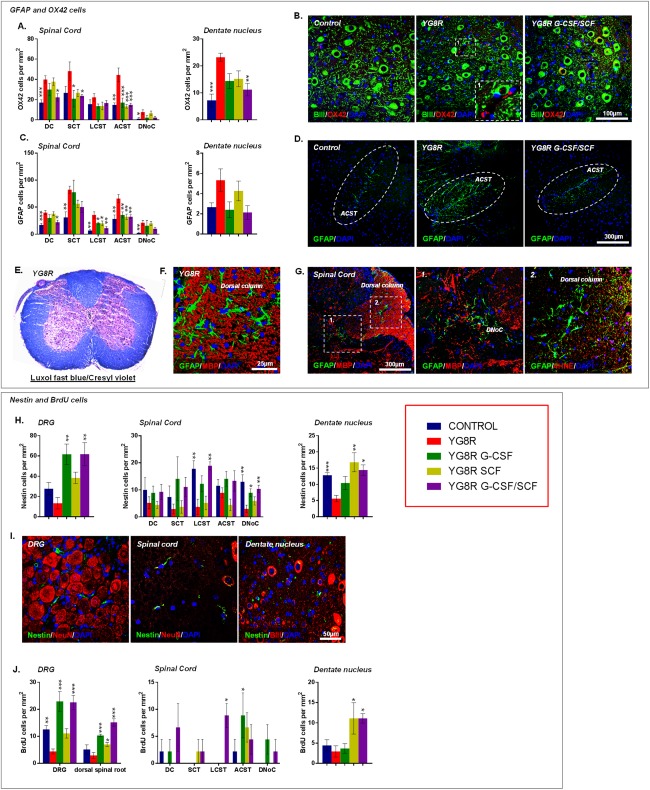
Results: Cytokine administration resulted in significant reversal of biochemical, neuropathological, neurophysiological, and behavioural deficits associated with Friedreich's ataxia. Both G-CSF and SCF had pronounced effects on frataxin levels (the primary molecular defect in the pathogenesis of the disease) and a regulators of frataxin expression. Sustained improvements in motor coordination and locomotor activity were observed, even after onset of neurological symptoms. Treatment also restored the duration of sensory nerve compound potentials. Improvements in peripheral nerve conduction positively correlated with cytokine-induced increases in frataxin expression, providing a link between increases in frataxin and neurophysiological function. Abrogation of disease-related pathology was also evident, with reductions in inflammation/gliosis and increased neural stem cell numbers in areas of tissue injury.

Interpretation: These experiments show that cytokines already clinically used in other conditions offer the prospect of a novel, rapidly translatable, disease-modifying, and neuroprotective treatment for Friedreich's ataxia. Ann Neurol 2017;81:212-226.


Figures

Figure 1
Figure 1
Neurological deficits in YG8R mice that carry a human genomic FXN transgene containing expanded GAA repeats of 82 to 190 units within intron 1 of FXN. (A) Experimental protocol using wild‐type controls (WT) and YG8R mice to investigate the effects of cytokine administration on disease phenotype. Mice received monthly infusions of cytokines (red arrows) while also being assessed at monthly time points using an extensive range of behavioral performance tests. Bromodeoxyuridine was also administered during the last round of cytokine treatment (blue arrow). At 9 months of age, neurophysiological evaluation of both sensory and motor nerve conduction was performed. Subsequently, mice were sacrificed for mRNA, protein, and histological analysis. Comparisons between WT‐control and untreated YG8R mice: longitudinal results for (B) weight; (C–G) motor performance; and (H) locomotor performance (open field test) in mice from 3 to 9 months of age. Repeated measures two‐way analysis of variance was applied for all behavioral studies. *p < 0.05;**p < 0.01; ***p < 0.001; values represent means ± standard error of the mean. For all tests, n = 10 (5 female and 5 male) per genotype. mRNA = messenger RNA; ns = not significant.
Figure 2
Figure 2
YG8R mice show gait abnormalities. Comparisons between WT‐control and untreated YG8R mice: (A) footprint (gait) analysis and (B) representative footprint traces in mice 9 months of age. The unpaired t test was applied for all analysis. *p < 0.05; **p < 0.01; ***p < 0.001; values represent means ± standard error of the mean. For all tests, n = 10 (5 female and 5 male) per genotype. WT = wild type.
Figure 3
Figure 3
Treatment with G‐CSF and/or SCF improves both motor and locomotor performance in YG8R mice. (A) The peripheral blood MNC counts of WT control and YG8R mice subcutaneously injected with G‐CSF and/or SCF dissolved in PBS (200 μg/kg body weight daily for 5 consecutive days). Longitudinal results for (B) weight; (C–G) motor performance; (H) locomotor performance (open field test); and (I) gait analysis in YG8R mice treated with G‐CSF and/or SCF from 3 to 9 months of age. All statistical comparisons are versus YG8R mice using either the unpaired t test, one‐way or repeated measures two‐way analysis of variance, followed by Dunnett's multiple comparison test. *p < 0.05; **p < 0.01; ***p < 0.001; values represent means ± standard error of the mean. For all neurobehavioral tests, n = 10 (5 female and 5 male) per genotype. G‐CSF = granulocyte colony‐stimulating factor; MNC = mononuclear cell; ns = not significant; PBS = phosphate‐buffered saline; SCF = stem cell factor; WT = wild type.
Figure 4
Figure 4
Both frataxin and regulatory factors implicated in controlling frataxin transcription are elevated in the cerebellum and spinal cord of YG8R mice treated with G‐CSF and/or SCF. (A) A schematic of the 5’ end of the human frataxin (FXN) gene showing approximate locations of the binding sites (yellow bars) for HIF‐2A, SRF, TFAP2A, and p53 in human or murine cells. The locations of the promotor (PR), Exon1, Exon2, and Intron1 regions are depicted. Different transcription start sites (TSS1 and TSS2) are shown upstream of Exon1, which holds the ATG translation start site. The directions of transcription for FXN (red arrows) and FXN antisense transcript (FAST‐1; dashed black arrow) are shown. The red triangle indicates the site of the trinucleotide GAA repeat expansion within intron 1 of FXN gene of patients with Friedreich's ataxia. The relative (B) mRNA and protein expression levels of frataxin within the cerebellum and spinal cord of YG8R mice (normalized to NeuN or β actin); (C) mRNA expression levels of transcription factors implicated in controlling frataxin expression Epas1, Srf, Tfap2a, and Trp53 (normalized to NeuN). (D) Correlation and linear regression analysis of FXN and Epas1 mRNA levels (normalized to NeuN) in the spinal cord and cerebellum of treated YG8R mice (lines of best fit and 95% confidence interval [CI] are depicted); r = Spearman's correlation coefficient. All statistical comparisons are versus YG8R mice. Comparisons between control and untreated YG8R mice were analyzed using unpaired t tests or Mann–Whitney U tests. For all other analyses, either one‐way analysis of variance followed by Dunnett's multiple comparison test or Kruskal‐Wallis followed by Dunn's multiple comparison test was applied. *p < 0.05; **p < 0.01; ***p < 0.001. For mRNA and protein expression, values represent the geometric means ± 95% CI and means ± standard error of the mean, respectively, relative to values in untreated YG8R mice. For all tests, n = 4 or 5 per genotype. mRNA = messenger RNA; NeuN = neuronal nuclear antigen; RQ = relative quantities.
Figure 5
Figure 5
Neurophysiological deficits of the sensory nerve pathway are restored in YG8R mice treated with a combination of G‐CSF and SCF. (A) Sensory compound nerve recording from the proximal tail after stimulation at the tail tip. (B) Motor compound nerve recording from the distal tail after stimulation of the proximal tail. The first small negative wave is attributed to antidromic activation of sensory fibers. (A and B) Responses are an average of 10 trials and from control animals. Arrowhead indicates onset of the electrical stimulation. (C) Peak conduction velocities and durations of sensory and motor responses recorded from tails of wild‐type controls, untreated YG8R mice, and YG8R mice treated with combined G‐CSF/SCF. (D) Correlation and linear regression analysis of frataxin protein levels (normalized to NeuN) in the spinal cord and cerebellum of for untreated and treated YG8R mice with either sensory nerve conduction velocity or wave duration (lines of best fit and 95% confidence interval are depicted). All statistical comparisons are versus YG8R mice. One‐way analysis of variance, followed by Dunnett's multiple comparison test, was applied for all analyses. *p < 0.05; values represent means ± standard error of the mean. Spearman's correlation was used to analyze relationships between frataxin and sensory nerve conduction velocity or wave duration. r = correlation coefficient. G‐CSF = granulocyte colony‐stimulating factor; NeuN = neuronal nuclear antigen; ns = not significant; SCF = stem cell factor.
Figure 6
Figure 6
G‐CSF and SCF administration improves Friedreich's ataxia–associated pathology. (A) Hematoxylin and eosin–stained DRG depicting reductions in vacuolization (red arrows) of large sensory neurons within YG8R mice treated with G‐CSF/SCF. (B) High‐powered image of a DRG neuron showing significant vacuolisation (red arrow). (C) Frequency of DRG neurons containing nuclear or cytoplasmic vacuoles. (D) DRG sections labeled with NeuN and S100 showing autofluorescent lipofuscin (black arrow) and both intranuclear (white asterisk) and intracytoplasmic (white arrow) vacuolization. (E) DRG satellite‐to‐neuron cell ratio, (F) size range, and (G) mean cell size (diameter) of DRG neurons. (H) Images and (I) numbers of NeuN‐labeled neurons within the DNoC of YG8R mice treated with G‐CSF/SCF. (J) Images of beta‐3 tubulin‐expressing neurons and (K) grumose‐type GAD‐positive intracytoplasmic labeling pattern in and around the large neuronal cell bodies within the cerebellar dentate nucleus of control and YG8R mice. (L) Size range and (M) mean cell size (diameter) of beta‐3 tubulin‐labeled neurons within the cerebellar dentate nucleus. Comparisons between WT‐control and YG8R mice were compared using the unpaired t test. All other statistical comparisons are versus YG8R mice using either one‐way analysis of variance followed by Dunnett's multiple comparison test or Kruskal‐Wallis followed by Dunn's multiple comparison test. *p < 0.05; **p < 0.01; ***p < 0.001; values represent means ± standard error of the mean. For all tests, n = 5 per genotype. ACST = anterior corticospinal tract; BIII = beta‐3 tubulin; DAPI = 4',6‐diamidino‐2‐phenylindole; DC = dorsal column; DN = cerebellar dentate nucleus; DNoC = dorsal nucleus of Clarke; DRG = dorsal root ganglia; GAD = glutamate decarboxylase; G‐CSF = granulocyte colony‐stimulating factor; H&E = hematoxylin and eosin; NeuN = neuronal nuclear antigen; SCF = stem cell factor.
Figure 7
Figure 7
G‐CSF and SCF administration reduces glial/immune cell infiltration while stimulating the recruitment of neural precursors to areas of tissue injury. Numbers of (A) OX42‐ and (C) GFAP‐positive cells within the spinal cord and cerebellar dentate nucleus. (B) Cerebellar sections depicting levels of OX42‐positive cells in the cerebellar dentate nucleus. (D) Spinal cord sections depicting levels of GFAP‐positive cells within the spinal cord anterior corticospinal tract. Astrocytosis without loss of spinal cord white matter in YG8R mice observed using (E) Luxol fast blue/cresyl violet staining and (F) MBP‐dual immunolabeling with GFAP. (G) Spinal cord sections immunolabeled with GFAP and either MBP or 4‐HNE, exhibiting astrocytosis, in both the white and gray matter, associated with 4‐HNE accumulation. (H) Nestin cells/mm2 and (I) images of nestin‐positive cells within DRG, spinal cord, and cerebellar dentate nucleus. (J) BrdU cells/mm2 within DRG, spinal cord, and cerebellar dentate nucleus. Dorsal column (DC), spinocerebellar tract (SCT), lateral corticospinal tract (LCST), anterior corticospinal tract (ACST), and dorsal nucleus of Clarke (DNoC). Comparisons between WT‐control and YG8R mice were compared using the unpaired t test. All other statistical comparisons are versus YG8R mice using either one‐way analysis of variance followed by Dunnett's multiple comparison test or Kruskal‐Wallis followed by Dunn's multiple comparison test. *p < 0.05; **p < 0.01; ***p < 0.001; values represent means ± standard error of the mean. For all tests, n = 5 per genotype. 4‐HNE = 4‐hydroxynonenal; BIII = beta‐3 tubulin; BrdU = bromodeoxyuridine; DAPI = 4′,6‐diamidino‐2‐phenylindole; DRG = dorsal root ganglia; G‐CSF = granulocyte colony‐stimulating factor; GFAP = glial fibrillary acidic protein; MBP = myelin basic protein; NeuN = neuronal nuclear antigen; SCF = stem cell factor; WT = wild type.

Similar articles

Cited by

References

    1. Koeppen AH. Friedreich's ataxia: pathology, pathogenesis, and molecular genetics. J Neurol Sci 2011;303:1–12. - PMC - PubMed
    1. Harding AE. Friedreich's ataxia: a clinical and genetic study of 90 families with an analysis of early diagnostic criteria and intrafamilial clustering of clinical features. Brain 1981;104:589–620. - PubMed
    1. Campuzano V, Montermini L, Molto MD, et al. Friedreich's ataxia: autosomal recessive disease caused by an intronic GAA triplet repeat expansion. Science 1996;271:1423–1427. - PubMed
    1. Bidichandani SI, Ashizawa T, Patel PI. The GAA triplet‐repeat expansion in Friedreich ataxia interferes with transcription and may be associated with an unusual DNA structure. Am J Hum Genet 1998;62:111–121. - PMC - PubMed
    1. Campuzano V, Montermini L, Lutz Y, et al. Frataxin is reduced in Friedreich ataxia patients and is associated with mitochondrial membranes. Hum Mol Genet 1997;6:1771–1780. - PubMed

MeSH terms

Substances