. 2016 Dec 23:5:e18566.
doi: 10.7554/eLife.18566.

Interneuronal mechanisms of hippocampal theta oscillations in a full-scale model of the rodent CA1 circuit

Affiliations

Interneuronal mechanisms of hippocampal theta oscillations in a full-scale model of the rodent CA1 circuit

Marianne J Bezaire et al. Elife. .

Abstract

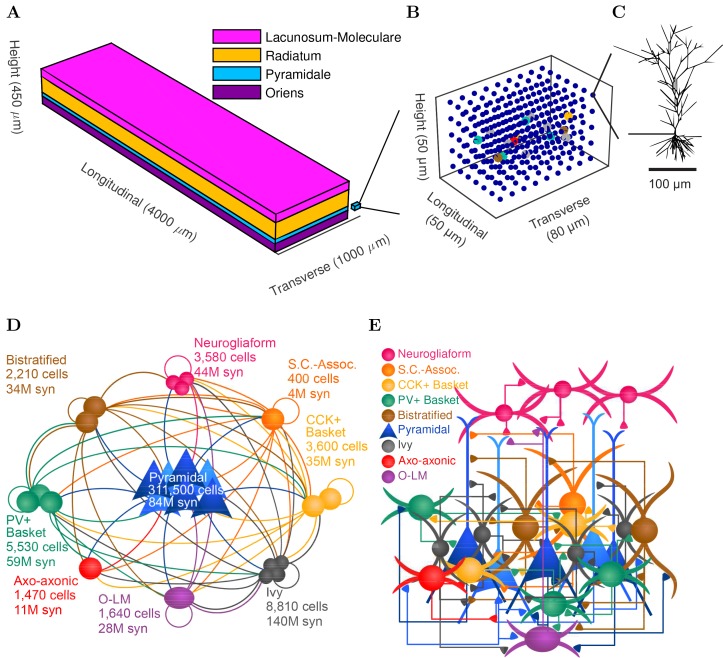
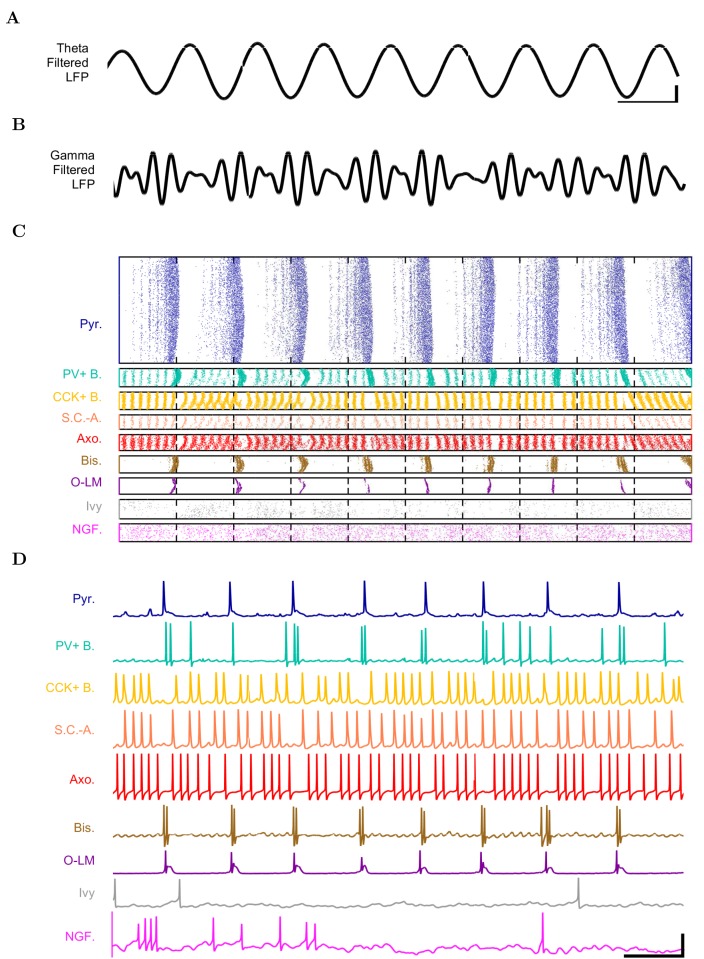
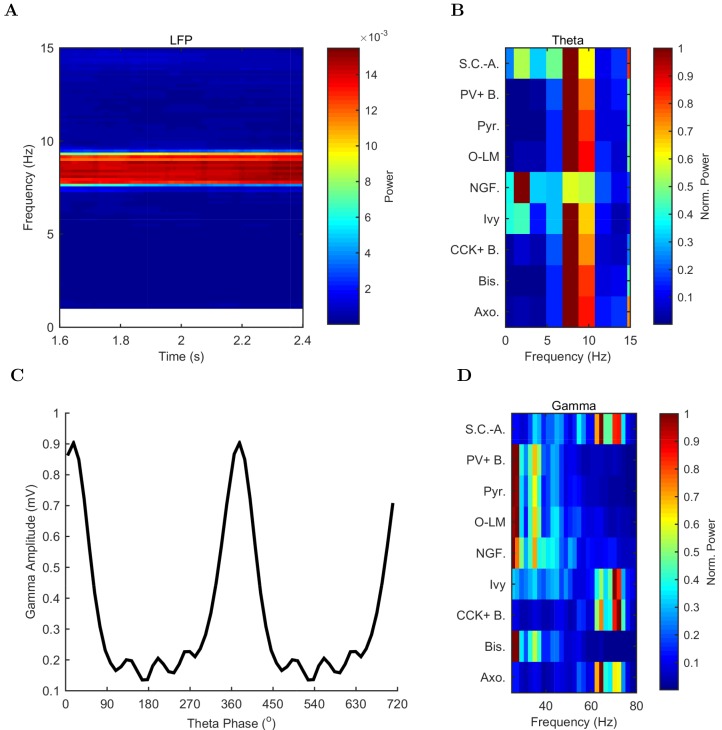
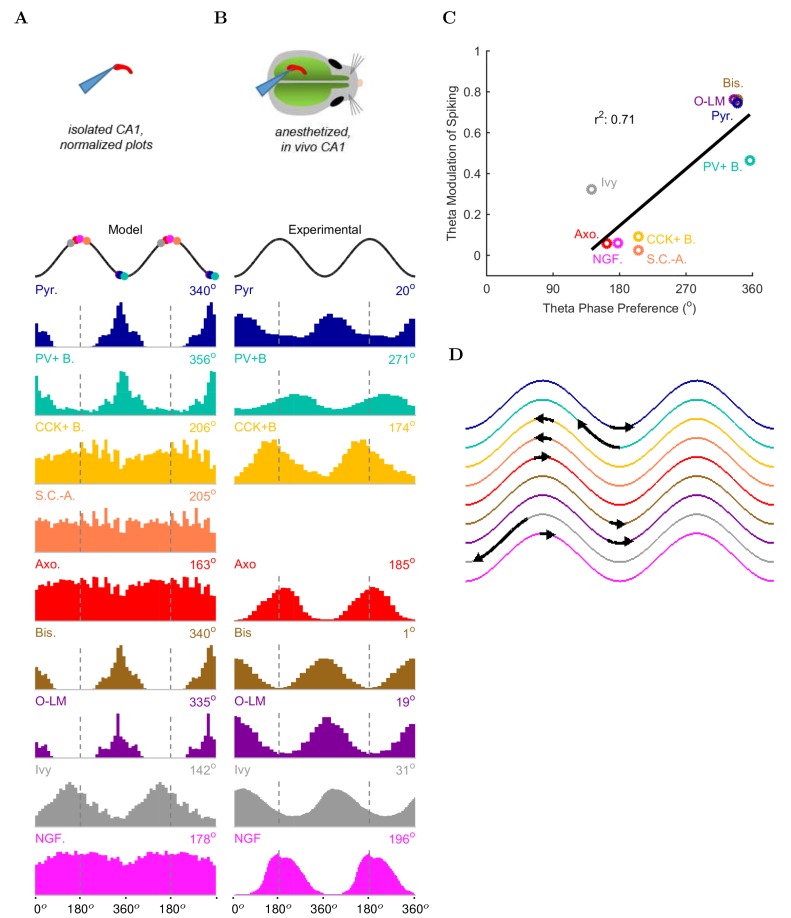
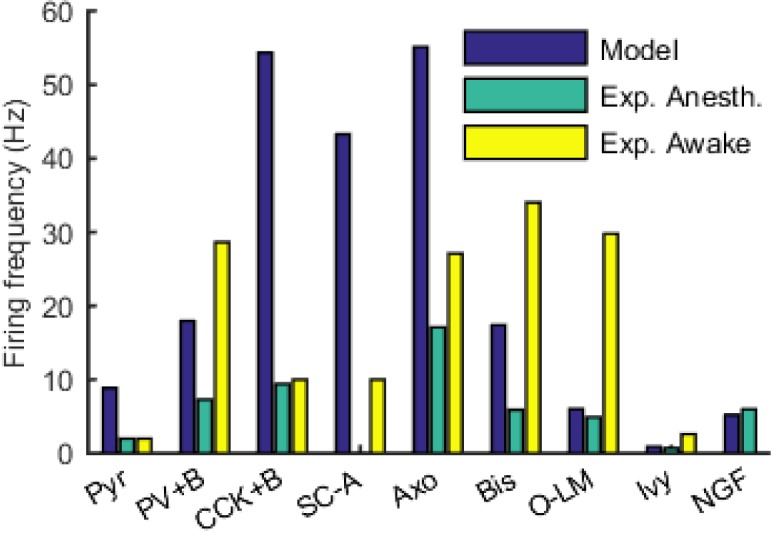
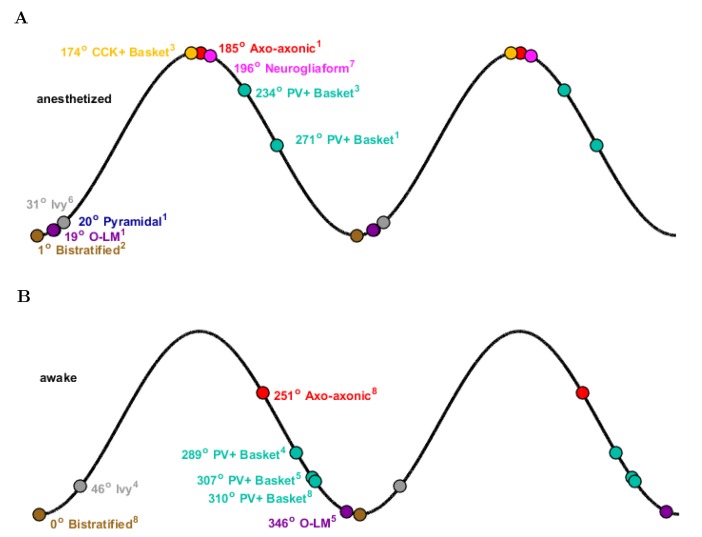
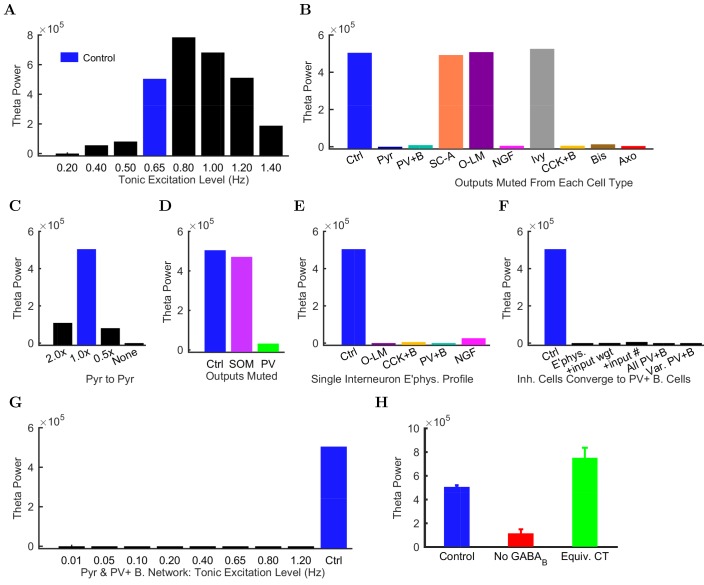
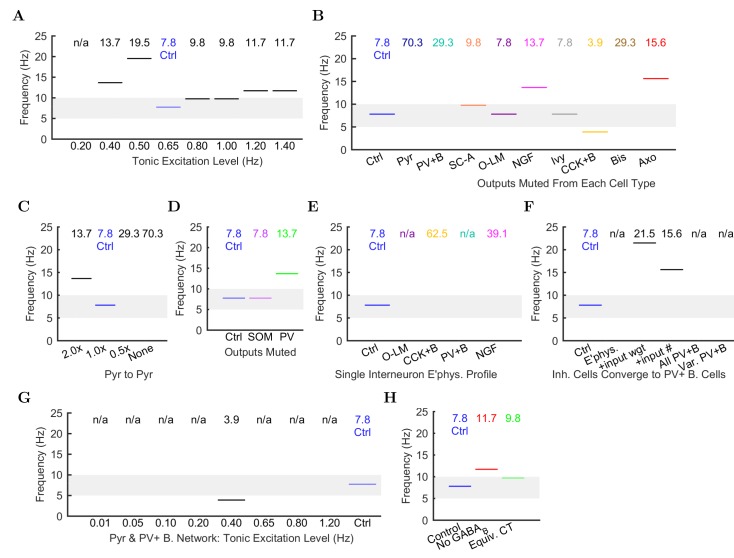
The hippocampal theta rhythm plays important roles in information processing; however, the mechanisms of its generation are not well understood. We developed a data-driven, supercomputer-based, full-scale (1:1) model of the rodent CA1 area and studied its interneurons during theta oscillations. Theta rhythm with phase-locked gamma oscillations and phase-preferential discharges of distinct interneuronal types spontaneously emerged from the isolated CA1 circuit without rhythmic inputs. Perturbation experiments identified parvalbumin-expressing interneurons and neurogliaform cells, as well as interneuronal diversity itself, as important factors in theta generation. These simulations reveal new insights into the spatiotemporal organization of the CA1 circuit during theta oscillations.

Keywords: computational; computational biology; hippocampus; inhibition; model network; mouse; neuroscience; oscillation; rat; systems biology; theta.


Conflict of interest statement

The authors declare that no competing interests exist.

Figures

Figure 1.
Figure 1.. CA1 network connectivity.
(A) The model network is arranged in a layered prism with the lengths of each dimension similar to the actual dimensions of the CA1 region and its layers. (B) The model cell somata within a small chunk of stratum pyramidale (as depicted in A) are plotted to show the regular distribution of model cells throughout the layer in which they are found. (C) Each pyramidal cell in the network has detailed morphology with realistic incoming synapse placement along the dendrites and soma. (D,E) Diagrams illustrate connectivity between types of cells. (D) The network includes one principal cell type (pyramidal cells) and eight interneuron types. Cell types that may connect are linked by a line colored according to the presynaptic cell type. Most cell types can connect to most other cell types. Total number of cells of each type are displayed, as are the number of local output synapses (boutons) from all cells of each type. (E) The number, position, and cell types of each connection are biologically constrained, as are the numbers and positions of the cells. See Figure 1—figure supplement 1) for details about the convergence onto each cell type. Also see Table 1 and Figure 1—figure supplement 2 for information about the cell-type combinations of the 5 billion connections and the axonal distributions followed by each cell type, as well as detailed connectivity results at http://doi.org/10.6080/K05H7D60. DOI: http://dx.doi.org/10.7554/eLife.18566.002
Figure 1—figure supplement 1.
Figure 1—figure supplement 1.. Quantitative network connectivity.
The average number of incoming synapses per postsynaptic cell of the given type are shown for (A) all inputs to the cells, (B) all excitatory inputs to the cells and (C) all inhibitory inputs to the cells. DOI: http://dx.doi.org/10.7554/eLife.18566.003
Figure 1—figure supplement 2.
Figure 1—figure supplement 2.. Anatomically constrained connectivity.
The axonal distributions are shown per presynaptic cell type. The distribution of boutons is plotted as a function of distance from the presynaptic cell’s soma. Boutons connecting to all possible types of postsynaptic cells are included in the plot. The colors correspond to each presynaptic cell type using the same color code as previous figures. DOI: http://dx.doi.org/10.7554/eLife.18566.004
Figure 2.
Figure 2.. Electrophysiology of the model network components.
(A) Ion channel densities vary as a function of location (top) in the morphologically detailed pyramidal cell model (bottom; adapted from Poolos et al., 2002). Scale bar: 100 μm and 0.01 μF/cm2. (B–C) The sodium channel found in the pyramidal cell soma is characterized in terms of (B) the activation/inactivation curves and (C) the current-voltage relation at peak (transient) current and steady state. (DG) Current sweeps are shown for four model cell types: (D) PV+ basket cell, (E) CCK+ basket cell, (F) O-LM cell, and (G) neurogliaform cell. Scale bar: 100 ms and 20 mV. (H–J) Electrophysiological properties for each cell type, including (H) input resistance, (I) membrane time constant, and (J) action potential threshold. (K–L) Pyramidal cell synaptic connections are characterized as post-synaptic currents with the postsynaptic cell voltage clamped at −50 mV; (K) synapses made onto the pyramidal cell from all other cell types and (L) synapses made by the pyramidal cell onto all network cell types. Cells represented by same colors as in Figure 1. Source Data available for electrophysiological characterizations shown here. Additional details available in the Methods, Table 3, and the Appendix. DOI: http://dx.doi.org/10.7554/eLife.18566.005
Figure 3.
Figure 3.. Detailed network activity.
(A–D) One second of network activity is shown. (A–B) The LFP analog, filtered at (A) the theta range of 5–10 Hz and (B) the low gamma range of 25–40 Hz, shows consistent theta and gamma signals. Scale bar represents 100 ms and 0.2 mV (theta) or 0.27 mV (gamma) for filtered LFP traces. (C) Raster of all spikes from cells within 100 μm of the reference electrode point. (D) Representative intracellular somatic membrane potential traces from cells near the reference electrode point. Scale bar represents 100 ms and 50 mV for the intracellular traces. DOI: http://dx.doi.org/10.7554/eLife.18566.037
Figure 4.
Figure 4.. Spectral analysis of model activity.
(A) A spectrogram of the local pyramidal-layer LFP analog (including contributions from all pyramidal cells within 100 μm of the reference electrode and 10% of pyramidal cells outside that radius) shows the stability and strength of the theta oscillation over time. The oscillation also featured strong harmonics at multiples of the theta frequency of 7.8 Hz. (B,D) Welch’s periodogram of the spike density function for each cell type, normalized by cell type and by displayed frequency range, shows the dominant network frequencies of (B) theta (7.8 Hz) and (D) gamma (71 Hz). Power is normalized to the peak power displayed in the power spectrum for each cell type. (C) Cross-frequency coupling between theta and gamma components of the LFP analog shows that the gamma oscillation is theta modulated. The gamma envelope is a function of the theta phase with the largest amplitude gamma oscillations occurring at the trough of the theta oscillation. Following convention, the theta trough was designated 0°/360°; see e.g., Varga et al. (2012). A graphical explanation of the relation between a spike train and its spike density function is shown in Figure 4—figure supplement 1. DOI: http://dx.doi.org/10.7554/eLife.18566.041
Figure 4—figure supplement 1.
Figure 4—figure supplement 1.. Different views of cell activity.
Several ways of characterizing model cell activity per cell type are shown using the spikes from the ivy cells as an example. (A) The spike times of each ivy cell are plotted as a function of time and ivy cell number. A subset of ivy cells positioned within 100 μm of the reference electrode location (whose spikes are shown in black) are then carried forward in the remaining calculations. (B) The spikes of the local ivy cells are binned into 1 ms windows to give spike counts per window. (C) A continuous representation of the ivy cell spikes as a function of time is given in the spike density function (SDF) computed from the ivy cell spike times. (D) A Welch’s Periodogram is computed, which summarizes the power of each oscillation frequency in the ivy cell SDF Although only a part of the simulation is shown, the full simulation length (except the first 50 ms) was used in the spectral analysis. DOI: http://dx.doi.org/10.7554/eLife.18566.044
Figure 5.
Figure 5.. Model and experimental cell theta phases.
All model results are based on the spiking of the cells within 100 μm of the reference electrode. (A–B) Firing probability by cell type as a function of theta phase for (A) model and (B) experimental cells under anesthesia (histograms adapted with permission from Figure 2, Figure 5B left, and Figure 6F respectively from Klausberger and Somogyi, 2008; Fuentealba et al., 2008; Fuentealba et al., 2010). The model histograms are normalized; see Figure 5—figure supplement 1 for firing rates. (C) Theta phase preference and theta modulation level were correlated; better modulated cell types spiked closer to the LFP analog trough near the phase preference of pyramidal cells. (D) Theta phase preference plotted on an idealized LFP wave for model data (base of arrow signifies the model phase preference and head of the arrow shows the distance to anesthetized, experimental phase preference). DOI: http://dx.doi.org/10.7554/eLife.18566.045
Figure 5—figure supplement 1.
Figure 5—figure supplement 1.. Firing rates of model and experimental cells of each type.
For experimental cells, firing rates in both the anesthetized and awake states were included where available. See Table 6 for sources of experimental data. DOI: http://dx.doi.org/10.7554/eLife.18566.057
Figure 5—figure supplement 2.
Figure 5—figure supplement 2.. Theta phase-specific firing preferences of various biological hippocampal cell types as reported in the literature.
The trough of the pyramidal-layer LFP is designated as 0/360 and the peak as 180. There is variation in phase preference for given cell types as a function of the experimental preparation. Shown are (A) anesthetized and (B) awake experimental conditions. Reference subscripts correspond to: 1: Klausberger et al. (2003), 2: Klausberger et al. (2004), 3: Klausberger et al. (2005), 4: Lapray et al. (2012), 5: Varga et al. (2012), 6: Fuentealba et al. (2008), 7: Fuentealba et al. (2010), 8: Varga et al. (2014). See Table 6 for further details. DOI: http://dx.doi.org/10.7554/eLife.18566.058
Figure 6.
Figure 6.. Altered network configurations.
Oscillation power (in mV22/Hz) of the spike density function (SDF) for pyramidal cells within 100 μm of the reference electrode, at the peak frequency within theta range (5–10 Hz) in altered network configurations. For corresponding peak frequencies, see Figure 6—figure supplement 1. (A) Theta is present at some excitation levels. (B) Muting each cell type’s output caused a range of effects. (C) The stability and frequency of spontaneous theta in the network was sensitive to the presence and number of recurrent connections between CA1 pyramidal cells. (D) Partially muting the broad classes of PV+ or SOM+ cells by 50% showed that PV+ muting disrupted the network more than SOM+ muting. (E) Theta falls apart when all interneurons are given the same electrophysiological profile, whether it be of a PV+ basket, CCK+ basket, neurogliaform, or O-LM cell. (F) Gradually setting all interneuron properties to those of PV+ basket cells did not restore theta. From left to right: control network; PV+ basket cell electrophysiology; also weights of incoming synapses; also numbers of incoming synapses; then all interneurons being PV+ basket cells (with the addition of the output synapse numbers, weights, and kinetics); then variable RMP (normal distribution with standard deviation of 8 mV). (G) A wide range in excitation was unable to produce theta in the PV+ B. network. (H) Removing the GABAB component from the neurogliaform synapses onto other neurogliaform cells and pyramidal cells showed a significant drop in theta power. Massively increasing the weight of the GABAA component to produce a similar amount of charge transfer restored theta power (compare the IPSCs corresponding to each condition in Figure 6—figure supplement 2). Standard deviations (n = 3) shown; significance (p=1.8e-05). DOI: http://dx.doi.org/10.7554/eLife.18566.061
Figure 6—figure supplement 1.
Figure 6—figure supplement 1.. Peak frequencies of oscillations in altered networks.
Peak theta frequency (within 5–10 Hz) of the spike density function (SDF) for all pyramidal cells within 100 μm of the reference electrode in each altered network configuration. For networks where no pyramidal cells spiked, resulting in zero power within the spectral analysis of the pyramidal cell spike density function, their peak frequencies are listed as ‘not available’ or ‘n/a’. (A) Spontaneous theta oscillation accelerated out of theta range with more excitation. (B) Muting each cell type shifted the oscillation out of range (neurogliaform, CCK+ basket, and axo-axonic cells), disrupted theta but not gamma (not shown; pyramidal, PV+ basket, and bistratified cells), or had little effect (S.C.-A., O-LM, and ivy cells). (C) Doubling the connections between CA1 pyramidal cells increased the theta frequency, while networks with half the number or no recurrent collaterals lost the slow oscillation but kept gamma. (D) Removing 50% of PV+ cell inhibition (PV+ basket, bistratified, and axo-axonic cells) or 50% of SOM+ cell inhibition (bistratified or O-LM cells) shifted the oscillation out of theta range or lost the slow oscillation entirely but kept gamma. (E) Peak oscillation shifted out of theta range when all interneurons had the same electrophysiological profile, regardless of the profile used. (F) Converging all properties to PV+ basket cells, gamma was restored (not shown) but not theta (left to right: control; network with 1: diverse interneurons with same electrophysiology; 2: also with same weights of incoming synapses; 3: also with same numbers of incoming synapses; 4: complete conversion to PV+ basket cells; 5: added variability in resting membrane potential (normal distribution with st. dev.=8 mV)). (G) In the all-PV+ basket cell network, a wide range of excitation levels could not produce a spontaneous theta rhythm. (H) Removing GABAB increased the oscillation frequency. DOI: http://dx.doi.org/10.7554/eLife.18566.064
Figure 6—figure supplement 2.
Figure 6—figure supplement 2.. IPSCs from the neurogliaform to pyramidal cell synapse corresponding to the different conditions in Figure 6H.
These traces are from pyramidal cells clamped at −50 mV during a paired recording from a presynaptic neurogliaform cell with a GABAA reversal potential of −60 mV and a GABAB reversal potential of −90 mV. The currents shown are averages from 10 recordings. Scale bar = 100 ms and 5 pA. DOI: http://dx.doi.org/10.7554/eLife.18566.065
Appendix 1—figure 1.
Appendix 1—figure 1.. Firing Rates of Experimental Cells.
Rebound spiking, which occurs in some O-LM cells at hyperpolarized current injection levels, is not shown in this graph. DOI: http://dx.doi.org/10.7554/eLife.18566.067
Appendix 1—figure 2.
Appendix 1—figure 2.. Physiological properties of experimental and model cells.
Experimental data are shown with closed markers for the mean and error bars for cell types where n > 1. The model cell properties are plotted as open circles. Calculation of properties is explained in the text. (A) resting membrane potential, (B) threshold, and (C) spike amplitude. DOI: http://dx.doi.org/10.7554/eLife.18566.070
Appendix 1—figure 3.
Appendix 1—figure 3.. Physiological properties, continued.
(A) sag time constant, (B) sag amplitude, and (C) amplitude of afterhyperpolarization (AHP). DOI: http://dx.doi.org/10.7554/eLife.18566.071
Appendix 1—figure 4.
Appendix 1—figure 4.. Physiological properties, continued.
(A) rheobase, (B) membrane time constant, (C) interspike interval (ISI), and (D) input resistance. DOI: http://dx.doi.org/10.7554/eLife.18566.072
Appendix 1—figure 5.
Appendix 1—figure 5.. Pyramidal (A) model and (B) experimental current sweep.
(C) Firing rates of model and experimental cells. DOI: http://dx.doi.org/10.7554/eLife.18566.073
Appendix 1—figure 6.
Appendix 1—figure 6.. Connections onto (A) and (B) from model Pyramidal cells, under voltage clamp at −50 mV with physiological reversal potentials.
DOI: http://dx.doi.org/10.7554/eLife.18566.081
Appendix 1—figure 7.
Appendix 1—figure 7.. Axo-axonic (A) model and (B) experimental current sweep.
(C) Firing rates of model and experimental cells. DOI: http://dx.doi.org/10.7554/eLife.18566.082
Appendix 1—figure 8.
Appendix 1—figure 8.. Connections onto (A) and (B) from model Axo-axonic cells, under voltage clamp at −50 mV with physiological reversal potentials.
DOI: http://dx.doi.org/10.7554/eLife.18566.089
Appendix 1—figure 9.
Appendix 1—figure 9.. Bistratified (A) model and (B) experimental current sweep.
(C) Firing rates of model and experimental cells. DOI: http://dx.doi.org/10.7554/eLife.18566.090
Appendix 1—figure 10.
Appendix 1—figure 10.. Connections onto (A) and (B) from model Bistratified cells, under voltage clamp at −50 mV with physiological reversal potentials.
DOI: http://dx.doi.org/10.7554/eLife.18566.098
Appendix 1—figure 11.
Appendix 1—figure 11.. CCK+ Basket (A) model and (B) experimental current sweep.
(C) Firing rates of model and experimental cells. DOI: http://dx.doi.org/10.7554/eLife.18566.099
Appendix 1—figure 12.
Appendix 1—figure 12.. Connections onto (A) and (B) from model CCK+ Basket cells, under voltage clamp at −50 mV with physiological reversal potentials.
DOI: http://dx.doi.org/10.7554/eLife.18566.106
Appendix 1—figure 13.
Appendix 1—figure 13.. Ivy (A) model and (B) experimental current sweep.
(fig:ivypage:firing) Firing rates of model and experimental cells. DOI: http://dx.doi.org/10.7554/eLife.18566.107
Appendix 1—figure 14.
Appendix 1—figure 14.. Connections onto (A) and (B) from model Ivy cells, under voltage clamp at −50 mV with physiological reversal potentials.
DOI: http://dx.doi.org/10.7554/eLife.18566.115
Appendix 1—figure 15.
Appendix 1—figure 15.. Neurogliaform (A) model and (B) experimental current sweep.
(C) Firing rates of model and experimental cells. DOI: http://dx.doi.org/10.7554/eLife.18566.116
Appendix 1—figure 16.
Appendix 1—figure 16.. Connections onto (A) and (B) from model Neurogliaform cells, under voltage clamp at −50 mV with physiological reversal potentials.
DOI: http://dx.doi.org/10.7554/eLife.18566.124
Appendix 1—figure 17.
Appendix 1—figure 17.. O-LM (A) model and (B) experimental current sweep.
(C) Firing rates of model and experimental cells. DOI: http://dx.doi.org/10.7554/eLife.18566.125
Appendix 1—figure 18.
Appendix 1—figure 18.. Connections onto (A) and (B) from model O-LM cells, under voltage clamp at −50 mV with physiological reversal potentials.
DOI: http://dx.doi.org/10.7554/eLife.18566.132
Appendix 1—figure 19.
Appendix 1—figure 19.. PV+ Basket (A) model and (B) experimental current sweep.
(C) Firing rates of model and experimental cells. DOI: http://dx.doi.org/10.7554/eLife.18566.133
Appendix 1—figure 20.
Appendix 1—figure 20.. Connections onto (A) and (B) from model PV+ Basket cells, under voltage clamp at −50 mV with physiological reversal potentials.
DOI: http://dx.doi.org/10.7554/eLife.18566.141
Appendix 1—figure 21.
Appendix 1—figure 21.. Schaffer Collateral-Associated (A) model and (B) experimental current sweep.
(C) Firing rates of model and experimental cells. DOI: http://dx.doi.org/10.7554/eLife.18566.142
Appendix 1—figure 22.
Appendix 1—figure 22.. Connections onto (A) and (B) from model Schaffer Collateral-Associated cells, under voltage clamp at −50 mV with physiological reversal potentials.
DOI: http://dx.doi.org/10.7554/eLife.18566.150
Appendix 1—figure 23.
Appendix 1—figure 23.. Calcium channel currents.
DOI: http://dx.doi.org/10.7554/eLife.18566.156
Appendix 1—figure 24.
Appendix 1—figure 24.. HCN channel currents.
DOI: http://dx.doi.org/10.7554/eLife.18566.157
Appendix 1—figure 25.
Appendix 1—figure 25.. Delayed rectifier potassium channel currents.
DOI: http://dx.doi.org/10.7554/eLife.18566.158
Appendix 1—figure 26.
Appendix 1—figure 26.. A-type potassium channel currents.
DOI: http://dx.doi.org/10.7554/eLife.18566.159
Appendix 1—figure 27.
Appendix 1—figure 27.. Other potassium channel currents.
Because they didn’t have a voltage-sensitive inactivation component, only the activation curve, which is equivalent to the IV Peak curve, need be shown here. DOI: http://dx.doi.org/10.7554/eLife.18566.160
Appendix 1—figure 28.
Appendix 1—figure 28.. Calcium-dependent potassium channel dependence on calcium concentration.
(a) The normalized conductance of the channels are plotted as a function of test voltage step and calcium concentration. (b) and (c) The current-voltage relation is shown at several calcium concentrations for (b) KvCaB channel and (c) KCaS channel. Note that the KCaS channel is only active at the highest calcium concentration and is not dependent on voltage (although the voltage continues to set the driving force) when it is active. DOI: http://dx.doi.org/10.7554/eLife.18566.161
Appendix 1—figure 29.
Appendix 1—figure 29.. Sodium channel voltage dependence.
The normalized conductance of the sodium channel is plotted as (a) a function of test voltage step to show activation and (b) as a function of holding voltage prior to the test step to show inactivation. DOI: http://dx.doi.org/10.7554/eLife.18566.162

Similar articles

Cited by

References

    1. Akam TE, Kullmann DM. Efficient "communication through coherence" requires oscillations structured to minimize interference between signals. PLoS Computational Biology. 2012;8:e1002760. doi: 10.1371/journal.pcbi.1002760. - DOI - PMC - PubMed
    1. Amilhon B, Huh CY, Manseau F, Ducharme G, Nichol H, Adamantidis A, Williams S. Parvalbumin interneurons of hippocampus tune population activity at theta frequency. Neuron. 2015;86:1277–1289. doi: 10.1016/j.neuron.2015.05.027. - DOI - PubMed
    1. Andersen P, Morris R, Amaral D, Bliss T, O’Keefe J. The Hippocampus Book. USA: Oxford University Press; 2006.
    1. Aradi I, Holmes WR. Role of multiple calcium and calcium-dependent conductances in regulation of hippocampal dentate granule cell excitability. Journal of Computational Neuroscience. 1999;6:215–235. doi: 10.1023/A:1008801821784. - DOI - PubMed
    1. Armstrong C, Soltesz I. Basket cell dichotomy in microcircuit function. The Journal of Physiology. 2012;590:683–694. doi: 10.1113/jphysiol.2011.223669. - DOI - PMC - PubMed