. 2016 Dec 20;17(12):3142-3152.
doi: 10.1016/j.celrep.2016.11.065.

Anabolism-Associated Mitochondrial Stasis Driving Lymphocyte Differentiation over Self-Renewal

Affiliations

Anabolism-Associated Mitochondrial Stasis Driving Lymphocyte Differentiation over Self-Renewal

William C Adams et al. Cell Rep. .

Abstract

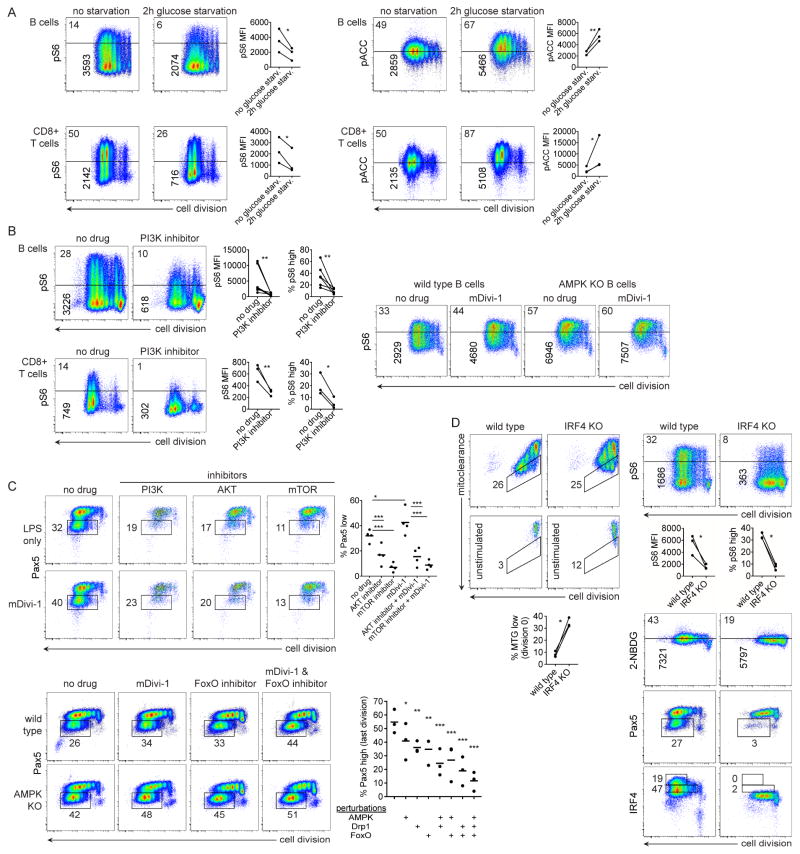
Regeneration requires related cells to diverge in fate. We show that activated lymphocytes yield sibling cells with unequal elimination of aged mitochondria. Disparate mitochondrial clearance impacts cell fate and reflects larger constellations of opposing metabolic states. Differentiation driven by an anabolic constellation of PI3K/mTOR activation, aerobic glycolysis, inhibited autophagy, mitochondrial stasis, and ROS production is balanced with self-renewal maintained by a catabolic constellation of AMPK activation, mitochondrial elimination, oxidative metabolism, and maintenance of FoxO1 activity. Perturbations up and down the metabolic pathways shift the balance of nutritive constellations and cell fate owing to self-reinforcement and reciprocal inhibition between anabolism and catabolism. Cell fate and metabolic state are linked by transcriptional regulators, such as IRF4 and FoxO1, with dual roles in lineage and metabolic choice. Instructing some cells to utilize nutrients for anabolism and differentiation while other cells catabolically self-digest and self-renew may enable growth and repair in metazoa.

Keywords: Pax5; TCF1; Warburg effect; asymmetric cell division; self-renewal; stem cell.


Figures

Figure 1
Figure 1. Clearance and stasis of aged mitochondria impact lymphocyte cell fate
(A) Left plots, LPS-activated, Pax5(hCD2) reporter B cells were sorted from later cell generations based on hCD2 expression and post-sort purity of live cells is shown. Right plots, pre-sort Pax5 protein staining of fixed cells next to Pax5 protein staining of sorted cells, followed by Pax5 protein staining of sorted populations one day after re-plating in fresh media containing LPS. Plots depict one representative experiment and numbers are summary statistics (mean±SD, n=5) for frequency of cells in corresponding gate. (B) Top-left panel: Cell division versus Pax5 and IRF4 expression of naive B cells stimulated in vitro with LPS. 36 hours after stimulation, cells were transduced with control retrovirus (RV) or RV encoding dominant-negative (DN) Drp1 and returned to stimulatory conditions for 36 hours. Only transduced cells are shown. Horizontal numbers denote frequency of cells within a bound area (i.e. gate). Adjacent graphs denote frequency of Pax5lo (n=4, **P<0.01, two-tailed paired t-test) and IRF4hi (n=3, *P<0.05, two-tailed paired t-test) cells among B cells transduced with control or DN Drp1 RV. DN Drp1 RV increased frequency of Pax5lo cells from 25.3±7.6 to 86.9±6.1 and IRF4hi cells from 39.2±8.5 to 75.5±2.6 compared to control RV (mean±SD). Lower-left panel: CTV-labeled CD8+ T cells stimulated with anti-CD3 and anti-CD28 antibodies with IL-2 for 36 hours, then transduced with control or DN Drp1 RV, and analyzed by FACS for cell division versus TCF1 expression 36 hours after transduction. Only transduced cells are shown. Graph indicates frequency of TCF1lo T cells among cells transduced with control or DN Drp1 RV (n=3, *P<0.05, two-tailed paired t-test). DN Drp1 RV increased frequency of TCF1lo cells from 20.1±8.6 to 88.4±16.2 compared to control RV (mean±SD). Top-right panel: CTV-labeled B cells from wild type mice stimulated with LPS in the absence or presence of mDivi-1 (10 μM) inhibitor of Drp1 for 66 hours. Graphs indicate frequency of Pax5lo and Pax5loIRF4hi B cells among cells activated in the absence or presence of mDivi-1 (n=7, ***P<0.005, two-tailed paired t-test). mDivi-1 increased frequency of Pax5lo cells from 27.8±4.9 to 39.41±8.5 and Pax5loIRF4hi cells from 29.5±6.9 to 41.3±9.5 compared to no drug treatment (mean±SD). Lower-right panel: CTV-labeled P14 transgenic CD8+ T cells stimulated with gp33–41 and IL-2 for 4 days in the absence or presence of mDivi-1 (10 μM). Graph indicates frequency of TCF1lo T cells among cells activated in the absence or presence of mDivi-1 (n=5, **P<0.01, two-tailed paired t-test); mDivi-1 increased frequency of TCF1lo cells from 12.5±1.8 to 26.0±5.1 (mean±SD) compared to no drug. (C) FACS of CTV-labeled and MitoTracker Green FM (“MTG”)-pulsed activated B cells (top row) and P14 CD8+ T cells (bottom row) stimulated with LPS or gp33–41 peptide and IL-2, respectively for 66 hours. Cells were cultured in absence or presence of mDivi-1 (10 μM), Chloroquine (1 and 5 μM, left-to-right), or Rapamycin (1 nM) as indicated. Reverse arrow on the y-axis indicates dilution plus elimination of pre-labeled (pulsed) mitochondria that occurs with each cell division (x-axis), termed mitoclearance. Upper row statistics are frequency of cells within the entire trapezoidal MTG low gate (left) and MFI of MTG signal in the fourth cell division (right) (n=3, **P<0.01 and ***P<0.005 for indicated treated groups compared to no drug control group, repeated measures one-way ANOVA). Lower row graphs are frequency of cells within entire trapezoidal MTG low gate (left) and MFI of MTG signal in fourth cell division (right) (n=3, *P<0.05 or **P<0.01 for treated versus control group, repeated measures one-way ANOVA). (D) CTV and MTG pulse-labeled P14 CD8+ T cells (top row) and OT-II CD4+ T cells (bottom panels) were adoptively transferred into congenically disparate recipients challenged with Listeria (LMgp33) or PR8-OVA influenza virus, respectively. For CD8+ T cells, left plot depicts cell division versus mitoclearance for non-transferred cells as a control for starting fluorescence of MTG pulse-labeling. Middle and right plots represent KLRG1- and KLRG1+ [known to be TCF1lo (Lin et al., 2016; Lin et al., 2015)] CD8+ donor T cells from recipient mice 3 days post Listeria challenge. Statistics denote frequency of MTG high cells (left) and the MTG MFI of all cells in the indicated KLRG1- and KLRG1+ groups (n=3; **P<0.01, two-tailed paired t-test). For CD4+ T cells, upper row depicts cell division versus mitoclearance in draining LNs, non-draining LNs, and lung tissue; bottom row depicts cell division versus TCF1 expression. Numbers are frequency within gates encompassing divided cells. CD4+ FACS plots representative of two identical experiments. (E) Top panels: MitoTracker Red FM (MTR)-pulsed, LPS-stimulated B cells fixed after 44 hours and stained with DNA dye and anti-tubulin antibodies. One representative metaphase (symmetric), telophase (symmetric), and cytokinetic (asymmetric) event shown. Experiment repeated three times (metaphase n=11 cells, telophase n=8 sibling pairs, and cytokinesis n=18 sibling pairs). Graph depicts percentage of sibling cell pairs with equal or unequal ratios of MTR and tubulin (*P<0.05, Fisher’s exact test). Bottom panels: Two representative time-lapse series of LPS-stimulated B cells transduced with mCherry-alpha-tubulin RV and pulsed with MTG 16 hours prior to imaging. Frames, left-to-right, represent 3 minute (upper row) and 2 minute (lower row) intervals (n=3). Scale bars 5 μm. (F) Confocal images of live, LPS-stimulated B cells transduced with mCherry-alpha-tubulin RV and labeled with CYTO-ID. Top panel: three representative cytokinetic sibling pairs (n=19 sibling pairs, 74% asymmetric, ***P<0.005, Fisher’s exact test). Bottom panel: Confocal images of live, LPS-stimulated B cells transduced with mCherry-alpha-tubulin RV and co-pulsed with MTG and LysoTracker 16 hours prior to imaging. 73% of cells imaged had concordant asymmetric MTG and LysoTracker abundance (n=11 sibling pairs). Scale bars 5 μm. (G) LPS-activated, Pax5(hCD2) reporter B cells 3 days post-stimulation were sorted from later cell generations based on surface hCD2 expression, as in part (A). Cells were then labeled with MTG and LysoTracker DeepRed (top panels show representative image) or CytoID and MTR (bottom panels show representative image). Steady state mitophagy determined by co-localization of individual mitochondrial puncta with LysoTracker or CytoID puncta. Top-left graph indicates number of colocalized MTG/LysoTracker DeepRed puncta among Pax5hi (n=35) and Pax5lo (n=17) cells, with a mean of two puncta and one punctum, respectively; ***P<0.005, Mann-Whitney test). Top-right graph: number of colocalized MTG/LysoTracker DeepRed puncta, among Pax5(hCD2)hi cells sorted from cultures stimulated in the absence (n=15) or presence (n=21) of mDivi-1with a mean of three puncta and one punctum, respectively (***P<0.005, Mann-Whitney test). Bottom-left graph: number of colocalized MTR/CytoID puncta among Pax5hi (n=14) and Pax5lo (n=19) cells, with a mean of three puncta and one punctum, respectively (*P<0.05, Mann-Whitney test). Scale bars 5 μm. Fourth panel in each row is zoomed-in version of third panel. See also Figure S1
Figure 2
Figure 2. ROS mediate effects of, and reinforce stasis of, aged mitochondria
(A) CTV-labeled B cells (upper row) and P14 CD8+ T cells (lower row) stimulated with LPS or gp33–41 peptide and IL-2, respectively, in the absence or presence of mDivi-1 (10 μM) and analyzed on day 3 for cell division versus mitochondrial ROS (MitoSOX). Horizontal numbers denote frequency of cells within gate. Vertical numbers denote mean fluorescence intensity (MFI) of all cells, not simply those within gate. Upper graphs display MitoSOX MFI (left) and frequency of MitoSOXhi cells (right) among B cells stimulated in the absence or presence of mDivi-1 (n=3, *P<0.05 or **P<0.01, two-tailed paired t-test). Lower graphs display MitoSOX MFI (left) and frequency of MitoSOXhi cells (right) among T cells stimulated in the absence or presence of mDivi-1 (n=3, *P<0.05, two-tailed paired t-test). (B) B cells stimulated with LPS (left panels) or P14 CD8+ T cells stimulated with gp33–41 peptide and IL-2 (right panels) in the absence or presence of mDivi-1 (10 μM), without or with addition of NAC (3 mM for B cells; 5 mM for T cells) and analyzed for Pax5 or TCF1 expression. Left graph displays frequency of Pax5lo B cells in groups stimulated under indicated conditions (n=6, *P<0.05 or ***P<0.005, repeated measures one-way ANOVA). Right graph displays frequency of TCF1lo cells in groups stimulated under indicated conditions (n=5, *P<0.05 or **P<0.01, repeated measures one-way ANOVA). (C) CTV-labeled, MTG-pulsed B cells stimulated with LPS (top panels) or P14 CD8+ T cells stimulated with gp33–41 peptide and IL-2 (bottom panels) in the absence or presence of mDivi-1 (10 μM), Metformin (300 nM), Rapamycin (1 nM), or NAC (5 mM for B cells and 7 mM for T cells) analyzed for cell division versus mitoclearance on day 3. Data representative of two experiments for each cell type. Upper row statistics denote frequency of B cells within the entire trapezoidal MTG low gate (left) and MFI of MTG signal in the fourth cell division (right) (n=3, *P<0.05 or **P<0.01 or ***P<0.005 for drug treated groups compared to no drug control group, repeated measures one-way ANOVA). Lower row statistics are frequency of T cells within the entire trapezoidal MTG low gate (left) and MFI of MTG signal in the fourth cell division (right) (n=3, *P<0.05 or **P<0.01, two-tailed paired t-test). See also Figure S2
Figure 3
Figure 3. Aerobic glycolysis linking an anabolic constellation to differentiation
(A) Top panels: Cell division versus Pax5 expression of CTV-labeled B cells stimulated with LPS for 3 days in absence or presence of mDivi-1 (10 μM) and increasing doses of 2-Deoxy-D-glucose (2-DG) (0, 0.25, 0.50, and 0.75 mM left-to-right). In these B cell experiments, drug variables added 18 hours after stimulation. Bottom panels: Cell division versus TCF1 expression of CTV-labeled P14 CD8+ T cells stimulated for 4 days with gp33–41 peptide plus IL-2 in the absence or presence of mDivi-1 and increasing doses of 2-DG (0, 0.5, 1.0, and 2.0 mM), present from the beginning of stimulation. Upper statistical graph depicts frequency of Pax5lo B cells in indicated conditions (n=6, ***P<0.005, repeated measures one-way ANOVA). Lower statistical graph depicts frequency of TCF1lo CD8+ T cells in indicated conditions (n=5, **P<0.01 or ***P<0.005, repeated measures one-way ANOVA). (B) Top panels: CTV-labeled B cells stimulated for 36 hours with LPS prior to transduction with control or hexokinase-2 (HK-2) encoding retrovirus (RV) and analyzed 36 hours after transduction for cell division versus Pax5 and IRF4. Only transduced events are shown. Statistics are frequency of Pax5lo (upper) and IRF4hi (lower) cells among cells transduced with control or HK-2 RV (n=3, *P<0.05, two-tailed paired t-test). Bottom panels: CTV-labeled CD8+ T cells stimulated with anti-CD3 and anti-CD28 antibodies with IL-2 for 36 hours prior to transduction with control RV or hexokinase 2 encoding RV and analyzed 36 hours after transduction for cell division versus TCF1. Only transduced events are shown. Statistical graph depicts frequency of TCF1lo cells among cells transduced with control or HK-2 RV (n=3, *P<0.05, two-tailed paired t-test). (C) Upper left row, cell division versus mitoclearance of P14 CD8+ T cells stimulated for 3 days with gp33–41 peptide and IL-2 in the absence or presence of 2-DG (2.0 mM) or Rapamycin (10 nM). Statistics contain frequency of cells within the MTG low trapezoidal gate (left) and the mean MFI of MTG signal in the fourth cell division (right); (n=3, *P<0.05 or **P<0.01, two-tailed paired t-test). Middle left row, cell division versus autophagy (CYTO-ID stain) of P14 CD8+ T cells stimulated for 3 days with gp33–41 peptide and IL-2 in the absence or presence of 2-DG (2.0 mM) or Rapamycin (10 nM) prior to CYTO-ID staining. Statistics are MFI of CYTO-ID signal for indicated groups (n=3, *P<0.05, two-tailed paired t-test). Right panels: Cell division versus total cellular ROS production (DCFDA stain) of P14 CD8+ T cells stimulated for 4 days with gp33–41 peptide plus IL-2 in the absence or presence of 2-DG (2 mM) (upper row) or in glucose-free media repleted with glucose (10 mM) versus galactose (10 mM) (lower row). MFI of DCFDA staining in cells stimulated in the absence or presence of 2-DG in upper statistical graph (n=2). DCFDA staining in cells stimulated in media containing glucose versus galactose depicted in lower graph (n=3, **P<0.01, two-tailed paired t-test). Lower left row, cell division versus phosphorylated S6 ribosomal protein in B cells stimulated with LPS for 3 days in the absence or presence of 2-DG (0, 0.25, 0.5, and 1.0 mM left-to-right). Graph indicates frequency of pS6hi B cells in indicated conditions (n=3, **P<0.01 or ***P<0.005 comparing 2-DG treated groups to no drug treated group, repeated measures one-way ANOVA). See also Figure S3
Figure 4
Figure 4. Anabolic-catabolic bistability balancing differentiation and renewal
(A) Top panels: Cell division versus activation of mTOR (pS6, first 2 columns) or AMPK (indexed by phospho-Acetyl-CoA Caboxylase, second 2 columns). Top row, CTV-labeled B cells stimulated with LPS for 68 hours, without or with glucose starvation for last 2 hours. Bottom row, CTV-labeled P14 CD8+ T cells stimulated with gp33–41 peptide and IL-2 for three days, without or with glucose starvation for last 2 hours. Data representative of two separate experiments for each cell type. Statistics denote MFI of pS6 staining for LPS-activated B cells (upper left) and gp33–41 peptide/APCs/IL-2 activated P14 CD8+ T cells (lower left) and MFI of pACC staining for LPS-activated B cells (upper right) and activated P14 CD8+ T cells (lower right) done after no glucose starvation or 2 hours of glucose starvation (n=3 for each cell type, *P<0.05 or **P<0.01, two-tailed paired t-tests). (B) Left panels, cell division versus mTOR activation (pS6) in the absence or presence of PI3K inhibitor (5 μM; added 18 hours after stimulation for B cells). CTV-labeled B cells stimulated with LPS (upper row) and CTV-labeled P14 CD8+ T cells stimulated with gp33–41 peptide and IL-2 (lower row) were each analyzed 3 days after stimulation. Statistics are MFI of pS6 (left) frequency of pS6hi cells (right) (n=3 for each cell type, *P<0.05 or **P<0.01, two-tailed paired t-tests). Right panels, B cells from wild type and AMPKα1 knockout mice stimulated with LPS for 3 days in the absence or presence of mDivi-1 (10 μM) analyzed for cell division versus pS6. Data representative of two identical experiments. (C) Upper panels, cell division versus Pax5 expression of CTV-labeled B cells stimulated with LPS for 66 hours in the absence or presence of mDivi-1, and inhibitors of PI3K (5 μM), AKT (50 nM), and mTOR (1 nM). Graph contains frequency of Pax5lo B cells among indicated groups (n=4, *P<0.05 or ***P<0.005, repeated measures one-way ANOVA). Cells activated in the presence of PI3K inhibitor not included in graph but representative of two identical experiments. Lower panels, cell division versus Pax5 expression of CTV-labeled B cells from wild type and AMPK knockout mice stimulated with LPS for 3 days in the absence or presence of mDivi-1 (10 μM), FoxO1 inhibitor (1 μM), or both inhibitors. Graph contains frequency of Pax5hi cells in the last cell division among conditions indicated (n=3, *P<0.05 or **P<0.01 or ***P<0.005 comparing groups with one or more perturbations to group with no perturbation, repeated measures one-way ANOVA). (D) Left 2 columns, B cells from wild type and IRF4 knockout mice left unstimulated (bottom row) or stimulated with LPS for 66 hours (top row) were analyzed for cell division versus mitoclearance. Graph contains MFI of MTG signal in first cell generation (n=3, *P<0.05, two-tailed paired t-test). Right 2 columns, CTV-labeled B cells from wild type and IRF4 knockout mice stimulated with LPS for 66 hours were analyzed for cell division versus glucose uptake (2-NBDG), pS6, Pax5, and IRF4. Statistics denote MFI of pS6 (left) and frequency of pS6hi cells (right) (n=3, *P<0.05, two-tailed paired t-test). 2-NBDG uptake representative of two identical experiments. Pax5 and IRF4 staining repetitive of published findings (Lin et al., 2015). See also Figure S4

References

    1. Bengsch B, Johnson AL, Kurachi M, Odorizzi PM, Pauken KE, Attanasio J, Stelekati E, McLane LM, Paley MA, Delgoffe GM, et al. Bioenergetic Insufficiencies Due to Metabolic Alterations Regulated by the Inhibitory Receptor PD-1 Are an Early Driver of CD8(+) T Cell Exhaustion. Immunity. 2016;45:358–373. - PMC - PubMed
    1. Buck MD, O’Sullivan D, Klein Geltink RI, Curtis JD, Chang CH, Sanin DE, Qiu J, Kretz O, Braas D, van der Windt GJ, et al. Mitochondrial Dynamics Controls T Cell Fate through Metabolic Programming. Cell. 2016;166:63–76. - PMC - PubMed
    1. Caro-Maldonado A, Wang R, Nichols AG, Kuraoka M, Milasta S, Sun LD, Gavin AL, Abel ED, Kelsoe G, Green DR, et al. Metabolic reprogramming is required for antibody production that is suppressed in anergic but exaggerated in chronically BAFF-exposed B cells. J Immunol. 2014;192:3626–3636. - PMC - PubMed
    1. Chang CH, Curtis JD, Maggi LB, Jr, Faubert B, Villarino AV, O’Sullivan D, Huang SC, van der Windt GJ, Blagih J, Qiu J, et al. Posttranscriptional control of T cell effector function by aerobic glycolysis. Cell. 2013;153:1239–1251. - PMC - PubMed
    1. Chang JT, Ciocca ML, Kinjyo I, Palanivel VR, McClurkin CE, Dejong CS, Mooney EC, Kim JS, Steinel NC, Oliaro J, et al. Asymmetric proteasome segregation as a mechanism for unequal partitioning of the transcription factor T-bet during T lymphocyte division. Immunity. 2011;34:492–504. - PMC - PubMed

MeSH terms