. 2016 Dec 20;17(12):3153-3164.
doi: 10.1016/j.celrep.2016.11.016.

The Ciliary Margin Zone of the Mammalian Retina Generates Retinal Ganglion Cells

Affiliations

The Ciliary Margin Zone of the Mammalian Retina Generates Retinal Ganglion Cells

Florencia Marcucci et al. Cell Rep. .

Abstract

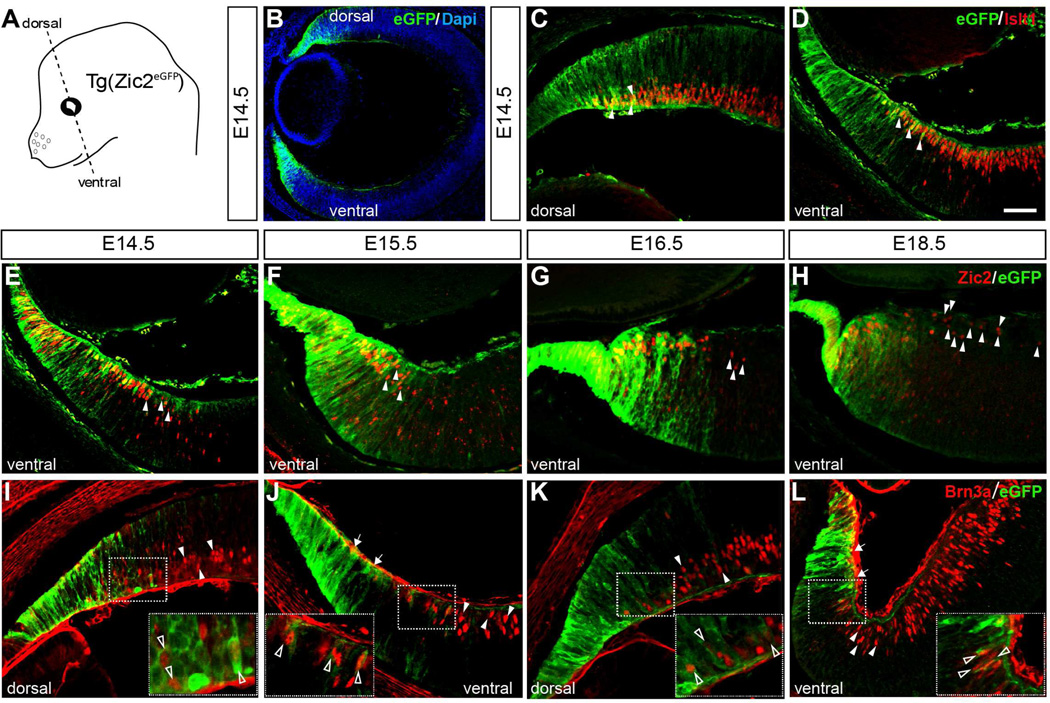
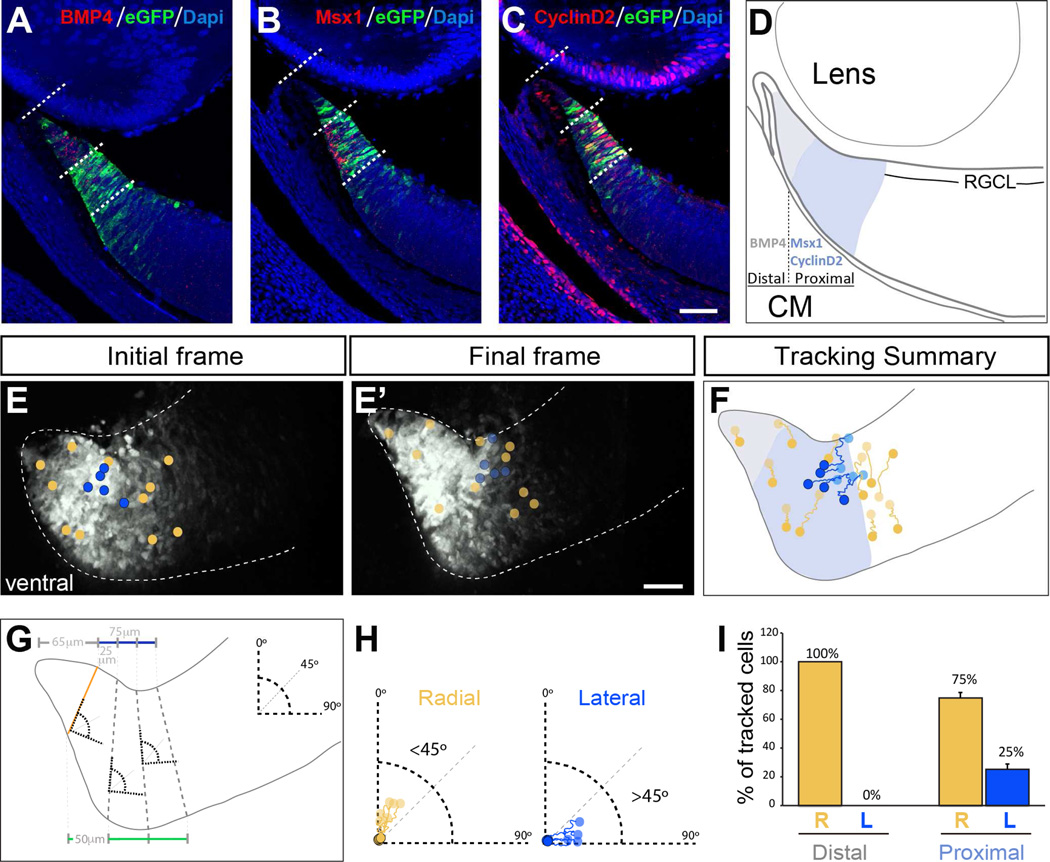
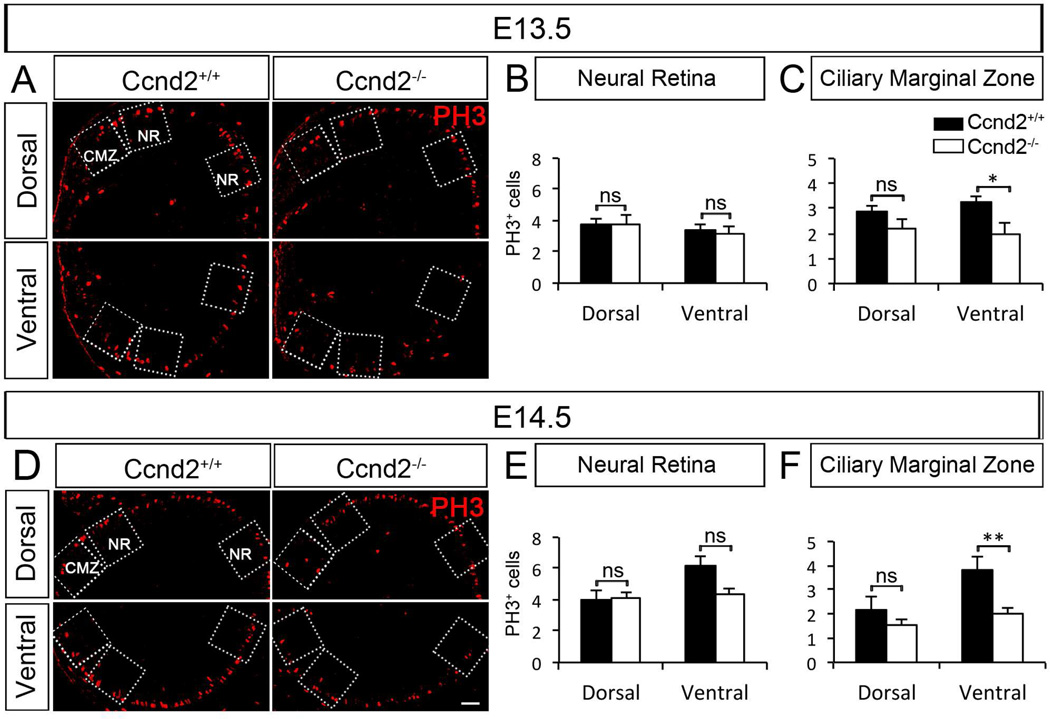
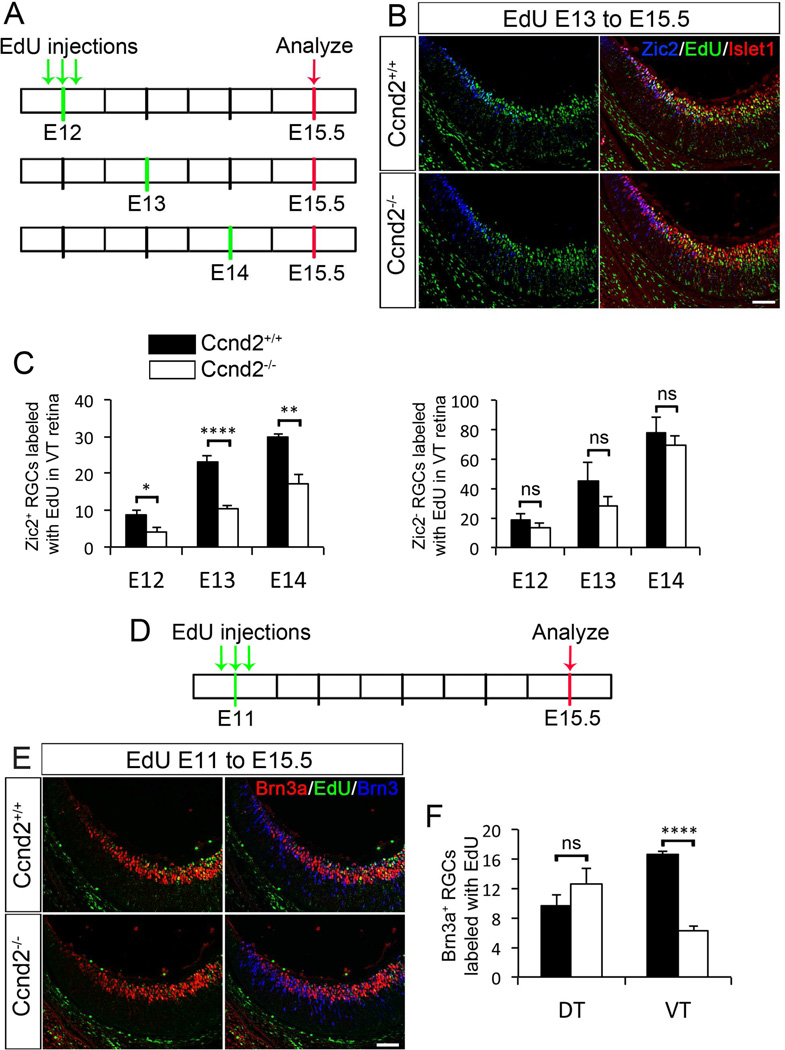
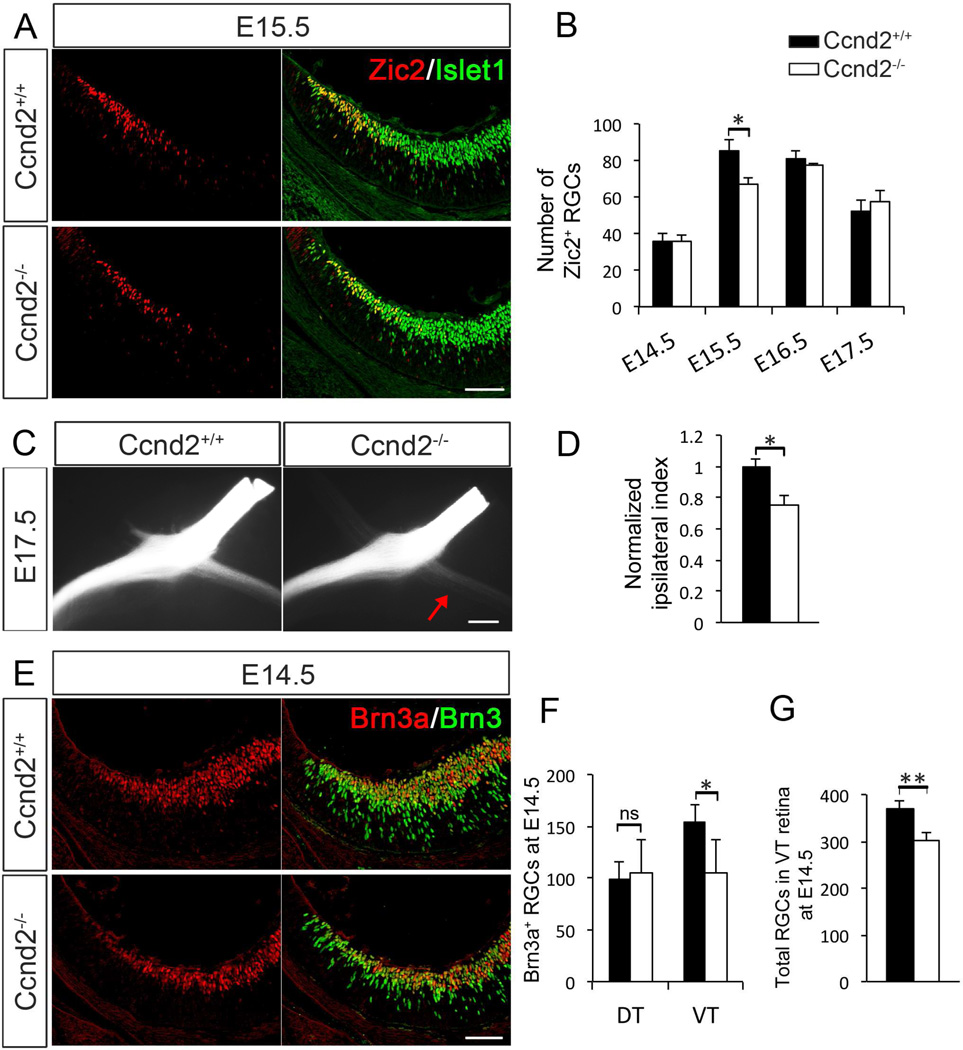
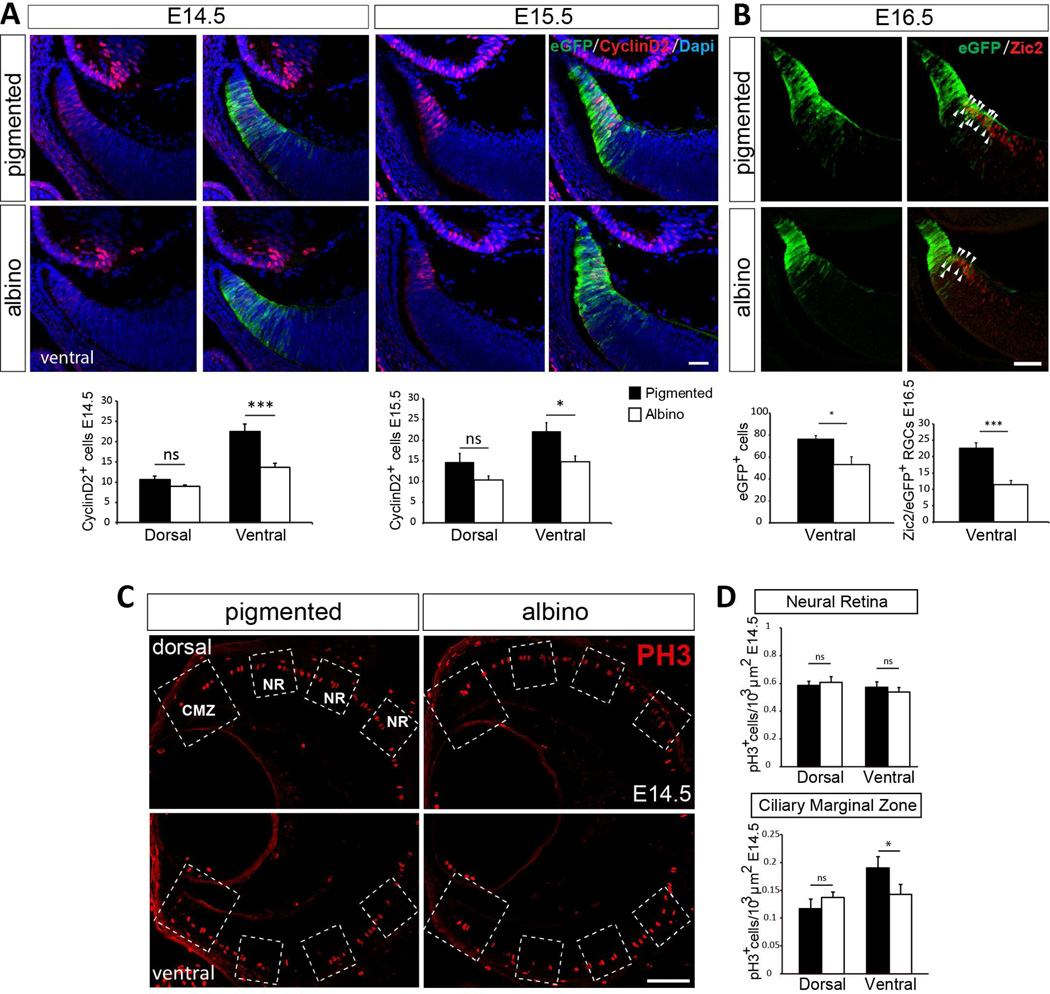
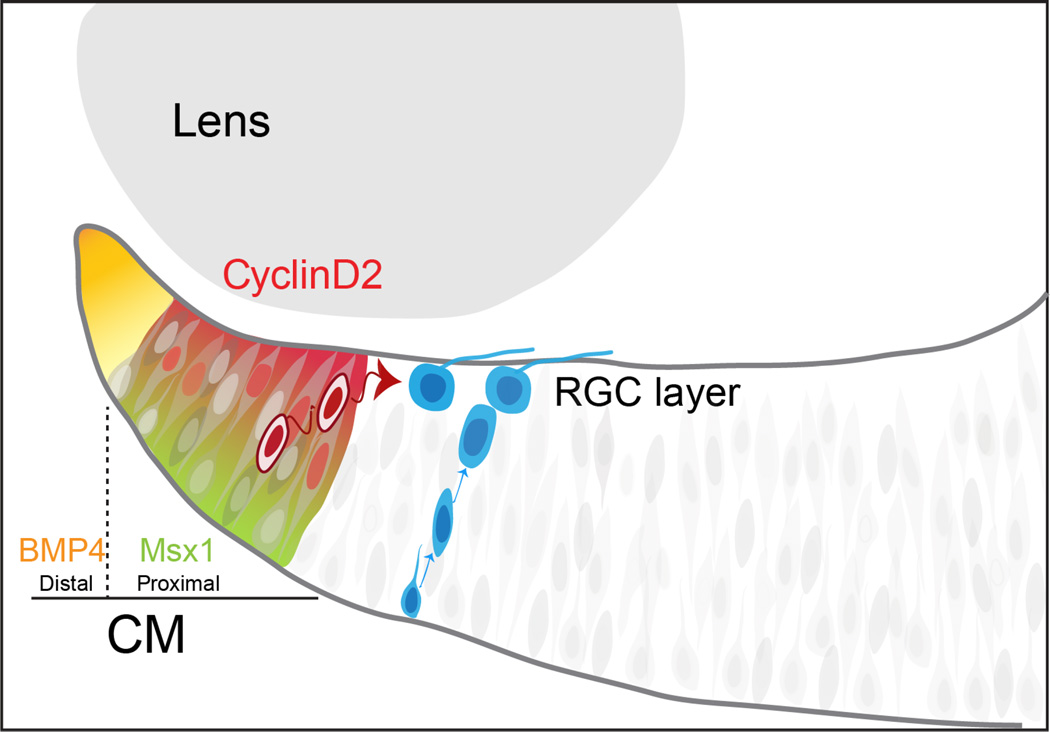
The retina of lower vertebrates grows continuously by integrating new neurons generated from progenitors in the ciliary margin zone (CMZ). Whether the mammalian CMZ provides the neural retina with retinal cells is controversial. Live imaging of embryonic retina expressing eGFP in the CMZ shows that cells migrate laterally from the CMZ to the neural retina where differentiated retinal ganglion cells (RGCs) reside. Because Cyclin D2, a cell-cycle regulator, is enriched in ventral CMZ, we analyzed Cyclin D2-/- mice to test whether the CMZ is a source of retinal cells. Neurogenesis is diminished in Cyclin D2 mutants, leading to a reduction of RGCs in the ventral retina. In line with these findings, in the albino retina, the decreased production of ipsilateral RGCs is correlated with fewer Cyclin D2+ cells. Together, these results implicate the mammalian CMZ as a neurogenic site that produces RGCs and whose proper generation depends on Cyclin D2 activity.

Keywords: Cyclin D2; binocular vision; ciliary margin zone; contralateral RGCs; ipsilateral RGCs; neurogenesis; retina; retinal progenitors.


Figures

Figure 1
Figure 1. Spatiotemporal expression of eGFP in the CMZ and peripheral neural retina of Tg(Zic2eGFP) embryos
A. Scheme of an embryonic mouse head showing the orientation of coronal sections. B. Retinal section of a E14.5 Tg(Zic2eGFP) embryo showing eGFP staining in dorsal and ventral peripheral retina. C–D. E14.5 Tg(Zic2eGFP) embryo stained for Islet1 reveals that some RGCs in the peripheral retina express eGFP in both the dorsal and the ventral retina (white arrowheads). E–H. Zic2 staining in ventral retinal sections of Tg(Zic2eGFP) embryos at the indicated stages show that eGFP colocalizes with Zic2 in the CMZ and peripheral neural retina but that many Zic2+ cells within the peripheral neural retina are not eGFP positive (white arrowheads). I–L. Brn3a staining in retinal sections of Tg(Zic2eGFP) embryos at the indicated stages shows that some Brn3a+ cells are also eGFP+ in both dorsal and ventral retina (open arrowheads), while some Brn3a+ are eGFP (white arrowheads). Note the gap of Brn3a+ cells in the ventral retina (white arrows in panels J and L). Scale bar 50 µm.
Figure 2
Figure 2. A population of cells in the proximal CMZ at E14.5 moves laterally towards the neural retina
A–C. Expression of BMP4, Msx1 and Cyclin D2 in ventral retinal sections at E14.5. BMP4 is expressed in the most distal part of the CMZ while Msx1 and Cyclin D2 label a more proximal region of the CMZ. In turn, Msx1 and Cyclin D2 show complementary patterns of expression along the apico-basal axis: Msx1 is enriched in the most apical (deep) part of the CMZ whereas the majority of Cyclin D2+ cells are localized in the basal (superficial) aspect of the CMZ. D. Schematic drawing summarizing the domains of the CMZ delineated by the expression of BMP4 (grey), Msx1 and Cyclin D2 (blue). E–E´. Initial and final frames of a time-lapse sequence from a ventral retinal section of a E14.5 Tg(Zic2eGFP) embryo. Circles in E and E´ indicate the initial and final position of the tracked cells respectively. Yellow circles indicate cells that follow a radial trajectory and blue circles cells that follow a lateral trajectory (see panels F-H). F. Representative examples of cell trajectories in a retinal section. Note that the majority of the cells showing a lateral trajectory (blue tracings) are located in the basal region of the proximal CMZ (Msx1+ region, indicated in blue in the diagram) G. Scheme to describe the criteria for categorizing individual cell trackings into radial or lateral trajectories. The CMZ was divided into two regions: the distal (65 µm from the tip,) and the proximal region (75 µm towards the central retina) by drawing a line parallel to the retinal surface (grey and blue lines respectively). A line perpendicular to the surface of the retina (orange line) was defined by the apico-basal columns of progenitors visualized by eGFP staining. The proximal region was divided into three segments by drawing three equidistant lines 25 µm apart at the basal surface of the retina (blue line) and three equidistant lines of 50 µm at the apical surface (green line). Dashed-grey lines limit each segment, and were used as a reference where to align 90° angles in each segment. H. Individual cell trackings were classified within each segment according to the angles defined in panel G. Cells moving in a trajectory with an angle between 0 and 45° from the vertical axis were categorized as radially migrating, and cells with an angle between 45° and 90° were categorized as laterally migrating. I. Quantification of radial and lateral trajectories of tracked cells within the distal and the proximal regions of the CMZ. Cells arising from the most distal region of the CMZ display a radial trajectory, whereas a significant number of cells arising from the proximal region of the CMZ move laterally. Scale bar 50 µm.
Figure 3
Figure 3. The mitotic marker PH3 shows reduced proliferation in ventral CMZ of Cyclin D2−/− mice relative to wild type littermates
A, D. Dorsal and ventral retinal sections of Cyclin D2−/− mice and wild type littermates labeled with the mitotic marker PH3 (red) at E13.5 and E14.5. Quantification of PH3+ cells was performed in the retinal regions delineated by the boxed regions in the micrographs: Ciliary Marginal Zone (CMZ) and Neural Retina (NR). B, E. Quantification of PH3+ cells in the NR region of ventral and dorsal retina of Cyclin D2−/− and wild type littermates at E13.4 and E14.5, respectively. Although we identified a trend of fewer PH3+ cells in the NR region of Cyclin D2−/− mice at E14.5, this difference does not reach significance. There are comparable numbers of cells undergoing mitosis in the NR region of both dorsal and ventral retina of Cyclin D2−/− mice and wild type littermates at E13.5 and E14.5. C, F. Quantification of PH3+ cells in the CMZ region of ventral and dorsal retina of Cyclin D2−/− and wild type littermates at E13.4 and E14.5, respectively. Significantly fewer cells undergo mitosis in the ventral CMZ of Cyclin D2−/− mice compared with wild type littermates at E13.5 and E14.5. No differences were observed in the corresponding dorsal CMZ. Student´s two-tailed unpaired t-test. Error bars mean ±SEM. ns, non significant, p>0.05; * p<0.05; ** p<0.01. Scale bar 40 µm.
Figure 4
Figure 4. Fewer ipsilateral RGCs are born from E12-14 and fewer contralateral RGCs are born at E11 in ventrotemporal (VT) retina of Cyclin D2−/− mice
A. Time line of EdU birth dating experiments. Three injections of EdU (10am, 2pm and 6pm) were administered at E12, E13 or E14. Embryos were analyzed at E15.5, age at which maximum expression of Zic2 is detected. B. Representative retinal sections of Cyclin D2−/− and wild type littermates injected with EdU at E13 to E15.5 and labeled with Zic2 (blue), Islet1 (green) and EdU (green). Representative sections injected with EdU at E12 or E14 can be found in S4. C. Left Panel: Quantification of Zic2+/Islet1+/EdU+ RGCs in VT retina of Cyclin D2−/− and wild type littermates when EdU was injected at E12, E13 or E14. There is a consistent and significant reduction of ipsilateral RGCs born at E12, E13 and E14 in the Cyclin D2−/− mice when compared to wild type littermates. Right Panel: Quantification of Zic2/Islet1+/EdU+ RGCs in VT retina of Cyclin D2−/− and wild type littermates. Comparable numbers of contralateral RGCs were born in both genotypes from E12-14. D. Time line of EdU injection for birthdate analysis of contralateral RGCs. Three EdU injections were administered at E11, and embryos were analyzed at E15.5. E. Retinal sections of Cyclin D2−/− and wild type littermates injected with EdU at E11 to E15.5 and labeled with Brn3a (red), Brn3 (blue) and EdU (green). F. Quantification of Brn3a+/Brn3+/EdU+ RGCs in VT and DT retina of Cyclin D2−/− and wild type littermates. Fewer contralateral (Brn3a+) RGCs were born at E11 in VT retina of mutant mice. No differences were observed in DT retina of Cyclin D2−/− and wild type mice. Student´s two-tailed unpaired t-test. Error bars mean ±SEM. ns, non significant p>0.05; * p<0.05; ** p<0.01; **** p<0.0001. Scale bar 40 µm.
Figure 5
Figure 5. Cyclin D2 is necessary for the generation of subsets of RGCs
A. Wild type and Cyclin D2−/− retinal sections at E15.5 labeled with antibodies against Zic2 (red) and Islet1 (green), indicating ipsilateral and differentiated RGCs, respectively. B. Quantification of Zic2+/Islet1+ cells in VT retina of Cyclin D2−/− and wild type littermates at E14.5, E15.5, E16.5 and E17.5. Vertical axis indicates the average number of Zic2+/Islet1+ cells per section throughout the ventral retina of Cyclin D2−/− mice and wild type littermates. The number of ipsilateral RGCs is significantly reduced in Cyclin D2−/− mice at E15.5 but not at the other ages analyzed. C. Ventral views of representative whole mount preparations of Cyclin D2−/− mice and wild type littermates labeled monocularly with DiI at E17.5. Red arrow indicates fewer ipsilateral axons in the optic tract of the Cyclin D2−/− mouse. D. Quantification of the ipsilateral projection through the optic chiasm indicates a significant reduction of ipsilateral axons in Cyclin D2−/− mice at E17.5. E. Immunolabeling of wild type and mutant Cyclin D2 retinal sections with the contralateral RGC marker Brn3a (red) and the pan-RGC marker Brn3 (green) at E14.5. F. Quantification of Brn3a+/Brn3+ cells shows a significant reduction of cRGCs in VT retina of Cyclin D2−/− mice at E14.5. No significant difference was observed in dorsotemporal (DT) retina. G. Quantification of Islet1+ cells show a significant reduction in the total number of differentiated RGCs in VT retina of Cyclin D2−/− mice at E14.5. Student´s two-tailed unpaired t-test. Error bars mean ±SEM. ns, non-significant, p>0.05; * p≤0.05; ** p≤0.01. Scale bar 40 µm in A and E; and 200 µm in C.
Figure 6
Figure 6. Albino retinas have fewer Cyclin D2+ cells and reduced proliferation when compared with pigmented littermates
A. Cyclin D2 staining in ventral retinal sections of pigmented and albino littermates at E14.5 and E15.5. Pigmented and albino mice were crossed to Tg(Zic2eGFP) mice to delineate the CMZ by eGFP expression. Quantification of the number of Cyclin D2+ cells in Tg(Zic2eGFP) retinal sections from E14.5 and E15.5 albino retinas compared with their pigmented controls showed a significant reduction in the ventral retina of albino embryos at both E14.5 and E15.5. B. Zic2 staining at E16.5 in ventral retinal sections of pigmented and albino littermates crossed to the reporter line Tg(Zic2eGFP). Quantification of the number of Zic2+/eGFP+ cells in E16.5 Tg(Zic2eGFP) retinal sections show a reduction in albino retinas compared with their pigmented controls. C. PH3 staining in retinal sections of albinos and pigmented embryos at E14.5. The large square includes the CMZ while the three smaller squares were placed equidistant from each other along the neural retina (NR). Areas inside these squares were used to quantify the number of PH3+ cells in each region. D. Quantification of PH3+ cells in the CMZ and the neural retina of E14.5 embryos shows a significant reduction of mitotic cells in the ventral CMZ of albino compared to pigmented embryos. Student´s unpaired t-test; Error bars mean ±SEM, *p<0.05; **p<0.01; ***p<0.001; ns, non significant. Scale bar 50 µm.
Figure 7
Figure 7. Model of RGCs neurogenesis in the CMZ
In the CMZ, progenitor cells arise from the Msx1+/Cyclin D2+ proximal zone at the periphery of the retina. Two separate and parallel pools of RGC progenitors may co-exist in the retina: One that resides in the deep layers of the neural retina, responsible for the production of the majority of RGCs and where cells divide and migrate radially, and another which resides in the CMZ, whose differentiation into RGCs occurs in a Cyclin D2-dependent manner and from which cells translocate tangentially into the neural retina. Future experiments will determine whether these two proliferative pools are distinct and their respective progeny differ from one other in terms of cell identity and of axonal projection. Overall, these various niches could contribute to cell subtype diversity in the retina.

Similar articles

Cited by

References

    1. Ahmad I, Tang L, Pham H. Identification of neural progenitors in the adult mammalian eye. Biochem Biophys Res Commun. 2000;270:517–521. - PubMed
    1. Amato MA, Arnault E, Perron M. Retinal stem cells in vertebrates: parallels and divergences. Int J Dev Biol. 2004;48:993–1001. - PubMed
    1. Bhansali P, Rayport I, Rebsam A, Mason C. Delayed neurogenesis leads to altered specification of ventrotemporal retinal ganglion cells in albino mice. Neural Dev. 2014;9:11. - PMC - PubMed
    1. Coles BL, Horsford DJ, Mcinnes RR, Van Der Kooy D. Loss of retinal progenitor cells leads to an increase in the retinal stem cell population in vivo. Eur J Neurosci. 2006;23:75–82. - PubMed
    1. Drager UC. Birth dates of retinal ganglion cells giving rise to the crossed and uncrossed optic projections in the mouse. Proc R Soc Lond B Biol Sci. 1985;224:57–77. - PubMed

Publication types