. 2016 Dec 20;17(12):3246-3255.
doi: 10.1016/j.celrep.2016.11.076.

Calcium Release from Stores Inhibits GIRK

Affiliations

Calcium Release from Stores Inhibits GIRK

Paul F Kramer et al. Cell Rep. .

Abstract

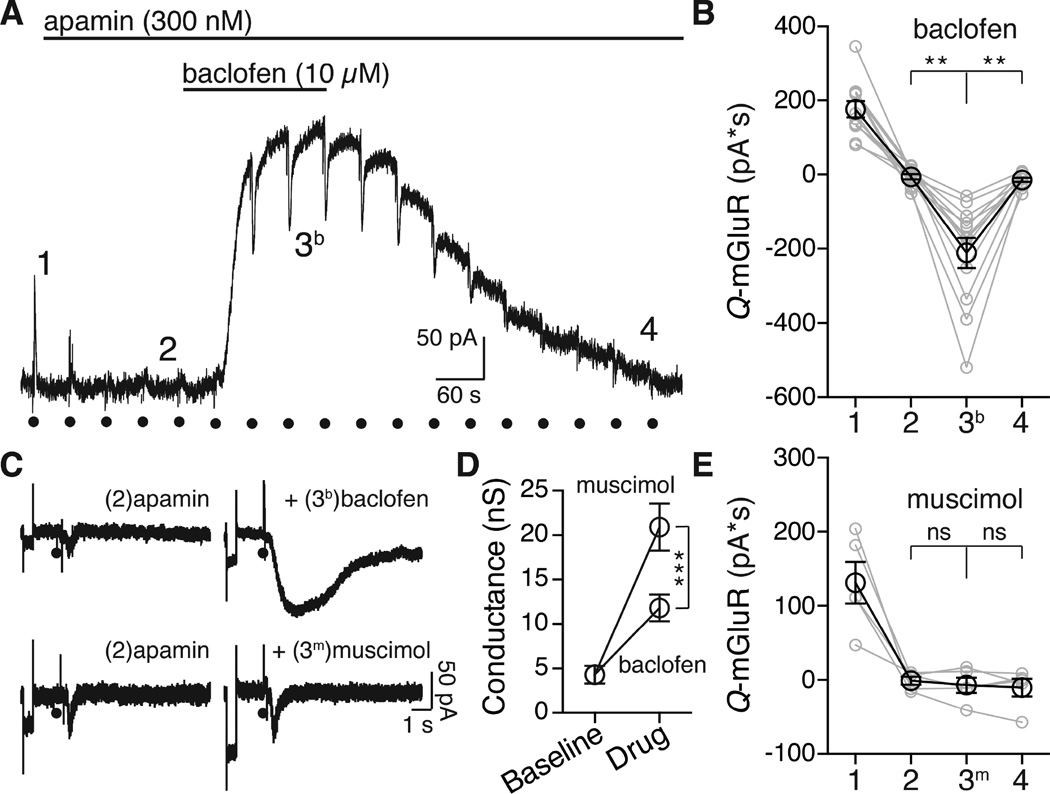
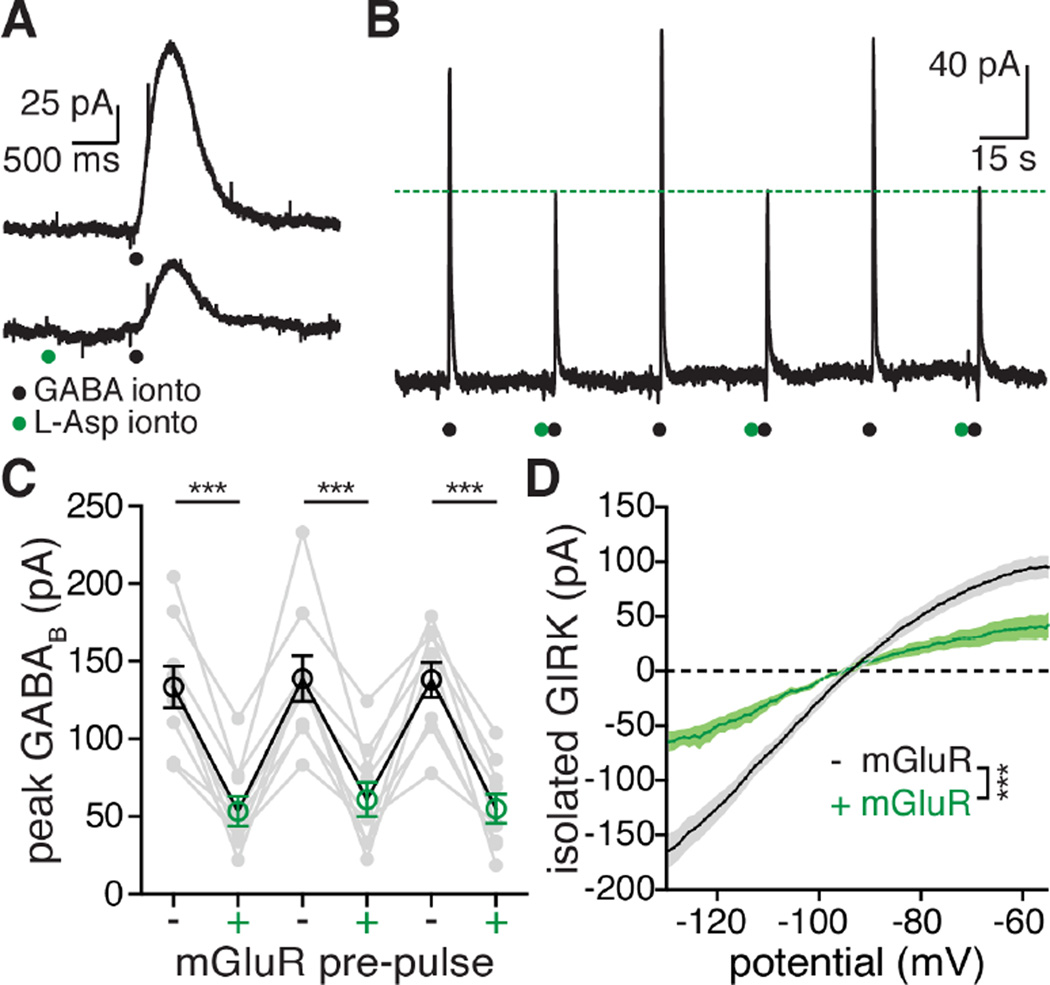
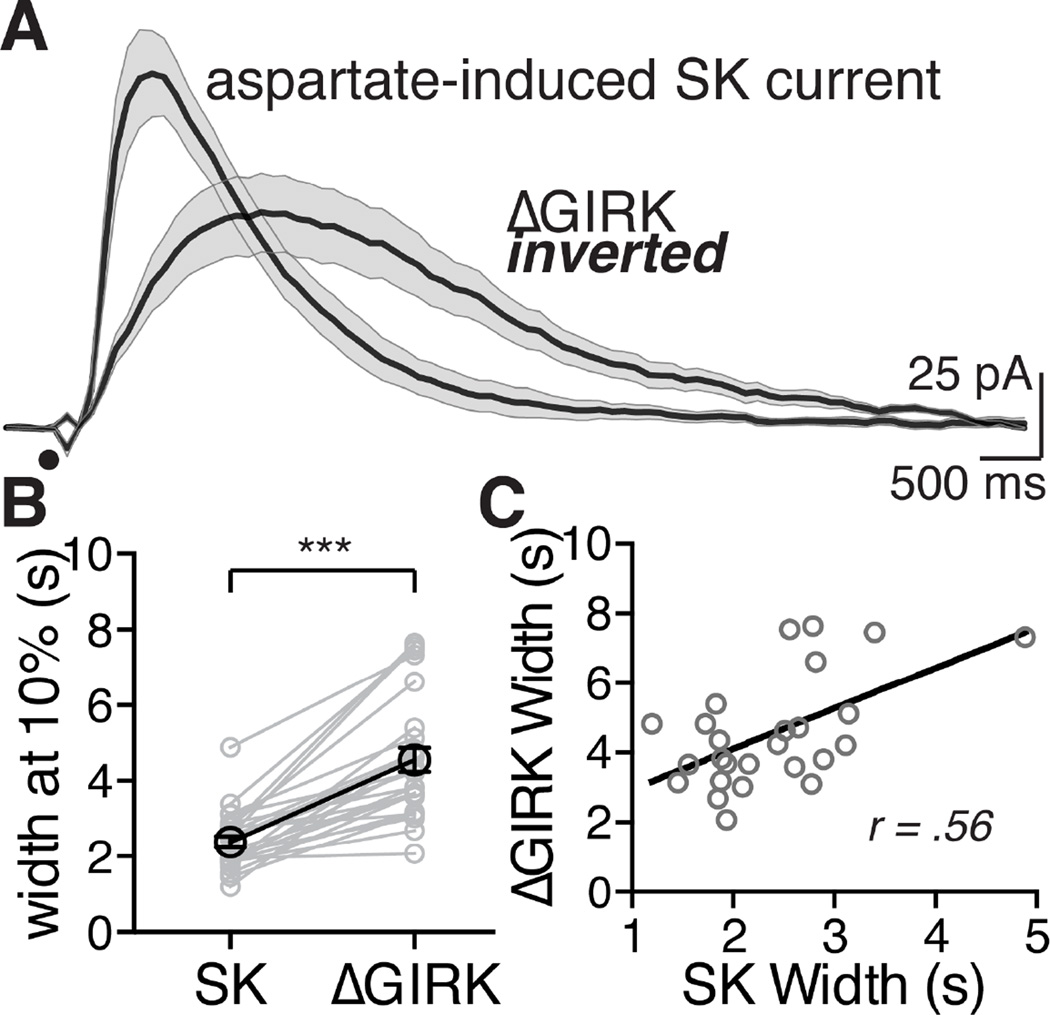
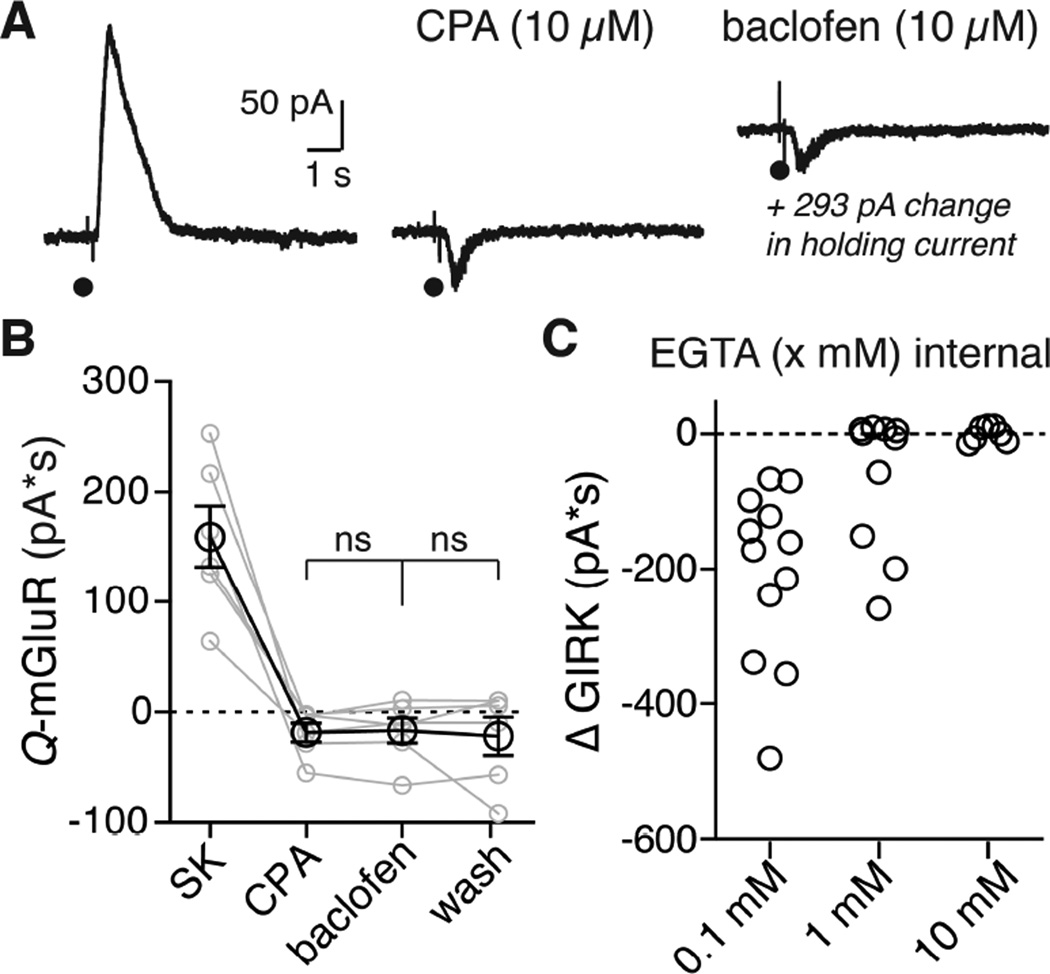
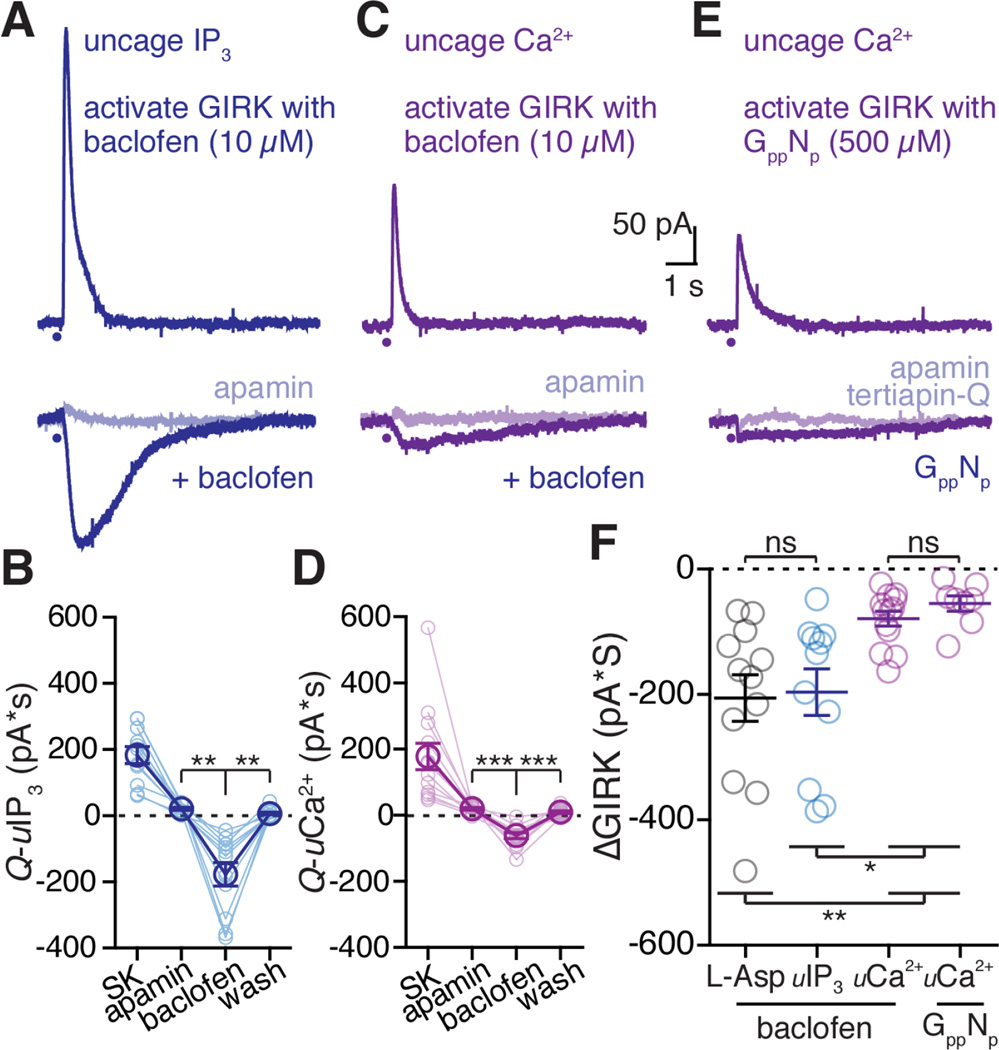
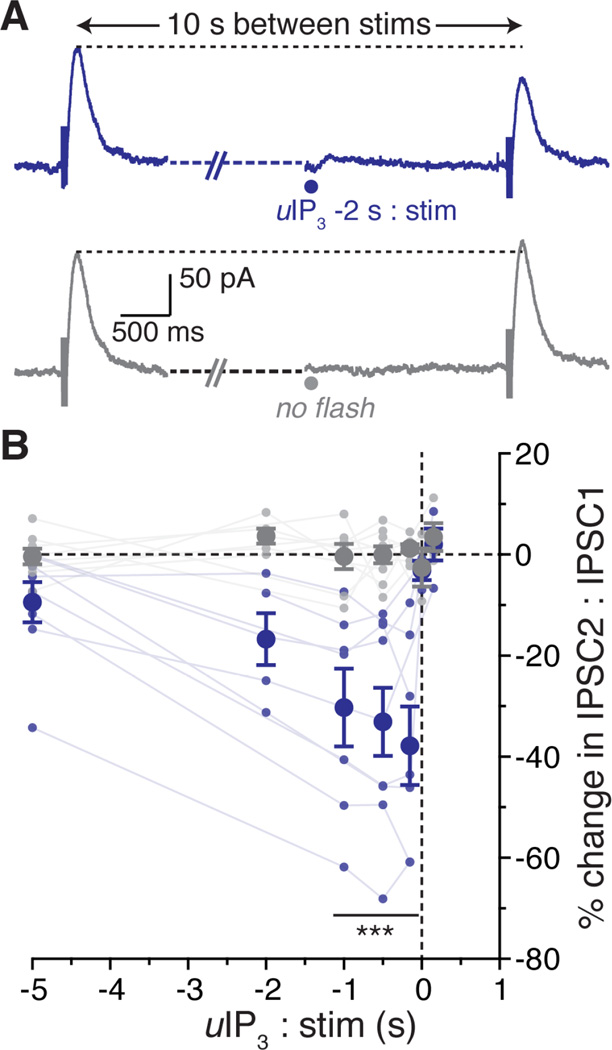
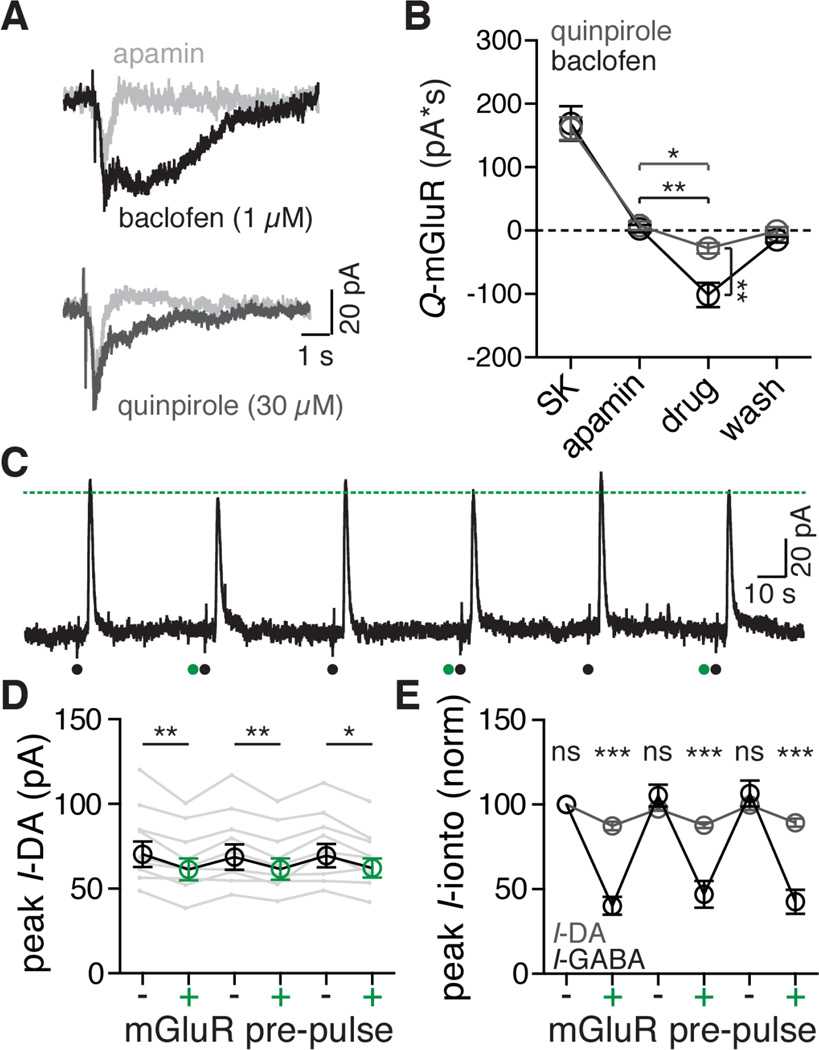
Synaptic transmission is mediated by ionotropic and metabotropic receptors that together regulate the rate and pattern of action potential firing. Metabotropic receptors can activate ion channels and modulate other receptors and channels. The present paper examines the interaction between group 1 mGluR-mediated calcium release from stores and GABAB/D2-mediated GIRK currents in rat dopamine neurons of the Substantia Nigra. Transient activation of mGluRs decreased the GIRK current evoked by GABAB and D2 receptors, although less efficaciously for D2. The mGluR-induced inhibition of GIRK current peaked in 1 s and recovered to baseline after 5 s. The inhibition was dependent on release of calcium from stores, was larger for transient than for tonic currents, and was unaffected by inhibitors of PLC, PKC, PLA2, or calmodulin. This inhibition of GABAB IPSCs through release of calcium from stores is a postsynaptic mechanism that may broadly reduce GIRK-dependent inhibition of many central neurons.

Keywords: D2; GABA(B); GIRK inhibition; IP(3); calcium; dopamine neurons; group I mGluR.


Figures

Figure 1
Figure 1. mGluR activation induced an inward current during GABABR but not GABAAR currents
A. Representative trace of a voltage clamp whole cell recording showing the block of the SK current by application of apamin (300 nM), followed by application of baclofen (10 µM). The numbers (1, 2, 3, and 4) correspond to time points plotted in B. Black circles represent the activation of mGluRs with aspartate iontophoresis. B. Quantification across cells of the total charge transfer for the mGluR-activated current at baseline (1), after apamin (2) during baclofen (3b) after washout (4). In the presence of baclofen aspartate resulted in a ΔGIRK inward current (one-way repeated measures ANOVA followed by Tukey test, n = 12 cells). C. Representative episodic traces showing application of aspartate (indicated by the black circle), in apamin (left) showing the small non-selective cation conductance and during either baclofen (black, top) or muscimol (grey, bottom) treatment. Each episode begins with a 3 mV step to assay whole cell conductance (Figure 1C). D. Quantification of the change in cell conductance. Both baclofen and muscimol caused a significant increase in the conductance (two-way repeated measure ANOVA followed by Bonferroni, n = 7 for muscimol, 11 for baclofen). The increase was significantly larger for muscimol than for baclofen (two-way repeated measure ANOVA followed by Bonferroni). E. Comparison between cells of the aspartate induced current on baclofen or muscimol application. Muscimol and baclofen were not significantly different at baseline (1, p = .94), after apamin (2, p > 0.99), or after washout (4, p > 0.99). In muscimol the aspartate-induced current was not different from apamin or washout (p > 0.99). All statistics were conducted with a two-way repeated measures ANOVA followed by a Bonferroni. n = 5 (muscimol), n = 12 (baclofen), **p < 0.01, ***p < 0.001, bars and summary data points represent means ± s.e.m. in B. each dot indicates a single cell. See also Figure S3
Figure 2
Figure 2. mGluR activation decreases GABABR GIRK currents by closing GIRK channels
A. Representative traces (average of three raw traces for each condition) showing the effect of an mGluR pre-pulse (green dots) on the GIRK current mediated by GABAB receptor activation (black dots). B. Representative chart record from a whole-cell recording showing iontophoresis of GABA (black circles) every 45 seconds. Aspartate (green circle) was applied by iontophoresis one second before every other application of GABA. These experiments were done in the presence of apamin (100–300 nM), as well as GABAA and AMPA receptor blockers (see methods). C. Grouped data across cells showing the effect of an mGluR pre-pulse (green) one second before GABA on the peak GABABR GIRK current. In black are grouped traces where there was no mGluR pre-pulse. Each grey dot represents an individual cell, black and green circles are means ± s.e.m. Statistics were performed with a one-way repeated measures ANOVA followed by a Bonferroni test, n = 8 cells, ***p ≤ 0.001. D. I–V plots of the GABAB mediated GIRK current grouped across cells with (green) and without (black) pre-application of aspartate. Each dot on the I–V plot represents the mean, shaded area around the curves represents s.e.m. Statistics were performed with a one-way repeated measures ANOVA, n = 6 cells, ***p < 0.001 (interaction between voltage and mGluR pre-pulse). See also Figure S5
Figure 3
Figure 3. The mGluR-mediated SK current and ΔGIRK inward current have different kinetics and are correlated
A. Averaged traces of currents (SK and ΔGIRK) following iontophoresis of aspartate (black circle). Each trace is an average of 12 cells, the shaded area around the mean value represents s.e.m. ΔGIRK current is inverted to compare the timescale to SK. B. Within-cell comparison of the width at 10% of the peak for the SK current and the corresponding ΔGIRK current for that cell. ΔGIRK was significantly longer at 10% of the peak than SK. ***p < 0.001, statistics were performed with a two-tail paired t-test. C. Comparing within-cell the width of the SK versus the width (both at 10%) of the ΔGIRK reveals a significant positive correlation, analyzed with a Pearson correlation test, p < 0.01, r = 0.56, n = 26 cells for B and C.
Figure 4
Figure 4. Inhibition of GIRK requires calcium release from stores
A. Representative traces showing the currents elicited by aspartate iontophoresis at baseline (left), after CPA (10 µM, middle), and during baclofen (10 µM, right). In this example, baclofen elicited a standing outward current of 293 pA (not pictured to scale). B. Grouped data showing the aspartate induced current at baseline, after CPA, during baclofen and after washout. Treatment with CPA blocked the aspartate induced a ΔGIRK inward current during baclofen. Each grey dot represents a single cell, lines connect treatments within a cell. Black circles are means ± s.e.m. Statistics were performed with a repeated measures two-way ANOVA followed by a Bonferroni test, ns = not significant (p > 0.99), n = 6 cells. C. Comparison of the ΔGIRK charge during baclofen (10 µM) with different concentration of EGTA in the internal solution. In EGTA (0.1 mM) there is always a ΔGIRK current (12/12 cells). In 1 mM EGTA there is a ΔGIRK current in 4/10 cells. In 10 mM EGTA the ΔGIRK (0/7 cells) was completely blocked. See also Figure S4 and S6
Figure 5
Figure 5. Receptor activation is not required for GIRK inhibition
A. Representative traces from a whole cell voltage clamp recording using photolytic release (405 nM LED pulse) of caged IP3 (100 µM) in control (top trace), after application of apamin (bottom light blue trace) and following superfusion of baclofen (10 µM, blue trace). B. Quantified data across cells of all caged-IP3 flash photolysis experiments. Light blue traces represent data from a single cells, dark blue represents mean data ± s.e.m. Statistics performed with a one-way repeated measures ANVOA followed by a Bonferroni, **p < 0.01, n = 11 cells. C. Representative traces from a whole cell voltage clamp recording using photolytic release (365 nM LED pulse) of calcium with DMNPE-4 (1 mM). Top trace shows direct activation of SK, bottom trace (light purple) after apamin, and bottom trace (purple) following superfusion of baclofen (10 µM). D. Quantified data across all caged-Ca2+ photolysis experiments. Light purple connected circles represent a data from a single cell, dark purple represents mean averaged data ± s.e.m. Statistics performed with a one-way repeated measures ANOVA followed by a Bonferroni test, ***p < 0.001, n = 13. E. Representative traces from a whole cell voltage clamp recording using photolytic release of calcium with DMNPE-4. The internal solution also contained GppNHp (GppNp, 500 µM) that activated GIRK. Top trace is the SK current induced by photolysis of DMNPE-4. Bottom trace (light purple) is following treatment with apamin. Bottom trace is the decrease in GIRK induced by calcium at the peak of the outward current induced by GppNHp. F. Comparing the ΔGIRK charge transfer (baseline subtracted) for GIRK currents activated with baclofen (10 µM) and calcium released via aspartate (black), photolysis of caged-IP3 (blue) or photolysis of DMNPE-4 (purple, left), and for GIRK currents activated with GppNHp and calcium released by photolysis of DMNPE-4 (purple, right). Each circle represents a single cell, bars are the mean value ± s.e.m. ns = not significant. Statistics performed with a one-way ANOVA followed by a Tukey test. *p<0.05, **p<0.01, n = 12 (ionto), n = 11 (IP3), n = 13 (DMNPE-4, baclofen), n = 8 (DMNPE-4, GppNHp) cells.
Figure 6
Figure 6. Calcium release from stores inhibits GABAB IPSCs
A. Representative trace showing GABABR IPSCs evoked with a monopolar stimulating electrode (100 Hz, 5 pulses) in pairs with a 10 second inter-stimulus interval. Photolysis of caged-IP3 (blue dot, 405 nm, 30–100 ms) was applied at differing times between the pair of stimulations. Experiments were interleaved with traces where IP3 was not applied (lower trace, grey). B. Each small dot represents a data point from a single cell (average of three repetitions), connected by a line to show a within-cell data set. Points were averaged across cells (large dots). Pairs where IP3 was released before the second stimulation are in blue, traces with no flash are in grey. Error bars represent s.e.m. Statistics were performed with a two-way repeated measures ANOVA followed by a Bonferroni test. ***p < 0.001, n = 3 – 9 cells per averaged data point.
Figure 7
Figure 7. mGluR-induced calcium release inhibits D2R mediated GIRK currents less than GABAB
A. Representative traces of currents induced by iontophoresis of aspartate in the presence of apamin (300 nM, light gray), baclofen (1 µM, top trace, black), and quinpirole (30 µM, bottom trace, black). B. Quantified data across cells comparing the aspartate induced mGluR currents at baseline (SK), after apamin (300 nM), in either quinpirole (30 µM, grey) or baclofen (1 µM, black), and upon washout or reversal of the agonist. Both quinpirole and baclofen resulted in a decrease in GIRK current relative to apamin. Statistics were performed with two one-way ANOVAs followed by a Bonferroni test. *p < 0.05, **p < 0.01, n = 8 (quinpirole), n = 7 (baclofen), points represent means ± s.e.m. C. Representative trace from a dual iontophoresis protocol with dopamine (black dot) and aspartate (green dot) in the presence of apamin (300 nM). Dotted green line indicates the peak of the GIRK current induced by iontophoretic application of dopamine following application of aspartate. Aspartate iontophoresis caused a consistent decrease the D2R–mediated current. D. Grouped data showing the peak amplitude of the dopamine D2 receptor-mediated GIRK current with (green) and without (black) iontophoretic application of aspartate one second before dopamine iontophoresis in the presence of apamin (300 nM). Statistics were performed with a one-way repeated measures ANOVA followed by a Bonferroni test, *p < 0.05, **p < 0.01, n = 9 cells. Grey traces indicate within-cell data for single neurons, circles (black and green) ± s.e.m. E. Grouped data for all dopamine (grey) and GABA (black) dual iontophoresis experiments, normalized to the peak amplitude of the first pulse. Data points indicate means ± s.e.m. Statistics were performed with a two-way repeated measures ANOVA followed by a Bonferroni test, ***p < 0.001, ns = not significant (p > 0.99), n = 9 cells for both groups. See also Figure S7

References

    1. Arora D, Haluk DM, Kourrich S, Pravetoni M, Fernández-Alacid L, Nicolau JC, Luján R, Wickman K. Altered neurotransmission in the mesolimbic reward system of Girk−/− mice. Journal of Neurochemistry. 2010;114:1487–1497. - PMC - PubMed
    1. Arora D, Lujan R, Hearing M, Haluk DM, Mirkovic K, Fajardo-Serrano A, Wessendorf MW, Watanabe M, Wickman K. Acute Cocaine Exposure Weakens GABAB Receptor-Dependent G-Protein-Gated Inwardly Rectifying K+ Signaling in Dopamine Neurons of the Ventral Tegmental Area. Journal of Neuroscience. 2011;31:12251–12257. - PMC - PubMed
    1. Beckstead MJ, Grandy DK, Wickman K, Williams JT. Vesicular dopamine release elicits an inhibitory postsynaptic current in midbrain dopamine neurons. Neuron. 2004;42:939–946. - PubMed
    1. Beckstead MJ, Williams JT. Long-term depression of a dopamine IPSC. Journal of Neuroscience. 2007;27:2074–2080. - PMC - PubMed
    1. Degro CE, Kulik A, Booker SA, Vida I. Compartmental distribution of GABAB receptor-mediated currents along the somatodendritic axis of hippocampal principal cells. Frontiers in Synaptic Neuroscience. 2015;7:1–15. - PMC - PubMed

Publication types

MeSH terms

LinkOut - more resources