. 2016 Dec 20;17(12):3281-3291.
doi: 10.1016/j.celrep.2016.11.072.

Human Beta Cells Produce and Release Serotonin to Inhibit Glucagon Secretion from Alpha Cells

Affiliations

Human Beta Cells Produce and Release Serotonin to Inhibit Glucagon Secretion from Alpha Cells

Joana Almaça et al. Cell Rep. .

Abstract

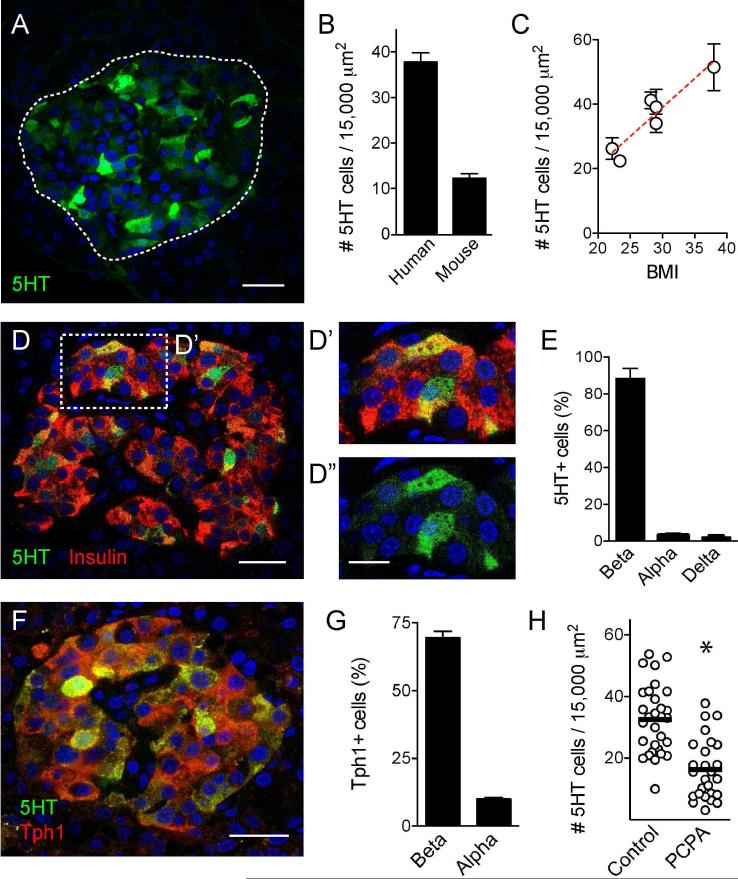
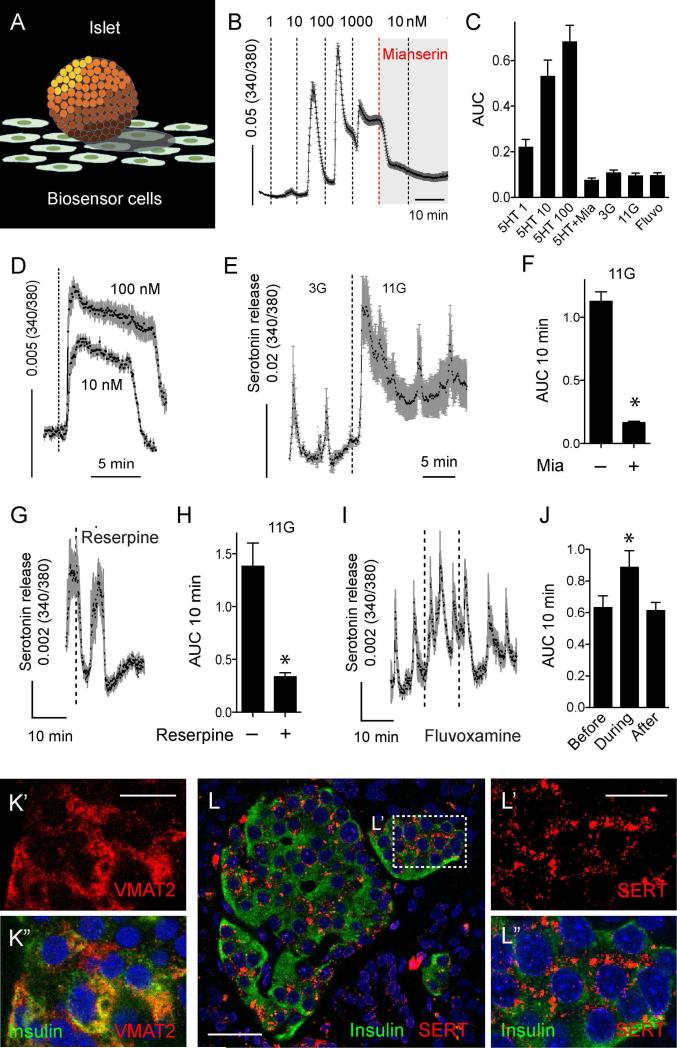
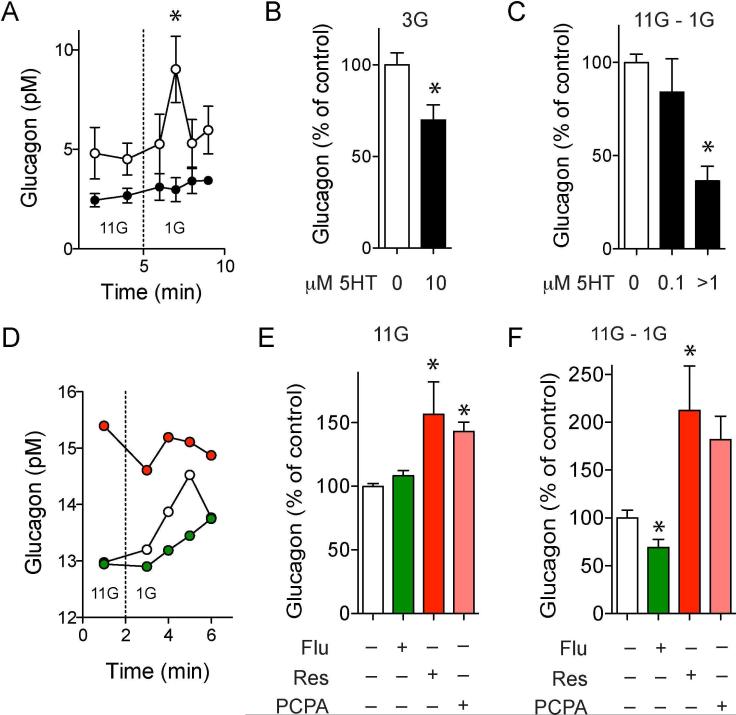
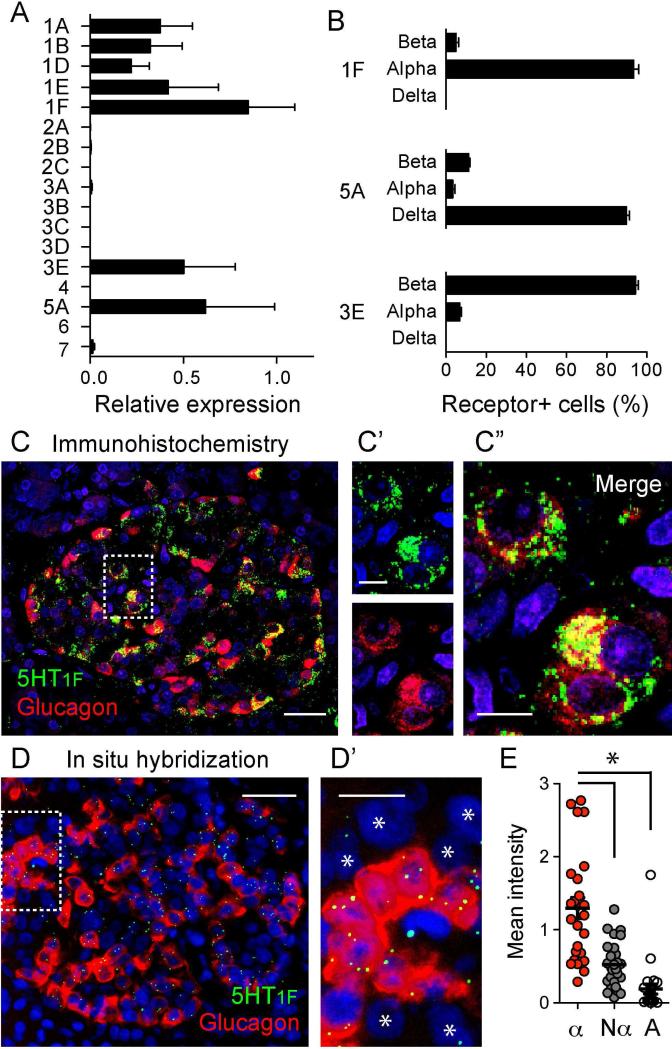
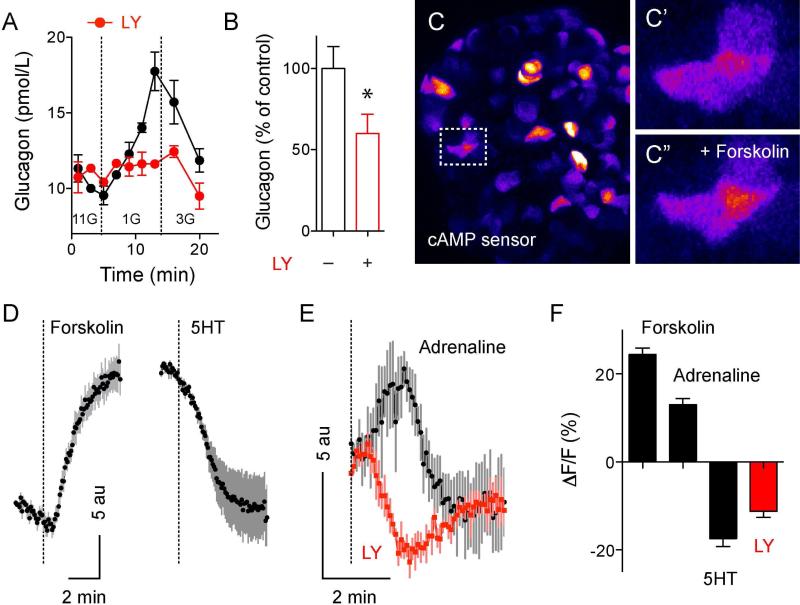
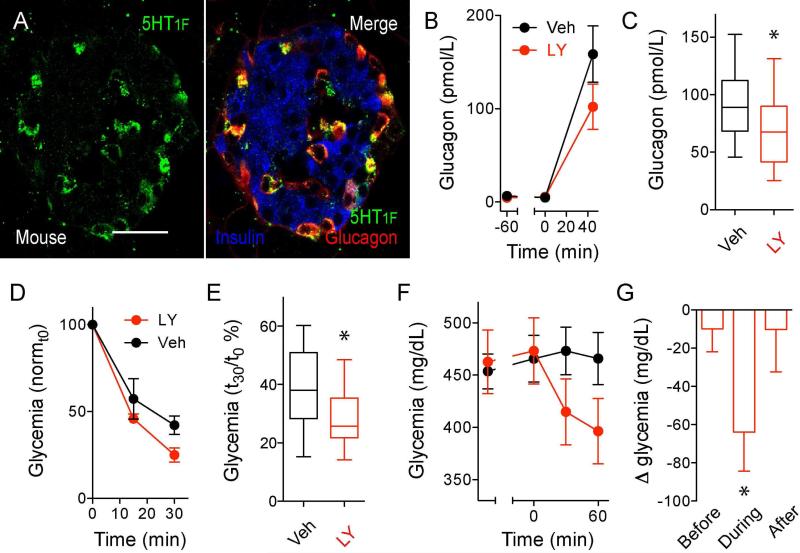
In the pancreatic islet, serotonin is an autocrine signal increasing beta cell mass during metabolic challenges such as those associated with pregnancy or high-fat diet. It is still unclear whether serotonin is relevant for regular islet physiology and hormone secretion. Here, we show that human beta cells produce and secrete serotonin when stimulated with increases in glucose concentration. Serotonin secretion from beta cells decreases cyclic AMP (cAMP) levels in neighboring alpha cells via 5-HT1F receptors and inhibits glucagon secretion. Without serotonergic input, alpha cells lose their ability to regulate glucagon secretion in response to changes in glucose concentration, suggesting that diminished serotonergic control of alpha cells can cause glucose blindness and the uncontrolled glucagon secretion associated with diabetes. Supporting this model, pharmacological activation of 5-HT1F receptors reduces glucagon secretion and has hypoglycemic effects in diabetic mice. Thus, modulation of serotonin signaling in the islet represents a drug intervention opportunity.

Keywords: alpha cell; beta cell; diabetes; glucagon secretion; insulin secretion; pancreatic islet; paracrine signal; serotonin.


Figures

Figure 1
Figure 1. Beta cells in human pancreatic islets synthesize serotonin
(A) Z-stack of confocal images of a human islet in a pancreatic section immunostained for serotonin (5HT, green). Dashed line indicates islet. (B) Estimation of the number of serotonin positive cells per islet area in human and mouse islets. Bars represent average ± SEM. (C) The number of serotonin-positive cells divided by the islet area shows a positive correlation with donor BMI (r2 = 0.2854, p value < 0.0001). (D) Confocal image of a human pancreatic islet showing serotonin (green) and insulin (red) immunostaining. Double-labeled cells appear yellow. D’ and D” are higher magnifications of the islet region delimited by box in D, double labeled or single labeled for 5HT. (E) Quantification of the percentage of serotonin-positive cells also expressing insulin (beta), glucagon (alpha) or somatostatin (delta). (F) Confocal image of a human pancreatic islet showing serotonin (green) and tryptophan hydroxylase 1 (Tph1, red) immunostaining. All serotonin-positive cells expressed Tph1. (G) Quantification of the percentage of Tph1-positive cells that are beta or alpha cells. (H) Quantification of the number of serotonin-positive cells in human islets incubated in culture medium alone or in the presence of the Tph1 inhibitor p-Chlorophenylalanine (PCPA) (10 μM, 2h, 37°C). PCPA treatment significantly reduced the number of serotonin-positive cells. * p value < 0.05 Unpaired Student's t test. Scale bars represent 20 μm (A, D and F) and 10 μm (D’ and D”).
Figure 2
Figure 2. Human beta cells release serotonin upon stimulation with high glucose and express components of serotonergic machinery
(A) 5HT biosensors are CHO cells that stably express 5-HT2C receptors and can detect serotonin secretion in real time from islets placed in close proximity. Responses in biosensors are recorded by loading them with fura-2 and imaging [Ca2+]i. (B) In the absence of human islets, serotonin biosensors respond to direct application of serotonin (1, 10, 100 and 1000 nM), and responses are inhibited by the 5-HT2C receptor antagonist mianserin (Mia, 10 μM). (C) Quantification (area under the curve (AUC)) of biosensor responses in the absence of human islets to 2 min application of serotonin (1, 10, 100 nM), 10 nM serotonin in the presence of mianserin (5HT+Mia), 10 min incubation in basal (3 mM, 3G) or high (11 mM, 11G) glucose concentration, or in the presence of the serotonin transporter (SERT) inhibitor fluvoxamine (500 nM) in 3G. (D) [Ca2+]i remains elevated in biosensor cells during prolonged exposure to serotonin solutions (10 and 100 nM) in the absence of islets. (E) In the presence of human islets, biosensor cells respond to an increase in glucose concentration (from 3 mM to 11 mM). See also Figure S2 for comparison of glucose-induced serotonin secretion from mouse versus human islets. (F) Biosensor responses to high glucose were inhibited by mianserin (Mia), indicating serotonin secretion upon beta cell activation. (G) Inhibition of serotonin secretion from human islets with the VMAT2 inhibitor reserpine (100 nM, n = 12 cells, 3 different islet preparations). Reserpine abolished serotonin release in every experiment. (H) Summary of data from experiments such as those shown in (G) showing AUC values of 10 min recordings before and after reserpine application. (I) Increase in serotonin levels by application of fluvoxamine (500 nM, n = 21 cells using 3 islet preparations). (J) Summary of data from experiments such as those shown in (I) showing AUC values of 10 min recordings before, during, and after fluvoxamine application. (K) Confocal image of a region in a human islet in a pancreatic section immunostained for VMAT2 (red, K’) and insulin (green, merged image in K”). (L) Confocal image of a human islet in a pancreatic section immunostained for SERT (red) and insulin (green). L’ and L” are higher magnifications of the islet region delimited by box in L, double labeled or single labeled for SERT (merged image in L”). In all panels bar graphs show mean ± SEM, * p value < 0.05 [Paired Student's t test (F, H) and one-way ANOVA followed by multiple comparisons (J)]. Dashed lines denote drug applications. Scale bars represent 20 μm (L) and 10 μm (K’ and L’).
Figure 3
Figure 3. Endogenously released serotonin inhibits glucagon secretion from isolated human islets
(A) Glucagon secretion stimulated by decreasing glucose from 11 mM to 1 mM is inhibited in the presence of serotonin (10 μM, black circles; n = 3 islet preparations). See also Figure S4 for the effect of serotonin on acetylcholine release from alpha cells. (B) Effect of serotonin (10 μM) on glucagon levels at 3 mM glucose concentration (n = 3 islet preparations). (C) Quantification of the total amount of glucagon secreted during the first 10 min after decreasing glucose (area under the curve, AUC) in the presence of different concentrations of exogenous serotonin (n = 3 islet preparations). (D) Representative traces showing the effect of depleting serotonin with reserpine (red) or of increasing serotonin with fluvoxamine (green) on glucagon secretion. Note that reserpine increases glucagon levels at 11 mM glucose. (E) Effect of reserpine, fluvoxamine and Tph1 inhibitor PCPA on basal glucagon levels (at 11 mM; n = 6 islet preparations). (F) Quantification of the total amount of glucagon secreted during the first 10 min after decreasing glucose (AUC) in the presence of reserpine, fluvoxamine or PCPA. Dashed lines indicate the time at which glucose concentration was switched. Responses are presented as percentage of the respective glucagon response of control columns (100%). For comparisons in B, C, E and F we used one-sample t tests to compare the actual mean to a theoretical mean of 100% (control; * p value < 0.05).
Figure 4
Figure 4. Alpha cells express 5-HT1F serotonin receptors
(A) Total RNA was extracted from ~ 400 islets from four different individuals and the expression of 17 serotonin receptor genes was determined by RT-qPCR. The data are normalized to the expression of Rn18s. Each gene was assessed in duplicate. See also Figure S5 for expression of other 5HT receptors. (B) Quantification of the percentage of 5-HT1F, 5-HT5A, and 5-HT3E receptor-expressing cells that are beta, alpha or delta cells. To determine which cell type expresses the different serotonin receptors, we performed double immunostaining of human pancreatic sections. (C) Representative confocal image of a human pancreatic section showing an islet immunostained for the serotonin receptor 5-HT1F (green) and glucagon (red). C’ and C” show zoomed images of the region delimited in C (dashed box). Scale bars represent 20 μm (C) and 10 μm (C’ and C”). See also Figure S6 for changes in 5-HT1F expression in type 2 diabetic pancreases. (D) Frozen human pancreatic sections from 3 donors were analyzed by in situ mRNA hybridization. Shown is a representative epifluorescence image of a human islet probed for the mRNAs encoding 5-HT1F receptor (green) and glucagon (red) (D’) Zoomed image of the islet region delimited in D (dashed box). Other islet cells (non-alpha cells) are indicated with an asterisk. Scale bars represent 20 μm (D) and 10 μm (D’). (E) Quantification of the mean fluorescence intensity of 5-HT1F hybridization signal in regions of interest corresponding to alpha cells (glucagon positive, α), non-alpha cells (islet cells negative for glucagon, Nα) and acinar cells (A). Each dot represents the average of 5-HT1F signal for the different regions of interest of each population per islet. *p value < 0.05 (one-way analysis of variance (ANOVA) followed by a Tukey's Multiple Comparison Test, n > 10 islets, 3 donors). These data show that 5-HT1F is mostly expressed in alpha cells.
Figure 5
Figure 5. Serotonin inhibits glucagon secretion via 5-HT1F receptors and decrease in intracellular cAMP
(A) Glucagon secretion from human islets stimulated by decreasing glucose concentration from 11 mM to 1 mM is inhibited in the presence of the 5-HT1F receptor agonist LY344864 (LY; 100 nM, red circles). (B) Quantification of the total amount of glucagon secreted during the first 10 min after decreasing glucose in the presence of LY344864 (n = 6 experiments from 3 islet preparations). (C) Maximal projection of confocal images of a human islet infected with cAMP green fluorescent sensor (lookup table color scheme was applied). 48h after infection, islet cells show different levels of expression of the cAMP sensor. C’ and C” show zoomed images of the islet region delimited in C (dashed box), before (C’) and 5 min after stimulation with forskolin (10 μM) and IBMX (100 μM) (C”). Fluorescence increases when cAMP levels increase. (D) Representative tracings of mean fluorescence changes in cells labeled with the cAMP sensor induced by forskolin+IBMX (left) or by 5HT (10 μM; right). Black dots reflect the average response and gray lines the SEM for each time point (n = 10 cells). Dashed lines denote drug applications. (E) In cells that exhibited adrenaline-induced (10 μM) increase in cAMP, the 5-HT1F receptor agonist LY344864 (LY; 100 nM) induced a decrease in cAMP (n = 5 cells). (F) Summary of fluorescence changes normalized to baseline fluorescence (%) induced by forskolin+IBMX, adrenaline, 5HT and LY344864 (n = 8-12 cells, 3 coverslips each stimulus).
Figure 6
Figure 6. In vivo inhibition of glucagon secretion with a 5-HT1F receptor agonist
(A) Confocal image of a mouse pancreatic section showing an islet immunostained for the serotonin receptor 5-HT1F (green), glucagon (red), and insulin (blue). 5-HT1F is expressed in alpha cells in mouse islets. Scale bar represent 20 μm. (B) Increases in glucagon plasma levels stimulated by decreasing glycemia with insulin (1 U/kg) are inhibited in the in the presence of LY344864 (1 mg/kg, i.v.; n = 5 mice per group). (C) Quantification of data as in B, showing plasma glucagon levels at 45 min after insulin injection (n = 3 experiments with 5 mice per group each experiment). Responses are shown as percentage of the respective glucagon response of vehicle-treated mice. One-sample t test was used to compare the actual mean to a theoretical mean of 100% (vehicle; *p value < 0.05). (D) Insulin-induced hypoglycemia is exacerbated in the presence of LY344864 (n = 12 mice per group). (E) Quantification of data as in D, showing glycemia at 30 min after insulin injection (n = 12 mice per group, * p value < 0.05 unpaired Student's t-test). (F) Changes in glycemia [relative to vehicle-treated mice (control group)] induced by injection of LY344864 (1 mg/kg, i.v.) in mice rendered diabetic with streptozotocin (200 mg/kg, i.v.). LY344864 acutely reduced hyperglycemia in diabetic mice (red symbols; n = 9 mice per group. See also Figure S7 for the effect of LY344864 in diabetic nude mice. (G) Differences in glycemia (Δ glycemia) between vehicle- or drug-treated diabetic mice before, during the first 1 hour after LY344864 administration, and after (n = 9 mice per group, * p value < 0.05 one-sample t test comparing the actual mean with a theoretical mean of 0).

Similar articles

Cited by

References

    1. Adham N, et al. Cloning of another human serotonin receptor (5-HT1F): a fifth 5-HT1 receptor subtype coupled to the inhibition of adenylate cyclase. Proceedings of the National Academy of Sciences of the United States of America. 1993;90:408–412. - PMC - PubMed
    1. Almaca J, et al. Spatial and temporal coordination of insulin granule exocytosis in intact human pancreatic islets. Diabetologia. 2015 - PMC - PubMed
    1. Anlauf M, et al. Expression of the two isoforms of the vesicular monoamine transporter (VMAT1 and VMAT2) in the endocrine pancreas and pancreatic endocrine tumors. The journal of histochemistry and cytochemistry : official journal of the Histochemistry Society. 2003;51:1027–1040. - PubMed
    1. Barbosa RM, et al. Control of pulsatile 5-HT/insulin secretion from single mouse pancreatic islets by intracellular calcium dynamics. The Journal of physiology. 1998;510(Pt 1):135–143. - PMC - PubMed
    1. Bennet H, et al. Altered serotonin (5-HT) 1D and 2A receptor expression may contribute to defective insulin and glucagon secretion in human type 2 diabetes. Peptides. 2015;71:113–120. - PubMed

LinkOut - more resources