. 2016 Dec 20;17(12):3305-3318.
doi: 10.1016/j.celrep.2016.11.082.

Adenovirus Protein E4-ORF1 Activation of PI3 Kinase Reveals Differential Regulation of Downstream Effector Pathways in Adipocytes

Affiliations

Adenovirus Protein E4-ORF1 Activation of PI3 Kinase Reveals Differential Regulation of Downstream Effector Pathways in Adipocytes

Natasha Chaudhary et al. Cell Rep. .

Abstract

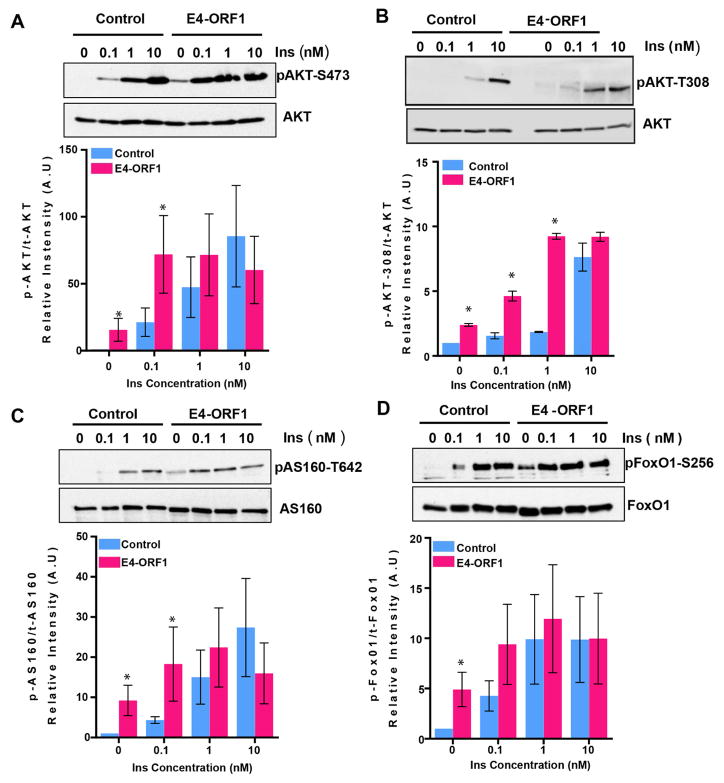
Insulin activation of phosphatidylinositol 3-kinase (PI3K) regulates metabolism, including the translocation of the Glut4 glucose transporter to the plasma membrane and inactivation of the FoxO1 transcription factor. Adenoviral protein E4-ORF1 stimulates cellular glucose metabolism by mimicking growth-factor activation of PI3K. We have used E4-ORF1 as a tool to dissect PI3K-mediated signaling in adipocytes. E4-ORF1 activation of PI3K in adipocytes recapitulates insulin regulation of FoxO1 but not regulation of Glut4. This uncoupling of PI3K effects occurs despite E4-ORF1 activating PI3K and downstream signaling to levels achieved by insulin. Although E4-ORF1 does not fully recapitulate insulin's effects on Glut4, it enhances insulin-stimulated insertion of Glut4-containing vesicles to the plasma membrane independent of Rab10, a key regulator of Glut4 trafficking. E4-ORF1 also stimulates plasma membrane translocation of ubiquitously expressed Glut1 glucose transporter, an effect that is likely essential for E4-ORF1 to promote an anabolic metabolism in a broad range of cell types.

Keywords: E4ORF1; GLUT1; GLUT4; PI3-kinase; PI3K-AKT signaling; RAB10.


Figures

Figure 1
Figure 1. Ad5 E4-ORF1 expression enhances growth factor-stimulated Glut4 translocation without an effect on general endocytic trafficking
(A) Quantitative RT-PCR showing relative mRNA expression of E4-ORF1 in control and stably E4-ORF1 expressing adipocyt. (B) Representative Western blot of whole cell lysates from control and stably FLAG-E4-ORF1 expressing adipocytes probed for FLAG. (C) Anti-Flag IF for transiently expressing (Left) and stably FLAG-E4-ORF1 (Right) expressing adipocyte. Epifluorescence (EPI) images, anti-Flag staining in green and nuclei (DAPI) in red are shown. Arrows indicate cells with prominent plasma membrane anti-Flag staining. Scale bar 20 μ. (D) Schematic of Glut4 reporter depicting the location of the tag. (E, F) Quantification of surface (Cy3 anti-HA fluorescence)-to-total (GFP fluorescence) ratio of HA-Glut4-GFP expression in transient (E) and stable (F) E4-ORF1-expressing adipocytes in basal and insulin treated condition. Data is normalized to the HA-Glut4-GFP surface-to-total value for control cells with 1nM insulin treatment for each experiment. N = 6 assays. (G) Representative Airyscan confocal images showing GFP expression for HA-Glut4-GFP and endogenous Syntaxin 6 staining (Cy3) in basal and 0.1nM insulin treated control and E4-ORF1 expressing adipocytes. Scale bar 5 μm. (H) Quantification of surface-to-total ratio of HA-Glut4-GFP in control, control adipocytes expressing FLAG-E4-ORF6, E4-ORF1 stable adipocytes and E4-ORF1 stable adipocytes co-expressing FLAG-E4-ORF6 respectively, under basal and insulin treated conditions. N = 3 assay. (I) Quantification of surface-to-total ratio of HA-Glut4-GFP expression in control and stable E4-ORF1 adipocytes under basal, insulin and IGF treated conditions. Data are normalized to the HA-Glut4-GFP surface-to-total value for insulin treated control cells for each experiment. N = 3 assay. (J) Quantification of surface-to-total ratio of transferrin receptor in control and E4-ORF1 expressing adipocytes under basal and insulin treated conditions. Data normalized to the HA-Glut-GFP surface-to-total value for 1nM insulin treated control cells for each experiment. N = 3 assays. Data represents mean normalized values ± SEM. *p<0.05, **p<0.005. See also Figure S1.
Figure 2
Figure 2. E4-ORF1 activates Akt
Control and stably expressing E4-ORF1 adipocytes were treated with indicated insulin concentrations, and the lysates were subjected to Western blot analysis. Representative blot showing (A) phospho-Akt S473, (B) phospho-Akt T308 and total Akt expression (upper) and respective densitometric analysis of immunoblots (lower), (C) phospho-AS160 T642 and total AS160 expression (upper) and densitometric analysis of immunoblots (lower), (D) phospho-FoxO1 S256 and total FoxO1 expression (upper) and densitometric analysis of immunoblots (lower). For densitometric analysis N = 3 assays. Mean values ± SEM, *p<0.05.
Figure 3
Figure 3. E4-ORF1 signals through p110a and Akt and mimics the effects of insulin on FoxO1
(A) Both control and stable E4-ORF1 adipocytes were transfected with FoxO1-GFP and treated with indicated insulin concentration. Data shows percentage of cells with cytosolic FoxO1-GFP under basal and insulin treated conditions. N = 4 assays. (B) Control and stably expressing E4-ORF1were pre-treated with PIK75 (0.1μM), TGX221 (0.1μM) or with DMSO (vehicle) for 1 h followed by insulin stimulation. Quantification of surface-to-total ratios of HA-Glut4-GFP are shown. Data are normalized to the HA-GLUT4-GFP surface-to-total value for insulin treated control cells for each experiment. N = 4 assays. (C) Quantification of surface-to-total ratio of HA-Glut4-GFP measured in control, transiently expressing Flag-E4-ORF1 wild type and Flag-E4-ORF1-V128A adipocytes under basal and insulin treated conditions. Data is normalized to the HA-Glut-GFP surface-to-total value for basal control cells for each experiment. N = 4 assays. (D) Control, transiently expressing Flag-E4-ORF1 wild type and Flag-E4-ORF1-V128A adipocytes were transfected with FoxO1-GFP. Data shows percentage of cells with nuclear FoxO1-GFP under basal condition. N = 3 assays. (E) Control and adipocytes stably expressing E4-ORF1 were pre-treated with DMSO (vehicle) or MK2206 (1μM) for 1 h followed by insulin stimulation. Quantification of surface-to-total ratios of HA-Glut4-GFP are shown. Data are normalized to the HA-Glut4-GFP surface-to-total value for insulin treated control cells for each experiment, N = 4 assays. (F) FoxO1-GFP expressing control and E4-ORF1-expressing adipocytes were treated with DMSO (vehicle), PIK75 (0.1μM), TGX221 (0.1μM) or with MK2206 (1μM) respectively for 1h. Data shows percentage of cells with nuclear FoxO1-GFP under basal condition. N = 4 assays. Data represents mean normalized values ± SEM, *p<0.05, **p<0.005, ***p<0.001. See also Figure S2 and S3.
Figure 4
Figure 4. E4-ORF1 colocalize with p110a and activates PI3K activity
(A) Both control and stable E4-ORF1-expressing adipocytes were transfected with GFP-PH1. Quantification of plasma membrane (TIRF GFP measurements) to total (EPI GFP measurements) ratio of GFP-PH1 expression in basal and insulin-stimulated conditions is shown. Data normalized to GFP-PH1 TIRF-to-EPI value for control cells under basal condition in each experiment. N = 4 assays. (B) GFP-PH1 expressing control and stable E4-ORF1 adipocytes were treated with PIK75 (0.1μM) for 1 h. Quantification of TIRF to EPI ratio of GFP-PH1 expression under basal condition is shown. Data normalized to GFP-PH1 TIRF-to-EPI value for control untreated cells in each experiment. N = 3 assays. (C) Representative immunoblots for p110α, p85 and actin expression in control and stable E4-ORF1-exprerssing adipocytes in basal conditions. (D) Representative TIRF images for FLAG-E4-ORF1 in basal and 0.1 nM insulin stimulated conditions. Scale bar 10 μm. (E) Quantification of TIRF imaging shown in (D). The fluorescence power of anti-Flag staining in the TIRF zone divided by anti-Flag fluorescence staining in EPI for individual cells in basal and 0.1 nM insulin stimulated condition. Individual points are data from single cells. N=40 cells. (F) Representative TIRF image showing colocalization between E4-ORF1 (anti-FLAG staining) and endogenous p110α stained puncta in basal adipocytes. Scale bar 10 μm. (G) Quantification of the endogenous p110α puncta that also contain E4-ORF1 (anti-FLAG staining). N= 2 assays. Mean values ± SD. (H) Quantification of the colocalization between E4-ORF1 (anti-FLAG staining) and endogenous insulin receptor. N= 2 assays. Mean values ± SD. Data represents mean normalized values ± SEM unless otherwise stated, *p<0.05, **p<0.005. See also Figure S4.
Figure 5
Figure 5. E4-ORF1 enhances Glut4 translocation to the plasma membrane by increasing Glut4 exocytosis independent of Rab10
(A) Quantitative RT-PCR showing relative mRNA expression of Rab10 in control adipocytes and stable Rab10 knockdown (KD) adipocytes. (B) Quantification of surface-to-total ratio of HA-Glut4-GFP in basal and insulin-stimulated conditions performed in Rab10 KD adipocytes ectopically re-expressing Rab10 (control), Rab10 KD adipocytes ectopically co-expressing Rab10 and Flag-E4-ORF1 (E4-ORF1), Rab10 KD adipocytes and Rab10 KD adipocytes expressing Flag-E4-ORF1 respectively. Data normalized to the HA-Glut4-GFP surface-to-total value for insulin treated control cells for each experiment. N = 4 assays. (C) Average insulin-stimulated exocytic rate constant for HA-Glut4-GFP measured in control and stable E4-ORF1 adipocytes. N = 5 assays. (D) Schematic of method to measure HA-Glut4-GFP accumulation in the TIRF zone (evanescent field) (TIRF-GFP/EPI-GFP fluorescence ratio) and the fraction of Glut4 that is inserted into the PM (anti-HA TIRF-Cy3/TIRF-GFP fluorescence ratio). (E) Representative TIRF images for HA-Glut4-GFP, showing anti-HA TIRF-Cy3 fluorescence and TIRF-GFP fluorescence in control and stable E4-ORF1 adipocytes under basal and 0.1 nM insulin stimulated conditions. Scale bar 10 μm. (F) Quantification of the fraction of Glut4 inserted into the PM by measuring anti-HA TIRF-Cy3 fluorescence to TIRF-GFP fluorescence ratio, in control and stable E4-ORF1 adipocytes under basal and insulin stimulated condition. Data normalized to the TIRF-Cy3-to-TIRF-GFP value for insulin treated control cells for each experiment. N = 3 assays. Data represents mean normalized values ± SEM, *p<0.05.
Figure 6
Figure 6. E4-ORF1 increases glucose uptake by increasing Glut1 in the plasma membrane of adipocytes
(A) 3H-2-Deoxyglucose uptake, normalized to amount of protein in each sample, in control and stable E4-ORF1 adipocytes in basal and insulin-stimulated conditions. Data normalized to uptake for insulin-treated control adipocytes for each experiment. N = 5 assays. (B) 3H-2-Deoxyglucose uptake, normalized to amount of protein in each sample, in control and stable E4-ORF1 adipocytes either treated with MK2006 or vehicle control (DMSO), under unstimulated conditions. N = 3 assays. (C) Representative immunoblots for Glut4, Glut1 and respective actin expression in control and stable E4-ORF1 adipocytes cell lysate. (D) Quantification of surface-to-total ratio of HA-Glut1 expression in control and E4-ORF1 expressing adipocytes under basal alone, pre-treatment with PIK75 and MK2206 respectively. N = 4 assays. (E) Quantification of surface-to-total ratio of HA-Glut1 expression in Rab10 KD adipocytes ectopically re-expressing Rab10 (control), Rab10 KD adipocytes ectopically co-expressing Rab10 and Flag-E4-ORF1 (E4-ORF1), Rab10 KD adipocytes and Rab10 KD adipocytes expressing Flag-E4-ORF1 respectively under basal conditions. E4-ORF1 data normalized to Glut1 surface-to-total amount in control adipocytes and Rab10 KD expressing E4-ORF1 data was normalized to Glut1 surface-to-total amount in Rab10 KD adipocytes for each experiment. N = 4 assays. (F) ELISA based quantification of Lactate in media of control, stable E4-ORF1 adipocytes and stable E4-ORF1 adipocytes with Glut1 KD. Data normalized to lactate concentration in control adipocytes for each experiment. N = 3 assays. Mean normalized values ± SD. (G) Mean-difference plot representing differential gene expression, 2136 genes. Genes colored in red represent differentially expressed genes (adj. p < 0.05) in stable E4-ORF1 adipocytes compared to control cells. N=3 per group. (H) Heat map of differentially expressed genes in control and stable E4-ORF1 adipocytes with more than 2 fold change in expression. Color-coded on basis of fold change relative to control adipocytes (290 total genes, Green-153 down regulated genes, Red-137 up regulated genes), N=3 per group, adj. p-value <0.05. (I) Quantification of relative mRNA expression levels of listed genes from differentially expressed gene set of E4-ORF1 adipocytes. Data represents mean normalized values ± SEM unless otherwise stated, *p<0.05, **p<0.005, ***p<0.001, ****p<0.0001. See also Figure S5, Table S1 and Table S2.

Similar articles

Cited by

References

    1. ABEL ED, PERONI O, KIM JK, KIM YB, BOSS O, HADRO E, MINNEMANN T, SHULMAN GI, KAHN BB. Adipose-selective targeting of the GLUT4 gene impairs insulin action in muscle and liver. Nature. 2001;409:729–33. - PubMed
    1. ALESSI DR, ANDJELKOVIC M, CAUDWELL B, CRON P, MORRICE N, COHEN P, HEMMINGS BA. Mechanism of activation of protein kinase B by insulin and IGF-1. EMBO J. 1996;15:6541–51. - PMC - PubMed
    1. BAI L, WANG Y, FAN J, CHEN Y, JI W, QU A, XU P, JAMES DE, XU T. Dissecting multiple steps of GLUT4 trafficking and identifying the sites of insulin action. Cell Metab. 2007;5:47–57. - PubMed
    1. BOSE A, GUILHERME A, ROBIDA SI, NICOLORO SM, ZHOU QL, JIANG ZY, POMERLEAU DP, CZECH MP. Glucose transporter recycling in response to insulin is facilitated by myosin Myo1c. Nature. 2002;420:821–4. - PubMed
    1. BRUNO J, BRUMFIELD A, CHAUDHARY N, IAEA D, MCGRAW TE. SEC16A is a RAB10 effector required for insulin-stimulated GLUT4 trafficking in adipocytes. J Cell Biol. 2016;214:61–76. - PMC - PubMed

Publication types