. 2016 Dec 20;17(12):3369-3384.
doi: 10.1016/j.celrep.2016.12.001.

Cerebral Organoids Recapitulate Epigenomic Signatures of the Human Fetal Brain

Affiliations

Cerebral Organoids Recapitulate Epigenomic Signatures of the Human Fetal Brain

Chongyuan Luo et al. Cell Rep. .

Abstract

Organoids derived from human pluripotent stem cells recapitulate the early three-dimensional organization of the human brain, but whether they establish the epigenomic and transcriptional programs essential for brain development is unknown. We compared epigenomic and regulatory features in cerebral organoids and human fetal brain, using genome-wide, base resolution DNA methylome and transcriptome sequencing. Transcriptomic dynamics in organoids faithfully modeled gene expression trajectories in early-to-mid human fetal brains. We found that early non-CG methylation accumulation at super-enhancers in both fetal brain and organoids marks forthcoming transcriptional repression in the fully developed brain. Demethylated regions (74% of 35,627) identified during organoid differentiation overlapped with fetal brain regulatory elements. Interestingly, pericentromeric repeats showed widespread demethylation in multiple types of in vitro human neural differentiation models but not in fetal brain. Our study reveals that organoids recapitulate many epigenomic features of mid-fetal human brain and also identified novel non-CG methylation signatures of brain development.

Keywords: 3D culture; DNA methylation; brain development; epigenome; organoid.


Figures

Figure 1
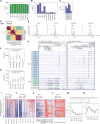
Figure 1. Transcriptional dynamics during cerebral organoid differentiation
(A) Principal component analysis (PCA) of gene expression during cerebral organoid differentiation. (B) The number of differentially expressed genes across CO differentiation with FDR < 0.05 and FC (fold change) >= 2. (C) The definition of human brain development stages used in this study. (D) Pearson correlation of the expression (RPKM) of protein coding genes across various in vitro neural differentiation systems and human cortical development (BRAINSPAN). (E) PCA of the gene expression of in vitro differentiation systems and human cortical development. (F) Enriched gene ontology terms of genes with top 1,000 positive or minus loading for PC1 and PC2 in (E). (G) The relative expression (Z-score) of genes with synaptic transmission functions that were associated with top 1,000 positive loadings for PC1 in (E). (H) Z-score of neurogenesis genes that were associated with top 1,000 positive loadings for PC2 in (E). (I) Z-score of ECM genes that were associated with top 1,000 negative loadings for PC2 in (E). (J) The expression (log2(1+RPKM)) of ECM genes shown in (I).
Figure 2
Figure 2. Cerebral organoids preserve fetal cortex non-CG DNA methylation patterns
(A–C) Genome-wide levels of DNA methylation in CG (A) and CA (B) contexts. mCA levels of CO and fetal cortex samples were plotted with a reduced scale in (C). (D) Hierarchical clustering of the pairwise spearman correlation matrix of mCH levels in 100 kb bins. (E) Sequence contexts of statistically significant mCH sites. (F) mCH levels of putative super-enhancers identified in fetal brain (Fbrain) and shuffled regions. (G) mCH levels of putative super-enhancers identified in adult cortex and shuffled regions. (H) The enrichment of mCH at putative super-enhancers overlapping with Auts2 and Nfia loci. The scale of each track was individually selected for optimal display. Ticks indicate statistically significant mCH sites (binomial tests, FDR<0.01). (I-J) Putative fetal brain super-enhancers were ranked by their mCH levels in the fetal cortex. The mCH levels of fetal-brain super-enhancers in postnatal cortical development were plotted (I). (K-L) Zscore of genes associated with fetal brain super-enhancers. (M-N) Z-score of genes associated with bins of super-enhancers ranked by their mCH levels in fetal cortex.
Figure 3
Figure 3. Brain region specific regulator genes are associated with distinct hyper-methylation signatures
(A) The average CG methylation level of DMVs colocalized with brain regional marker genes. (B) Browser views showing mCG remodeling at rostral maker Six3 gene (left panel) and midbrain marker Sim1 gene (right panel) during CO differentiation and cortical development. (C) The distribution of mCG, relative gene expression, H3K4me3 and H3K27me3 levels for static, hyper-mCG and all H3K27me3+ DMVs. (D) H3K27me3+ DMVs were categorized by hyper-mCG accumulation in COs during cortical development. For example, Type 3 DMVs were hyper-methylated in cortex but not in COs (CO-/Ctx+). (E) Gene ontology term enrichments for the genes associated with each type of DMV.
Figure 4
Figure 4. Enriched demethylation of pericentromeric repeats in cerebral organoids
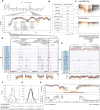
(A) The top panel shows the number of hypo-DMRs per Mb window across chromosome 1. Red and blue bars indicate the locations of centromere and hypo-DMR blocks, respectively. The bottom panel shows mCG levels for COs, neurospheres (Ns) and cortex samples for a pericentromeric region chr1: 137 – 157 Mb. (B) Repeat families enriched in hypo-DMR blocks identified by relative enrichment compared to shuffled genomic regions repeated 1,000 times. (C) The distribution of mCG levels for all hypo-DMR blocks and shuffled regions. (D and E) Multiple regions showing increased transcripts abundances during CO differentiation in a pericentromeric hypo-DMR block region (chr1: 142,400,000 – 143,676,000) of chromosome 1. The region with pink shade is expanded in (E). Two annotated repeat elements that were upregulated in CO 60d are highlighted by red rectangles. (F, G) The comparison of H3K9me3 (F) and H3K4me1 (G) levels between neurosphere cultures and the fetal brain (FB, replicate 1), at hypo-DMR blocks and shuffled regions. (H) Reduced mCG and H3K9me3 levels at a pericentromeric region of chromosome 11.
Figure 5
Figure 5. Epigenomic remodeling of regulatory regions during cerebral organoid differentiation
(A) Browser views of DMRs in regions surrounding Emx1 locus. (B) DMRs found in CO differentiation grouped by the dynamics of mCG remodeling. Heatmaps show mCG, DNase-seq and ChIP-seq signals for regions +/- 3kb from the center of DMRs. (C) The overlap of DMRs with hESC and fetal brain regulatory features. The heatmap and numbers show the percentage of row features overlapping with column features. (D and E) TF binding motif enrichment in DMR groups and fetal cortex specific LMRs. The expression of TFs is shown in (E).
Figure 6
Figure 6. Cerebral organoids establish promoter DNA methylation patterns similar to human brain cortex
(A) The distribution of DMR groups in regions +/− 50kb from TSS. (B) Spearman correlation coefficients between mCG change and relative gene expression for the differentiation transitions between H9 – EB and EB – CO 60d. (C) Browers views of mCG remodeling at Dppa4 and Dnmt3b promoters during CO differentiation and human cortical development. (D) K-means clustering of mCG patterns at promoters that overlapped with TSS and CO hyper-DMRs. Clusters 1-5 with apparent hyper-methylation during CO differentiation are shown. (E-G) Histone modifications H3K4me3, H3K27me3, gene expression in CO differentiation and human cortex development were plotted for clustered promoters and associated genes in (D).

Similar articles

Cited by

References

    1. Bertrand N, Castro DS, Guillemot F. Proneural genes and the specification of neural cell types. Nat Rev Neurosci. 2002;3:517–530. - PubMed
    1. Burger L, Gaidatzis D, Schübeler D, Stadler MB. Identification of active regulatory regions from DNA methylation data. Nucleic Acids Res. 2013;41:e155. - PMC - PubMed
    1. Camp JG, Badsha F, Florio M, Kanton S, Gerber T, Wilsch-Bräuninger M, Lewitus E, Sykes A, Hevers W, Lancaster M, et al. Human cerebral organoids recapitulate gene expression programs of fetal neocortex development. Proc Natl Acad Sci U S A. 2015;112:15672–15677. - PMC - PubMed
    1. Chambers SM, Fasano CA, Papapetrou EP, Tomishima M, Sadelain M, Studer L. Highly efficient neural conversion of human ES and iPS cells by dual inhibition of SMAD signaling. Nat Biotechnol. 2009;27:275–280. - PMC - PubMed
    1. Chen L, Chen K, Lavery LA, Baker SA, Shaw CA, Li W, Zoghbi HY. MeCP2 binds to non-CG methylated DNA as neurons mature, influencing transcription and the timing of onset for Rett syndrome. Proc Natl Acad Sci U S A. 2015;112:5509–5514. - PMC - PubMed

Publication types