. 2017 Jun;17(6):1476-1489.
doi: 10.1111/ajt.14182. Epub 2017 Feb 2.

Renal Allograft Survival in Nonhuman Primates Infused With Donor Antigen-Pulsed Autologous Regulatory Dendritic Cells

Affiliations

Renal Allograft Survival in Nonhuman Primates Infused With Donor Antigen-Pulsed Autologous Regulatory Dendritic Cells

M B Ezzelarab et al. Am J Transplant. 2017 Jun.

Abstract

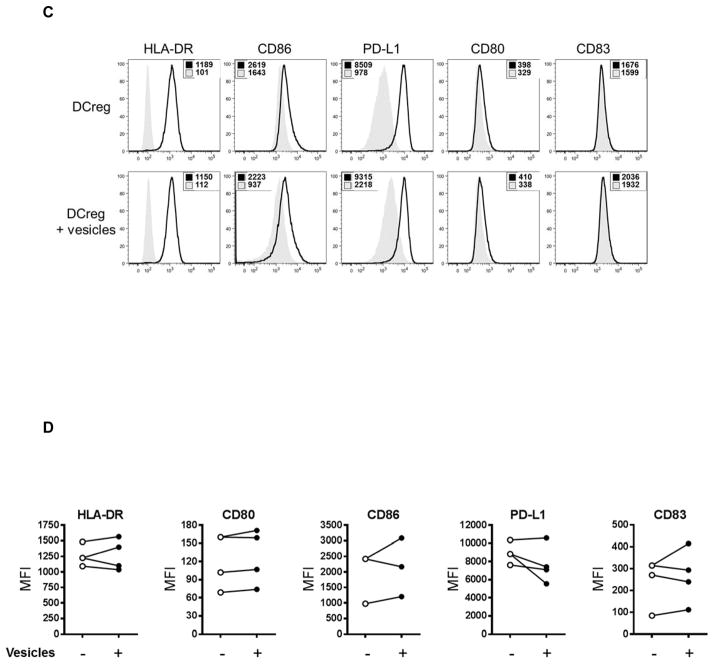
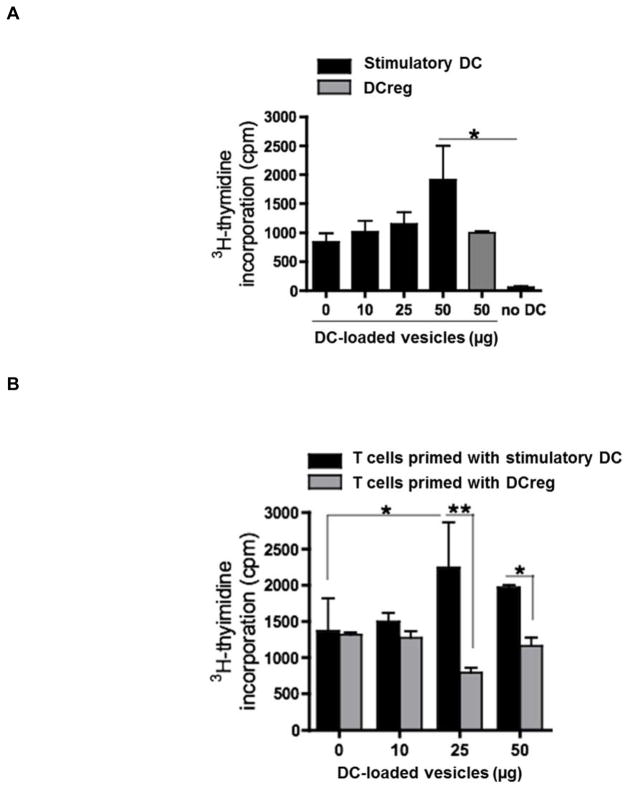
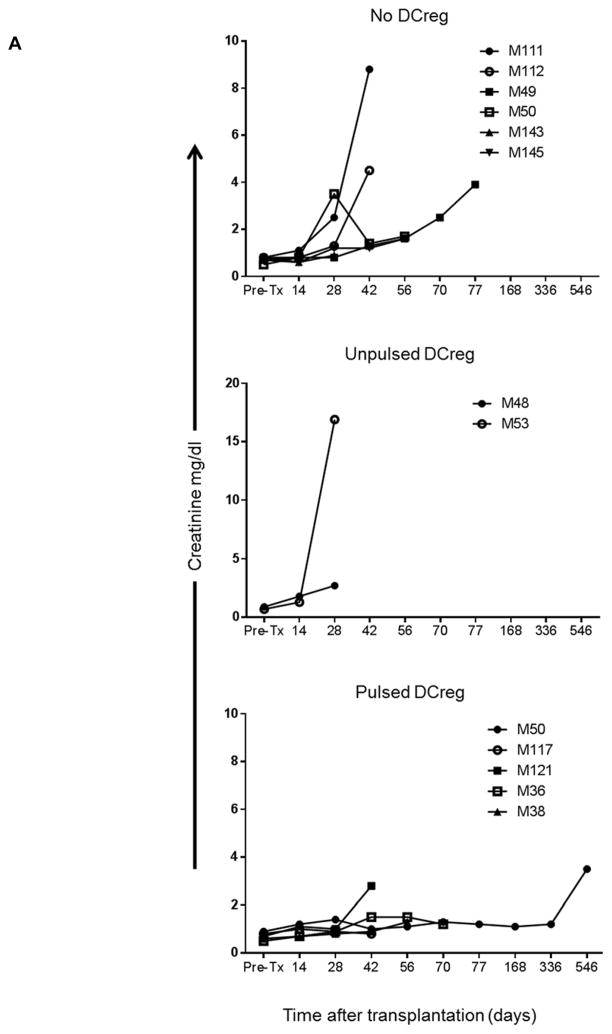
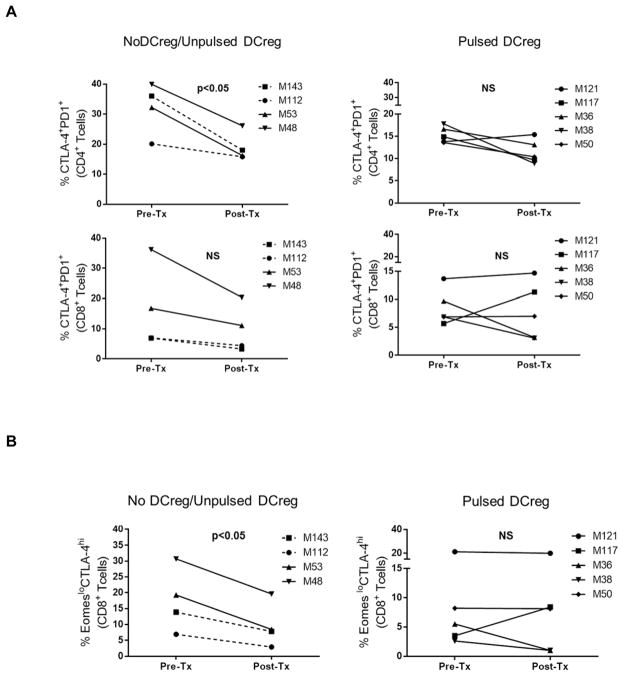
Systemic administration of autologous regulatory dendritic cells (DCreg; unpulsed or pulsed with donor antigen [Ag]), prolongs allograft survival and promotes transplant tolerance in rodents. Here, we demonstrate that nonhuman primate (NHP) monocyte-derived DCreg preloaded with cell membrane vesicles from allogeneic peripheral blood mononuclear cells induce T cell hyporesponsiveness to donor alloantigen (alloAg) in vitro. These donor alloAg-pulsed autologous DCreg (1.4-3.6 × 10⁶ /kg) were administered intravenously, 1 day before MHC-mismatched renal transplantation to rhesus monkeys treated with costimulation blockade (cytotoxic T lymphocyte Ag 4 immunoglobulin [CTLA4] Ig) and tapered rapamycin. Prolongation of graft median survival time from 39.5 days (no DCreg infusion; n = 6 historical controls) and 29 days with control unpulsed DCreg (n = 2), to 56 days with donor Ag-pulsed DCreg (n = 5) was associated with evidence of modulated host CD4+ and CD8+ T cell responses to donor Ag and attenuation of systemic IL-17 production. Circulating anti-donor antibody (Ab) was not detected until CTLA4 Ig withdrawal. One monkey treated with donor Ag-pulsed DCreg rejected its graft in association with progressively elevated anti-donor Ab, 525 days posttransplant (160 days after withdrawal of immunosuppression). These findings indicate a modest but not statistically significant beneficial effect of donor Ag-pulsed autologous DCreg infusion on NHP graft survival when administered with a minimal immunosuppressive drug regimen.

Keywords: T cell biology; animal models: nonhuman primate; basic (laboratory) research/science; dendritic cell; fusion proteins and monoclonal antibodies: belatacept; immunobiology; immunosuppressant; immunosuppression/immune modulation; kidney transplantation/nephrology; mechanistic target of rapamycin (mTOR); translational research/science.


Conflict of interest statement

Disclosure

The authors of this manuscript have conflicts of interest to disclose as described by the American Journal of Transplantation. AWT is co-inventor of a US patent for generation of dendritic cells to promote organ transplant survival. The other authors have no conflicts of interest to disclose.

Figures

Figure 1
Figure 1. Protocol for generation, Ag pulsing and infusion of autologous DCreg into renal-allografted rhesus monkeys treated with CTLA4Ig and tapered rapamycin
Times of IS drug (CTLA4Ig and rapamycin) administration in relation to the day of transplant (on day 0) are shown. All graft recipients in each group received CTLA4Ig (abatacept; Bristol-Myers Squibb; Princeton, NJ; 20 mg/kg, i.v.) on days −1, 0, 4, 7, 10, 14, 21, 28, 35, 42, 49, and 56. Intramuscular rapamycin (LC laboratories, Woburn, MA) was given daily, starting on day −2 for 6 months. Whole blood trough levels of rapamycin were measured twice weekly and maintained between 10–15 ng/mL for the first month, between 5–10 ng/mL during the subsequent 4 months, and between 1–5 ng/mL for the following month. IS therapy was discontinued 6 months post-transplant.
Figure 2
Figure 2. Efficient capture of donor cell membrane vesicles by rhesus monocyte-derived DCreg does not affect their surface phenotype
Monocyte-derived DC generated from normal rhesus PBMC were cultured either with VitD3 and IL-10 (DCreg) or with a pro-inflammatory cytokine cocktail (TNFα, IL-1β and IL-6) (stimulatory DC), as described in the Materials and Methods. The DC populations were incubated with different concentrations of allogeneic, MHC-mismatched PBMC-derived vesicles (0, 10, 25, 50 μg) stained with PKH26 (A) After 16–18 h, vesicle capture was measured by flow cytometry. The percentage of DC that captured vesicles is indicated in each panel. (B) Means +1SD obtained from 3 independent experiments using 3 different donor-recipient pairs. Stimulatory DC and DCreg from the same donor-recipient pairs were used in each experiment. *, p<0.05. (C, D,) DCreg were incubated with or without 25 μg of allogeneic vesicles (16–18 h; 37°C). The indicated cell surface markers were then analyzed by flow cytometry. (C) Representative plots from 1 experiment showing the mean fluorescence intensity (MFI) of each marker for control unpulsed DCreg and vesicle-pulsed DCreg. Isotype controls are shown in gray. (D) Results of individual (n= 3–4) experiments using different donor-recipient pairs.
Figure 3
Figure 3. Donor vesicle-pulsed autologous DCreg fail to stimulate T cell proliferation and induce T cell hyporesponsiveness
(A) Vesicle-pulsed DC were co-cultured with autologous T cells at 1:40 (DC:T cell) ratio for 5 days (1o MLR). Proliferation was measured by 3H-thymidine incorporation. Results obtained using pulsed control stimulatory DC and DCreg are shown. (B) T cells from these co-cultures were rested for 3 days, then re-stimulated with allogeneic PBMC from the same donor as the vesicles at 1:10 (PBMC:T cell) ratio for 3 days (2o MLR). Proliferation was measured by 3H-thymidine incorporation. Data are representative of 3 replicate experiments performed under each condition (stimulatory DC versus DCreg) using 3 different, MHC mis-matched stimulator–responder pairs. All combinations using pulsed cells were similarly effective. Values shown are means +1SD. *, P<0.05; **, P<0.005 using 1-way ANOVA followed by Bonferroni’s multiple comparison test.
Figure 4
Figure 4. Serum creatinine levels, percentage body weight loss, and renal allograft survival times in monkeys infused with either no DCreg or unpulsed or donor Ag-pulsed autologous DCreg
(A) Serum creatinine levels at various times post-transplant. (B) Percent body weight loss for each graft recipient at 2 and 4 weeks post-transplant. (C) Individual and median experimental end-point and graft survival times. Actuarial graft survival curves for monkeys that received pulsed DCreg (n=5), versus those that received unpulsed DCreg plus those that did not receive cells (combined; n=8), are shown. Graft survival curves were compared using log-rank (Mantel-Cox) and Gehan-Breslow-Wilcoxon tests.
Figure 5
Figure 5. Circulating anti-donor IgG alloAb levels in renal allograft recipients
Levels of anti-donor IgG were determined by flow cytometry in the serum of each graft recipient that received either no DCreg (top panels), unpulsed DCreg (middle panels) or donor Ag-pulsed DCreg (lower panels). A progressive increase in anti-donor Ab was detected from day 180 in the monkey (M50) with a transplant survival time of 525 days. Inset values indicate mean fluorescence intensity (MFI).
Figure 6
Figure 6. Concomitant CTLA4 and PD-1 expression by host CD4+ and CD8+ T cells, and concomitant CTLA4 and Eomes expression by host CD8+ T cells following donor Ag challenge
PBMC were obtained from rhesus macaques pre- and 4 weeks post-renal transplant (Tx) and co-cultured with CD2+ cell-depleted donor PBMC for 5 days. (A) CTLA4 and PD-1 co-expression by CD4+ and CD8+ T cells was then determined by flow cytometry. Left, results of CD4+ and CD8+ staining for 2 recipients with no DCreg infusion (historical controls; dashed lines) and 2 recipients treated with unpulsed autologous DCreg (solid lines). Right, n=5 recipients of donor vesicle-pulsed recipient DCreg. (B) Eomeslo CTLA4hi CD8+ T cells pre- and post-transplant in the same experimental groups. NS = not significant.
Figure 7
Figure 7. Incidences of donor-reactive IL-17+CD4+T cells and systemic levels of pro-inflammatory IL-17A and IL-21 in autologous DCreg-infused renal allograft recipients
(A) PBMC were obtained from rhesus macaques pre- and 4 weeks post-transplant (Tx) and co-cultured with CD2+ cell-depleted donor PBMC for 5 days. The cells were then re-stimulated with PMA, ionomycin and GolgiStop for 5 h. Thereafter, intracellular staining for IL-17 was performed on CD4+ and CD8+ T cells. Individual results from 2 recipients of unpulsed autologous DCreg and 5 recipients of donor vesicle-pulsed autologous DCreg are shown. (B) Serum was obtained from non-transplanted (naive; n=6), renal-transplanted without adoptive cell therapy (no DCreg; historical controls; n=4), or renal-transplanted monkeys infused with unpulsed autologous DCreg (n=2) or donor Ag-pulsed autologous DCreg (n=5). Levels of IL-17A and IL-21 were determined by Luminex assay. All measurements in all graft recipients were made 4 weeks post-transplant. Serum samples were tested in duplicate.
Figure 8
Figure 8. Incidences of donor-reactive IL-17+ and CTLA4+IL-17+CD4+T cells in autologous DCreg-infused renal allograft recipients
PBMC were obtained from rhesus macaques pre- and 4 weeks post-transplant (Tx) and co-cultured with CD2+ cell-depleted donor PBMC for 5 days. The cells were then re-stimulated with PMA, ionomycin and GolgiStop for 5 h. Thereafter, concomitant intracellular staining for CTLA4 and IL-17 was performed on CD4+ T cells. Upper panels show representative dot plots. Lower panels show individual results from 2 recipients of unpulsed autologous DCreg and 5 recipients of donor vesicle-pulsed autologous DCreg.

Similar articles

Cited by

References

    1. Wood KJ, Bushell A, Hester J. Regulatory immune cells in transplantation. Nat Rev Immunol. 2012;12(6):417–430. - PubMed
    1. Lombardi G, Sagoo P, Scotta C, Fazekasova H, Smyth L, Tsang J, et al. Cell therapy to promote transplantation tolerance: a winning strategy? Immunotherapy. 2011;3(4 Suppl):28–31. - PubMed
    1. Todo S, Yamashita K, Goto R, Zaitsu M, Nagatsu A, Oura T, et al. A pilot study of operational tolerance with a regulatory T-cell-based cell therapy in living donor liver transplantation. Hepatology. 2016;64(2):632–643. - PubMed
    1. Hutchinson JA, Riquelme P, Sawitzki B, Tomiuk S, Miqueu P, Zuhayra M, et al. Cutting Edge: Immunological consequences and trafficking of human regulatory macrophages administered to renal transplant recipients. J Immunol. 2011;187(5):2072–2078. - PubMed
    1. Rosborough BR, Raich-Regue D, Turnquist HR, Thomson AW. Regulatory myeloid cells in transplantation. Transplantation. 2014;97(4):367–379. - PMC - PubMed