Review
. 2016 Dec 21;5(4):55.
doi: 10.3390/biology5040055.

A Brief History of Research on Mitotic Mechanisms

Affiliations
Review

A Brief History of Research on Mitotic Mechanisms

J Richard McIntosh et al. Biology (Basel). .

Abstract

This chapter describes in summary form some of the most important research on chromosome segregation, from the discovery and naming of mitosis in the nineteenth century until around 1990. It gives both historical and scientific background for the nine chapters that follow, each of which provides an up-to-date review of a specific aspect of mitotic mechanism. Here, we trace the fruits of each new technology that allowed a deeper understanding of mitosis and its underlying mechanisms. We describe how light microscopy, including phase, polarization, and fluorescence optics, provided descriptive information about mitotic events and also enabled important experimentation on mitotic functions, such as the dynamics of spindle fibers and the forces generated for chromosome movement. We describe studies by electron microscopy, including quantitative work with serial section reconstructions. We review early results from spindle biochemistry and genetics, coupled to molecular biology, as these methods allowed scholars to identify key molecular components of mitotic mechanisms. We also review hypotheses about mitotic mechanisms whose testing led to a deeper understanding of this fundamental biological event. Our goal is to provide modern scientists with an appreciation of the work that has laid the foundations for their current work and interests.

Keywords: accuracy; centrosome; chromosome; force; kinetochore; microtubule; mitosis; mitotic spindle; motor enzyme; tubulin dynamics.


Conflict of interest statement

The authors state that they have no conflict of interests.

Figures

Figure 1
Figure 1
Drawing of dividing nuclei by Schneider, 1873 [1].
Figure 2
Figure 2
Drawing of mitotic figures that indicate structures at the spindle poles. van Benedin, 1876 [3] Image courtesy of Biodiversity Heritage Library. http://www.biodiversitylibrary.org. Drawing of mitotic figures that indicate structures at the spindle poles. van Benedin, 1876.
Figure 3
Figure 3
Drawings of mitotic figures by Flemming, 1878 [4,5]. This image is displayed under the terms of a Creative Commons License (Attribution-Noncommercial-Share Alike 3.0 Unported license, as described at http://creativecommons.org/licenses/by-nc-sa/3.0/.
Figure 4
Figure 4
Drawing of a mitotic figure in a live cell prepared by Mayzel and published by Flemming, 1878. [4] This image is displayed under the terms of a Creative Commons License (Attribution-Noncommercial-Share Alike 3.0 Unported license, as described at http://creativecommons.org/licenses/by-nc-sa/3.0/.
Figure 5
Figure 5
Drawings of chromosome segregation in living epidermal cells of a salamander larva. Flemming, 1878 [4]. This image is displayed under the terms of a Creative Commons License (Attribution-Noncommercial-Share Alike 3.0 Unported license, as described at http://creativecommons.org/licenses/by-nc-sa/3.0/.
Figure 6
Figure 6
Mitotic spindles in living sea urchin eggs: metaphase (left) and mid-anaphase (right) viewed with polarization microscopy, similar to Inoue and Dan, 1951 [26]. Image from Salmon, E.D., 1982, Meth. Cell Biol. 25: 69–105. With permission from the author and the Copyright Clearance Center.
Figure 7
Figure 7
A portion of a sea urchin mitotic spindle (SP) imaged in an electron microscope, showing the MTs (arrows) that make up the spindle fibers that had been seen by light microscopy. The curved dashed line marks the polar end of the spindle and the beginning of a specialized region that surrounds the spindle pole in these cells. (Dark rods are contamination.) Harris, 1965 [30]. This image is displayed under the terms of a Creative Commons License (Attribution-Noncommercial-Share Alike 3.0 Unported license, as described at http://creativecommons.org/licenses/by-nc-sa/3.0/.
Figure 8
Figure 8
Electron micrograph of a mitotic spindle pole in a cultured mammalian cell, fixed with glutaraldehyde. Red arrows mark centrioles, the blue arrow indicates pericentriolar material where MTs are nucleated. Image kindness of Kent McDonald, Univ. California, Berkeley.
Figure 9
Figure 9
Kinetochores (K) are the specializations on mitotic chromosomes (Ct) that bind MTs. (A) = sister kinetochores in a mammalian cell, strain CHO, treated with colcemid to block MT formation; (B) = a kinetochore after removal of the drug and regrowth of spindle MTs (S). From Brinkley and Stubblefield, 1966 [33]. With permission from Elsevier Publishing.
Figure 10
Figure 10
Thick section of a mammalian cell in anaphase, lysed before fixation to reduce the complexity of background staining. KMTs = kinetochore microtubules; Chrs = chromosomes. White arrows indicate sites of apparent attachment between MTs and a chromosome (1) and a pole (2). From McIntosh et al., 1975b [37]. By permission of the author.
Figure 11
Figure 11
Counts of total numbers of MTs seen on successive spindle cross-sections from pole to pole at three stages of mitosis: (A) = metaphase; (B) = early anaphase; (C) = mid anaphase. From McIntosh and Landis, 1971 [34]. This image is displayed under the terms of a Creative Commons License (Attribution-Noncommercial-Share Alike 3.0 Unported license, as described at http://creativecommons.org/licenses/by-nc-sa/3.0/.
Figure 12
Figure 12
The paths of many spindle MTs, traced through serial sections of a mammalian cell (strain PtK2) in anaphase. White crosses mark the positions of the poindle poles. The shorter bundles of colored lines represent the kinetochore MTs that cluster to form the kinetochore fibers visible in the light microscope. (Colors are used simply to make these clusters stand out.) The red and yellow lines represent non-kinetochore MTs, which are associated with one pole or the other and interdigitate at the spindle’s midplane to make the “interpolar” spindle. These MTs slide and elongate during anaphase B. Image kindness of D. Mastronarde, Univ. Colorado.
Figure 13
Figure 13
The spindle cycle in budding yeast. In the center of the figure, drawings represent the structure of budding yeast cells as they traverse the cell cycle. Around the edges are models made from tomographic reconstructions of the MT component of yeast spindles at each stage of mitosis. (a) There is only one centrosome but MTs grow from it into the cell’s nucleus; (b) The centrosome is duplicated and more shorter MTs project into the nucleus; (c) There are now two functional centrosomes, sitting side by side, each projecting MTs into the nucleus. At this stage, the spindle is in the process of attaching sister kinetochores to sister spindle poles; (d) A bi-polar spindle has formed; (e) The cell is advanced in anaphase B and the sister chromosomes are well separated; (f) A long, slender spindle runs from pole to pole (green and magenta MTs), and the chromosomes are drawn tightly around each pole. This spindle severs as the cell divides at cytokinesis, and the cell returns to state A. Redrawn from [43] by Eileen O’Toole. This image is displayed under the terms of a Creative Commons License (Attribution-Noncommercial-Share Alike 3.0 Unported license, as described at http://creativecommons.org/licenses/by-nc-sa/3.0/.
Figure 14
Figure 14
Two-dimensional projections of all the MTs in a volume that includes ~one-half of an early anaphase spindle from a PtK1 cell. (A) = all MTs traced; (B) = all kinetochore-associated MTs seen; (C,D) = all non-KMTs associated with the two spindle poles. From Mastronarde et al., 1993 [47]. This image is displayed under the terms of a Creative Commons License (Attribution-Noncommercial-Share Alike 3.0 Unported license, as described at http://creativecommons.org/licenses/by-nc-sa/3.0/.
Figure 15
Figure 15
Diagrams showing the polar orientation of Spindle MTs, as assessed by the tubulin-containing hooks. Euteneuer and McIntosh 1981, 1982 [56,57]. This image is displayed under the terms of a Creative Commons License (Attribution-Noncommercial-Share Alike 3.0 Unported license, as described at http://creativecommons.org/licenses/by-nc-sa/3.0/.
Figure 16
Figure 16
MTs, chromosomes and their interactions in the dinoflagellate, Amphidium. MTs run in a cytoplasmic channel, but some of them are connected to chromosomes through the nuclear envelope. From Oakley and Dodge [63]. This image is displayed under the terms of a Creative Commons License (Attribution-Noncommercial-Share Alike 3.0 Unported license, as described at http://creativecommons.org/licenses/by-nc-sa/3.0/.
Figure 17
Figure 17
Diagrams of meiotic (A) and mitotic (B) cell divisions. With permission from the Taylor Francis Group, publishers.
Figure 18
Figure 18
Typical pre-metaphase stretch of bivalent chromosomes in Stagmomantis carolina, a mantid. The kinetochores of homologous chromosomes are pulled far apart during Meiosis I in this species. 14 = early prometaphase, 15 is later. From Hughes-Schrader, 1943 [131]. With permission from the University of Chicago Press.
Figure 19
Figure 19
A crane fly spermatocyte irradiated during metaphase. (A1) autosomes labeled with arrow; (A2,A3) the position to be irradiated is indicated by a bracket; (A4) UV = the ultraviolet irradiation; (B1,B2,B3,C2) The position of the area of reduced birefringence (on the chromosomal fiber of the left bivalent) is indicated by a bracket; (B2) the autosomes labeled with arrows. The times of the photographs in minutes relative to the time of irradiation. A1, −11; A2, −7; A3, −5; A4, −0.5; B1, +2; B2, +2.5; B3, +6; B4, +7; C1, +10; C2, +14.5; C3, +18.5; C4, +19.5. The area of reduced birefringence moved to the pole, and did not displace the pole when it arrived there. From Forer, 1966 [144]. This image is displayed under the terms of a Creative Commons License (Attribution-Noncommercial-Share Alike 3.0 Unported license, as described at http://creativecommons.org/licenses/by-nc-sa/3.0/.
Figure 20
Figure 20
Changes in spindle birefringence (BR) in the half spindle as measured by a video spot meter. (a) Tracing of the chart record of the video voltage following injection of colchicine (0.2 mM) into a first division metaphase cell. The characteristic time, Δτ, of nonkinetochore MT depolymerization is measured by the time between the onset of BR decay and the time where the video voltage decreases to 10% of the initial value. The line is a first-order decay curve for k = 0.092. Spindle BR is normalized by the initial value at the time of injection; (b) Comparison of the rate of disappearance of normalized spindle BR after 1.5 mM intracellular colchicine injection with the normal rate of half-spindle disassembly at late anaphase. From Salmon et al., 1984 [149]. This image is displayed under the terms of a Creative Commons License (Attribution-Noncommercial-Share Alike 3.0 Unported license, as described at http://creativecommons.org/licenses/by-nc-sa/3.0/.
Figure 21
Figure 21
Phase-contrast and three fluorescence images of the cell to be analyzed. Times relative to photoactivation are (from left to right): 418, 5, 429, 674 s. Pole to pole distance = 18.8 µm. From Mitchison, 1989 [157]. This image is displayed under the terms of a Creative Commons License (Attribution-Noncommercial-Share Alike 3.0 Unported license, as described at http://creativecommons.org/licenses/by-nc-sa/3.0/.

References

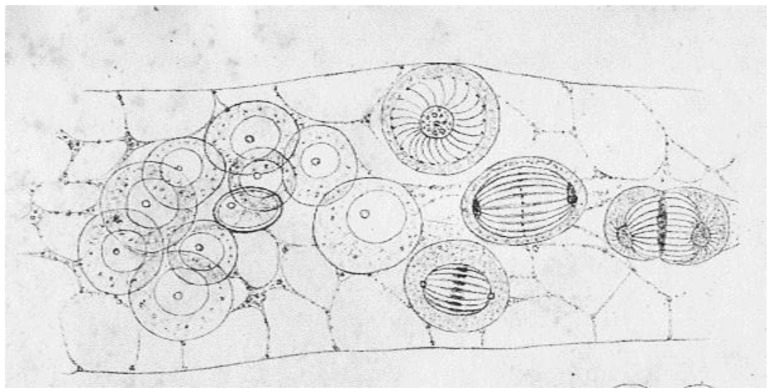
    1. Schneider A. Bericht der Oberhessischen Gesellschaft für Natur- und Heilkunde. Volume 14. Upper-Hessian Society for Natural and Medical Science; Giessen, Hesse, Germany: 1873. Untersuchungen über Plathelminthen. (In German)
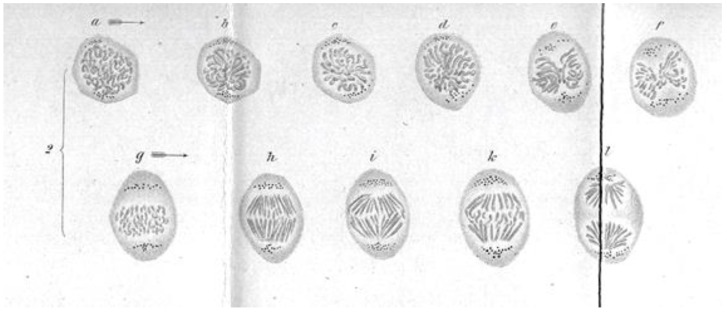
    1. Strasburger E. Zellbildung und Zelltheilung “Cell Formation and Cell Division”. Gustav Fischer; Jena, Germany: 1880.
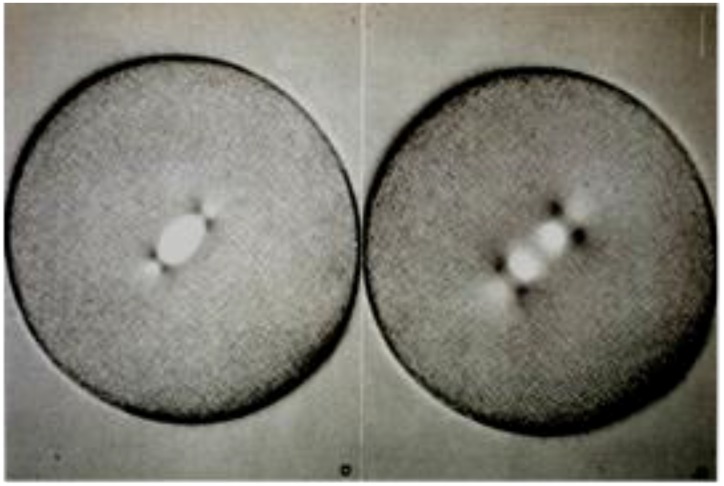
    1. Van Beneden E. Recherches sur les Dicyemides. Bull. Acad. R. 1876;41:1–111.
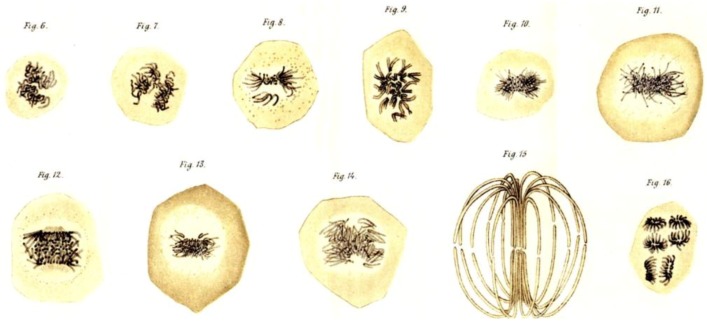
    1. Flemming W. Zur Kenntniss der Zelle und ihre Lebenserscheinungen. Arch. Mikr. Anat. 1878;16:302–436. doi: 10.1007/BF02956386. - DOI
    1. Flemming W. Contributions to the knowledge of the cell and its vital processes. J. Cell Biol. 1965;25:3–69. - PMC - PubMed

LinkOut - more resources