

Predicting neurosurgical outcomes in focal epilepsy patients using computational modelling
- PMID: 28011454
- PMCID: PMC5278304
- DOI: 10.1093/brain/aww299
Predicting neurosurgical outcomes in focal epilepsy patients using computational modelling
Abstract
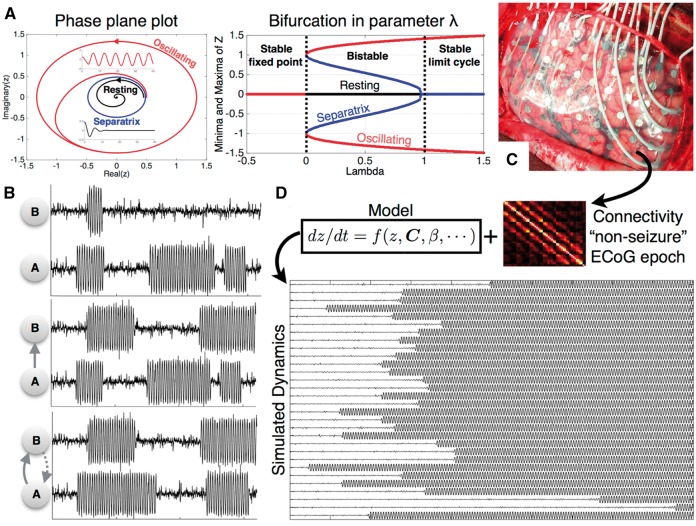
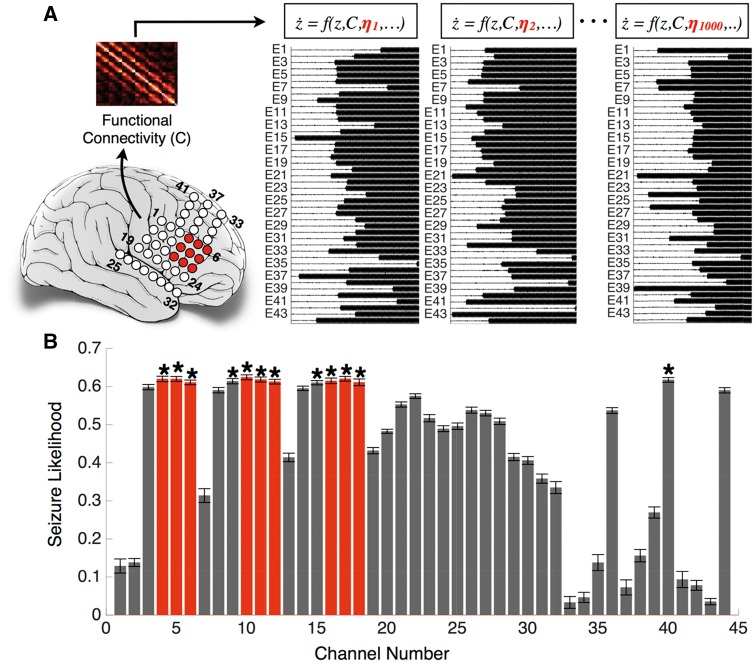
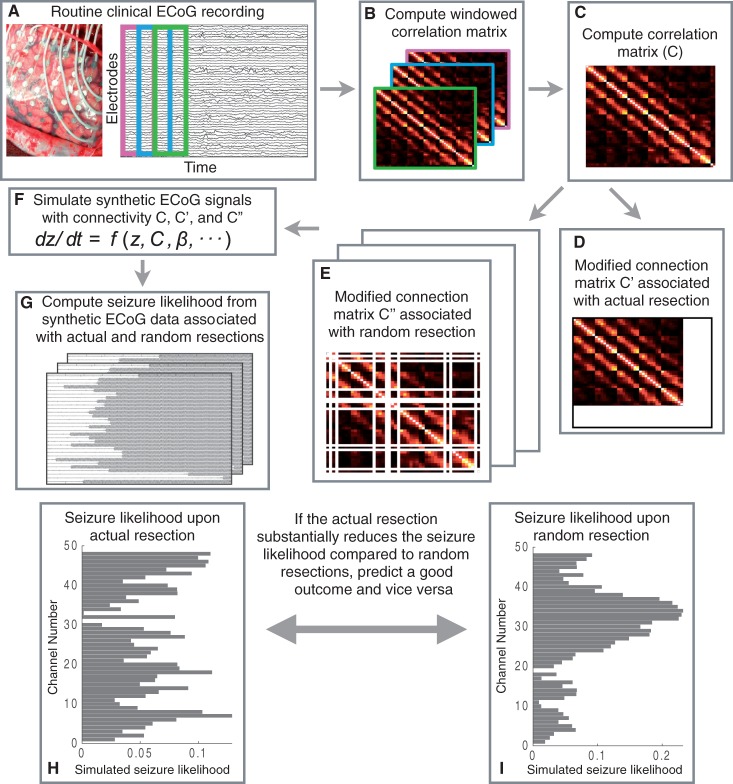
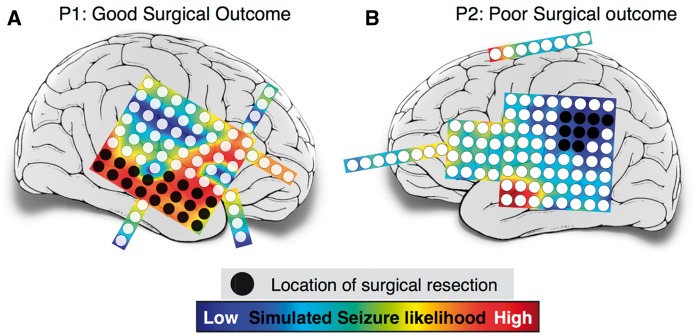
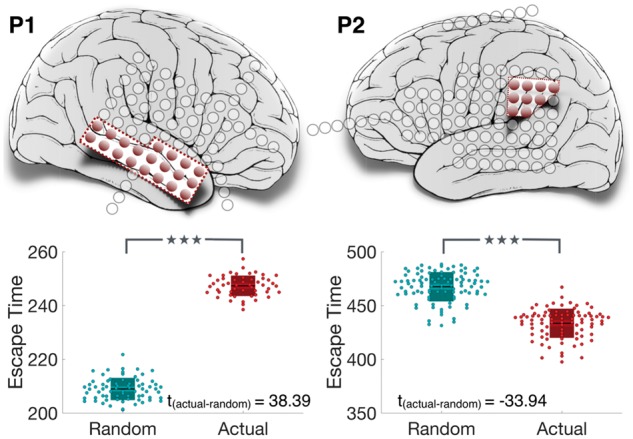
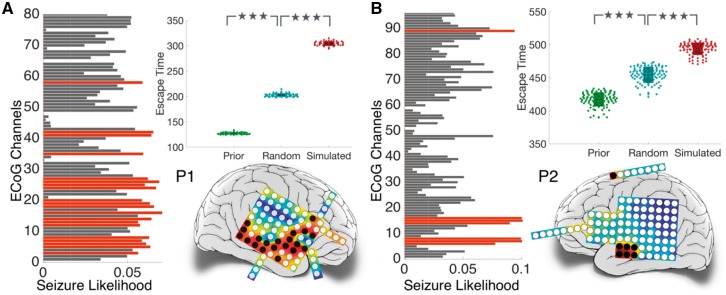
SEE EISSA AND SCHEVON DOI101093/AWW332 FOR A SCIENTIFIC COMMENTARY ON THIS ARTICLE: Surgery can be a last resort for patients with intractable, medically refractory epilepsy. For many of these patients, however, there is substantial risk that the surgery will be ineffective. The prediction of who is likely to benefit from a surgical approach is crucial for being able to inform patients better, conduct principled prospective clinical trials, and ultimately tailor therapeutic approaches to these patients more effectively. Dynamical computational models, informed with patient data, can be used to make predictions and give mechanistic insight. In this study, we develop patient-specific dynamical network models of epileptogenic cortex. We infer the network connectivity matrix from non-seizure electrographic recordings of patients and use these connectivity matrices as the network structure in our model. The model simulates the dynamics of a bi-stable switch at every node in this network, meaning that every node starts in a background state, but has the ability to transit to a co-existing seizure state. Whether a transition happens in a node is partly determined by the stochastic nature of the input to the node, but also by the input the node receives from other connected nodes in the network. By conducting simulations with such a model, we can detect the average transition time for nodes in a given network, and therefore define nodes with a short transition time as highly epileptogenic. In a retrospective study, we found that in some patients the regions with high epileptogenicity in the model overlap with those identified clinically as the seizure onset zone. Moreover, it was found that the resection of these regions in the model reduces the overall likelihood of a seizure. Following removal of these regions in the model, we predicted surgical outcomes and compared these to actual patient outcomes. Our predictions were found to be 81.3% accurate on a dataset of 16 patients with intractable epilepsy. Intriguingly, in patients with unsuccessful outcomes, the proposed computational approach is able to suggest alternative resection sites. The model presented here gives mechanistic insight as to why surgery may be unsuccessful in some patients. This may aid clinicians in presurgical evaluation by providing a tool to explore various surgical options, offering complementary information to existing clinical techniques.
Keywords: computational models; epilepsy; focal seizures; intracranial EEG; surgical outcome prediction.
© The Author (2016). Published by Oxford University Press on behalf of the Guarantors of Brain.
Figures
Comment in
-
The role of computational modelling in seizure localization.Brain. 2017 Feb;140(2):254-256. doi: 10.1093/brain/aww332. Brain. 2017. PMID: 28137953 Free PMC article.
-
Reply: Computer models to inform epilepsy surgery strategies: prediction of postoperative outcome.Brain. 2017 May 1;140(5):e31. doi: 10.1093/brain/awx068. Brain. 2017. PMID: 28334902 Free PMC article. No abstract available.
-
Computer models to inform epilepsy surgery strategies: prediction of postoperative outcome.Brain. 2017 May 1;140(5):e30. doi: 10.1093/brain/awx067. Brain. 2017. PMID: 28334981 Free PMC article. No abstract available.
-
Outcomes of Epilepsy Surgery for Epileptic Networks.Epilepsy Curr. 2017 May-Jun;17(3):160-162. doi: 10.5698/1535-7511.17.3.160. Epilepsy Curr. 2017. PMID: 28684949 Free PMC article. No abstract available.
References
-
- Armon C, Radtke RA, Friedman AH, Dawson DV. Predictors of outcome of epilepsy surgery: multivariate analysis with validation. Epilepsia 1996; 37: 814–21. - PubMed
-
- Aull-Watschinger S, Pataraia E, Czech T, Baumgartner C. Outcome predictors for surgical treatment of temporal lobe epilepsy with hippocampal sclerosis. Epilepsia 2008; 49: 1308–16. - PubMed
MeSH terms
Grants and funding
LinkOut - more resources
Full Text Sources
Other Literature Sources
Medical
Miscellaneous
