

Replication fork passage drives asymmetric dynamics of a critical nucleoid-associated protein in Caulobacter
- PMID: 28011580
- PMCID: PMC5286365
- DOI: 10.15252/embj.201695513
Replication fork passage drives asymmetric dynamics of a critical nucleoid-associated protein in Caulobacter
Abstract
In bacteria, chromosome dynamics and gene expression are modulated by nucleoid-associated proteins (NAPs), but little is known about how NAP activity is coupled to cell cycle progression. Using genomic techniques, quantitative cell imaging, and mathematical modeling, our study in Caulobacter crescentus identifies a novel NAP (GapR) whose activity over the cell cycle is shaped by DNA replication. GapR activity is critical for cellular function, as loss of GapR causes severe, pleiotropic defects in growth, cell division, DNA replication, and chromosome segregation. GapR also affects global gene expression with a chromosomal bias from origin to terminus, which is associated with a similar general bias in GapR binding activity along the chromosome. Strikingly, this asymmetric localization cannot be explained by the distribution of GapR binding sites on the chromosome. Instead, we present a mechanistic model in which the spatiotemporal dynamics of GapR are primarily driven by the progression of the replication forks. This model represents a simple mechanism of cell cycle regulation, in which DNA-binding activity is intimately linked to the action of DNA replication.
Keywords: Caulobacter; DNA replication; cell cycle; chromosome organization; nucleoid‐associated protein.
© 2016 The Authors.
Figures
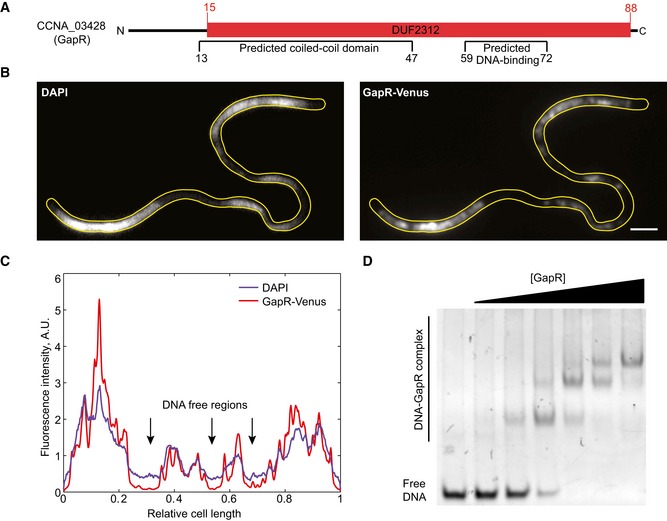
Schematic of GapR protein domain organization. The predicted DNA‐binding domain and coiled‐coil regions were identified with the software BindN (Wang & Brown, 2006) and COILS (Lupas et al, 1991), respectively.
Fluorescence images showing GapR‐Venus colocalizing with DAPI‐stained DNA in a Caulobacter crescentus temperature‐sensitive parE and ftsA mutant (CJW5795) that produces DNA‐free regions. Cells were cultured at the restrictive temperature (37°C) for 6 h in M2G medium prior to DAPI staining and imaging. Scale bar = 2 μm.
Fluorescence intensity profiles of GapR‐Venus and DAPI signals along the long axis of the cell shown in panel (B).
EMSA showing recombinant GapR purified from Escherichia coli binding to a 50‐bp DNA sequence. See Appendix Supplementary Methods for experimental details.
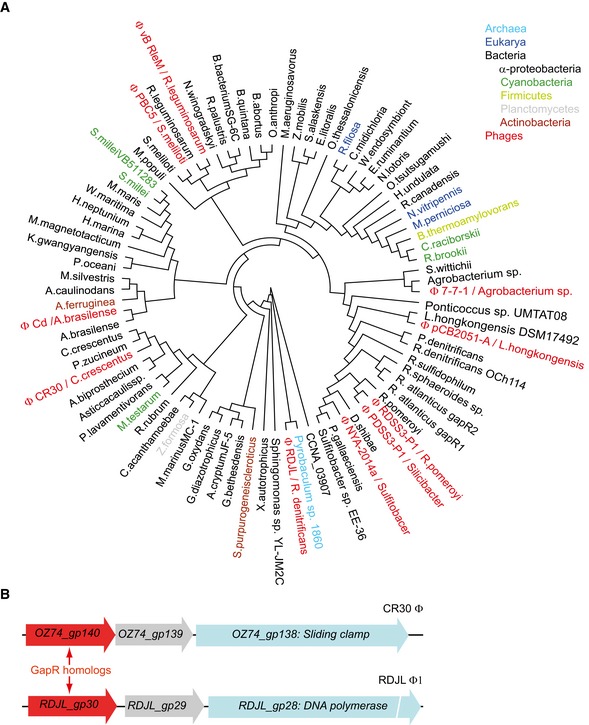
Shown is a protein phylogenetic tree composed of representative members of DUF2312 (pfam10073) found in archaea, eukarya, bacteria, and phages. See Appendix Supplementary Methods for tree construction.
Examples of gapR homologs in the genome of phages CR30ϕ and RDJLϕ1 in which gapR homologs are located close to genes encoding the sliding clamp and the DNA polymerase, respectively.
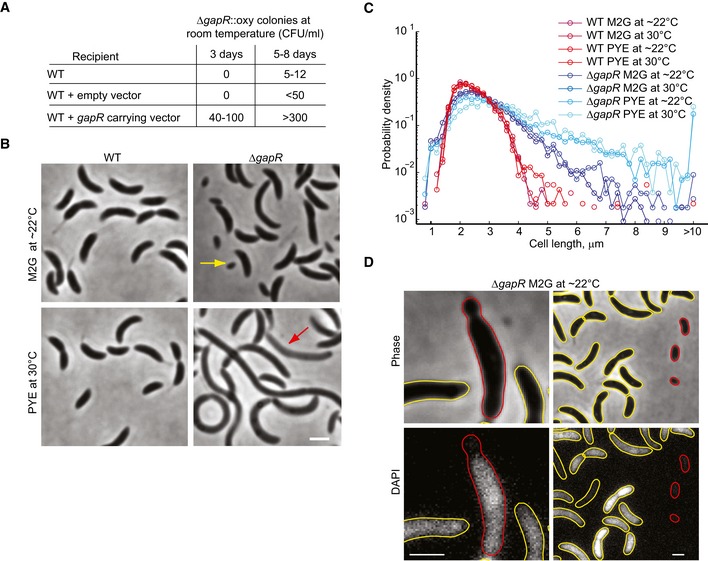
Colony count of oxytetracycline‐resistant (oxy) ΔgapR mutants generated by phage transduction of the ΔgapR::oxy mutation into the Caulobacter crescentus wild‐type strain (WT), a strain harboring an empty vector (CJW5789), or a strain harboring a vector carrying gapR (CJW5791). CFU = colony‐forming units.
Phase‐contrast images of WT and ΔgapR (CJW5747) strains grown at room temperature in M2G or at 30°C in PYE. Yellow and red arrows indicate a minicell and cell lysis, respectively. Scale bar = 2 μm.
Cell‐length distributions of exponentially growing populations of the ΔgapR (CJW5747) and WT strains in the indicated medium and temperature (n > 1,300 cells for each condition).
Representative images of minicells (right panels) and minicell formation (left panels) in the ΔgapR mutant. The red outlines identify the minicells or the minicelling process from the yellow outlines. DNA was visualized by DAPI staining. Scale bars = 1 μm.
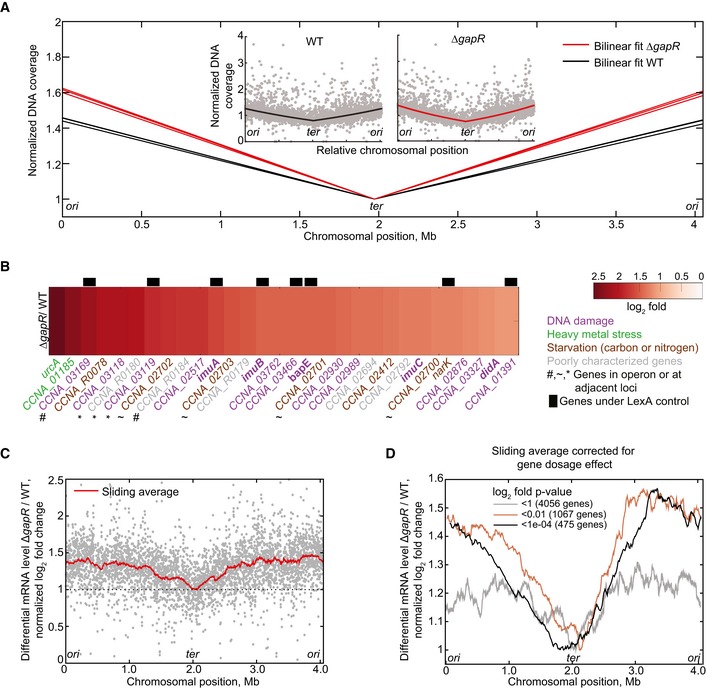
Bilinear fit of normalized coverage for three independent genome‐wide DNA sequencing experiments of exponentially growing cells of the wild‐type (black lines) and ΔgapR (CJW5747, red lines) strains. Inset: Individual normalized DNA coverage (gray dots) of a single experiment for wild‐type strain and ΔgapR, showing coverage in read count per nucleotide for each gene.
Differential transcription log2 ratio for the 30 most upregulated genes in the ΔgapR strain relative to the WT strain. Gene function is represented by the indicated color code. Genes known to be under the transcriptional control of LexA (da Rocha et al, 2008; Modell et al, 2014) are represented with black bars. Gene function is represented with the following color code: purple, DNA damage and repair (Galhardo et al, 2005; Modell et al, 2011, 2014; Bos et al, 2012); green, genes involved in the heavy metal stress response (Hu et al, 2005); brown, genes involved in carbon starvation‐stress response (McGrath et al, 2007; Britos et al, 2011; Le & Laub, 2016) or nitrogen limitation (England et al, 2010); gray, poorly characterized genes.
Genome‐wide differential mRNA levels between ΔgapR and WT in log2 fold change for single genes (gray dots) and for a 200‐gene sliding window average (red line). The RNA‐seq profile was shifted to set the average log2 fold change of the terminus region at 1 to show the relative difference in differential gene expression between ori and ter regions.
Gene‐dosage‐corrected differential mRNA levels between ΔgapR and WT in log2 fold change for a 200‐gene sliding window average considering genes with different P‐value thresholds. To correct for the gene dosage difference between ΔgapR and WT, we multiplied the transcript ratio of ΔgapR/WT by the gene‐copy‐number ratio WT/ΔgapR on a gene‐by‐gene basis (RNA‐seq and DNA‐seq were performed on the same samples). The values were then log2‐transformed and normalized as in (C).
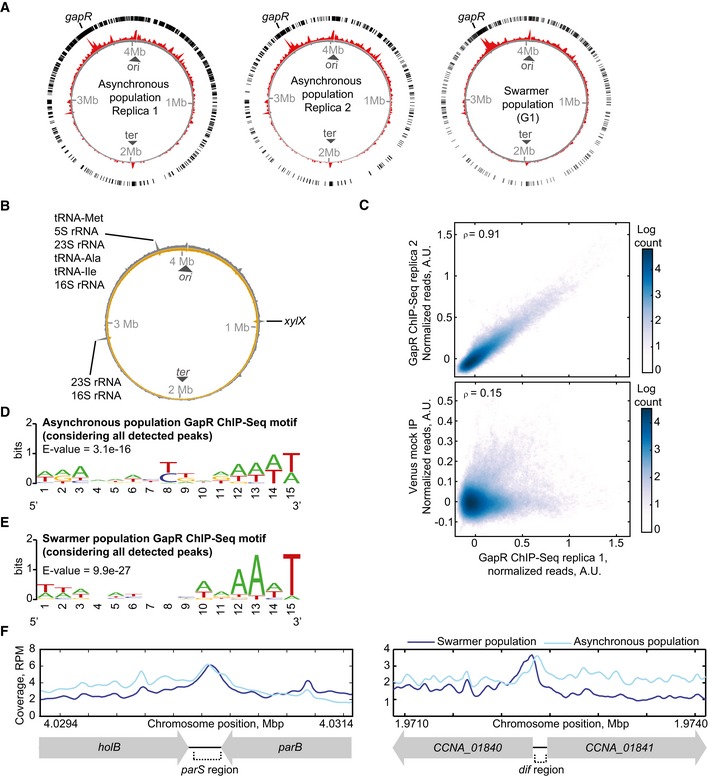
Whole‐genome profile of GapR‐Venus normalized ChIP‐seq read counts for two replicates of asynchronous populations (left and middle panels) and for a swarmer population (right panel) of strain CJW5534. The circle with exterior black bars shows the distribution of ChIP‐seq peaks detected with MACS2 software. The inner red circle shows the normalized ChIP‐seq read counts. The gray inner circle shows the level of total DNA before immunoprecipitation by GapR‐Venus. The location of the gapR locus in the Caulobacter crescentus chromosome is indicated.
Whole‐genome profile of normalized ChIP‐seq read counts for mock immunoprecipitation performed with the freely diffusing Venus protein expressed at the xylX locus (strain CJW5796). Exterior gray circle shows normalized ChIP‐seq read counts following immunoprecipitation with Venus. Light brown inner circle shows the level of total DNA before immunoprecipitation by Venus. The location of ribosome‐ and tRNA‐encoding loci and of the xylX locus is indicated.
Pearson correlation at the single‐nucleotide level in normalized read counts between two independent replicates of the GapR‐Venus ChIP‐seq experiment and between GapR‐Venus ChIP‐seq and the mock immunoprecipitation with freely diffusing Venus.
Best MEME consensus‐sequence motif for GapR binding using ChIP‐seq data from an asynchronous cell population. For this analysis, all peaks were considered, including peaks detected at ribosomal, tRNA, and gapR loci.
Same as (D) but from a swarmer cell population.
GapR‐Venus ChIP‐seq coverage at the parS and dif regions.
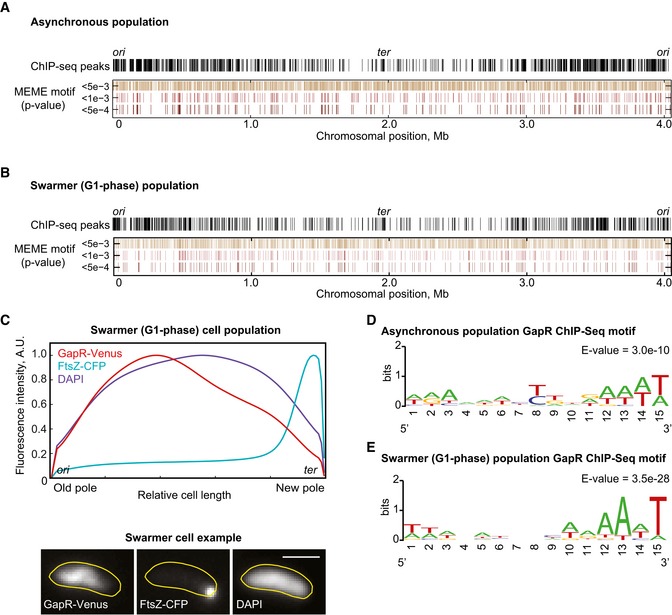
Whole‐genome profile of GapR‐Venus ChIP‐seq peaks in an asynchronous population of strain CJW5534 and the genome distribution of hits for the MEME motif according to different P‐value thresholds.
Same as in (A) but for a swarmer cell population.
Average cellular fluorescent signal of DAPI, GapR‐Venus, and FtsZ‐CFP from 502 synchronized swarmer cells (CJW5535). An example of fluorescence images is shown below. Scale bar = 1 μm.
Best MEME consensus‐sequence motif for an asynchronous cell population.
Same as (D) but for a swarmer cell population.
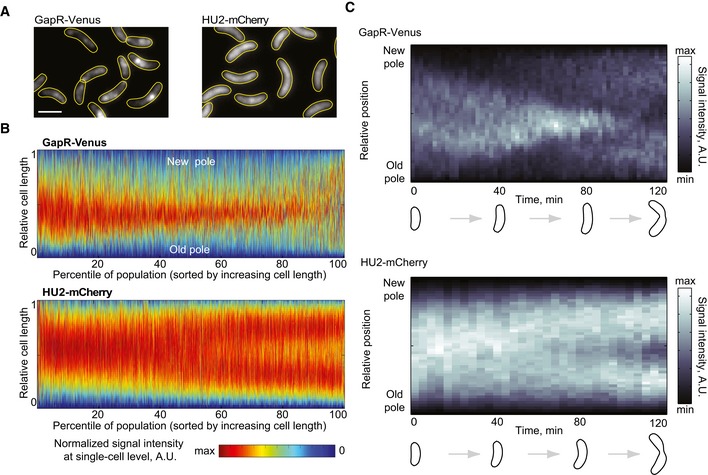
Fluorescence images of an asynchronous population expressing GapR‐Venus (CJW5800) or HU2‐mCherry (CJW5806). Scale bar = 2 μm.
Demographs of asynchronous populations (n = 2,700 cells) showing the cell cycle localization of GapR‐Venus (strain CJW5800) or HU2‐mCherry (strain CJW5806). Each fluorescent profile across the cell was normalized by cell length. Cells were sorted by increasing cell length. Cell coordinates in the GapR‐Venus demograph were oriented using new‐pole marker TipN‐CFP.
Kymographs of a time‐lapse experiment showing a cell producing either GapR‐Venus (strain CJW5535) or HU2‐mCherry (strain CJW5960). The identity of the cell poles was determined by using new‐pole markers FtsZ‐CFP (for the gapR‐venus‐expressing strain) or TipN‐CFP (for the hu2‐mcherry‐expressing strain). The schematics show cell outlines from the Oufti software.
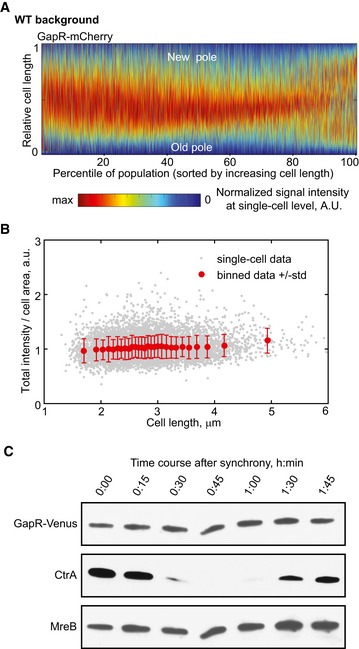
Demograph of an asynchronous population (n = 4,266 cells) showing the cell cycle localization of GapR‐mCherry (strain CJW5810), shown in absolute cell‐length scale. Cells were sorted by increasing cell length, and cell coordinates were oriented using new‐pole marker TipN‐GFP.
Fluorescence intensity of GapR‐Venus (total intensity divided by cell area) for cells represented in the demograph shown in (A; strain CJW5810, top panel). Cells were sorted by length as in (A). Gray dot = single‐cell value. Red dot and bar = mean ± standard deviation value for 300 cells.
Western blot of cell lysates collected every 15 min from a synchronized cell culture of CJW5534, in which GapR‐Venus is expressed from its native chromosomal locus and promoter. CtrA and MreB were used as cell‐cycle‐synchronization and loading controls, respectively. See Appendix Supplementary Methods for Western blot experimental conditions.
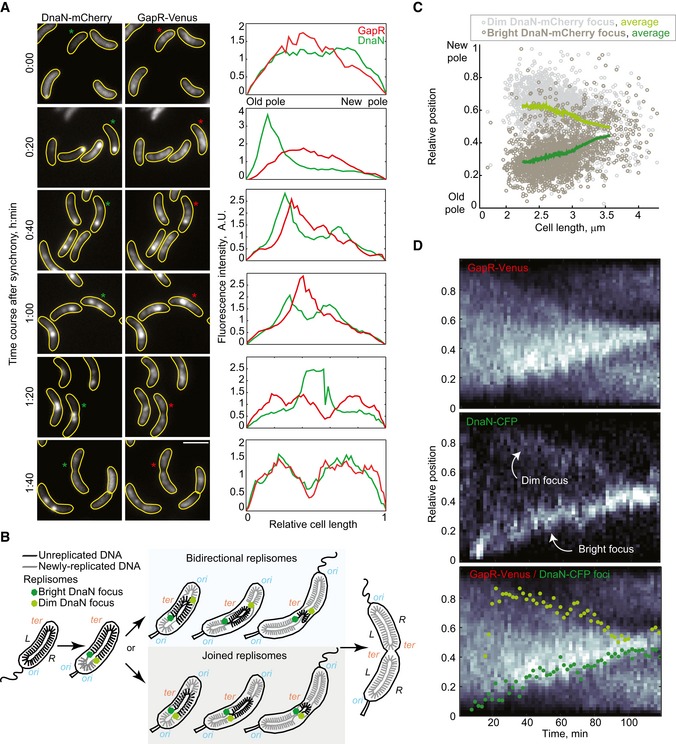
Images showing GapR‐Venus and DnaN‐mCherry localization in a time‐course experiment (CJW5744) following cell cycle synchronization. After synchronization, cells were resuspended in M2G liquid medium and incubated at 30°C, and samples were taken for imaging every 20 min and imaged. Fluorescence intensity profiles along the cell length are shown for cells marked with an asterisk. Scale bar = 2 μm.
Schematic showing the organization of the unreplicated and replicated chromosomal DNA coordinated with replisome dynamics during the Caulobacter crescentus cell cycle. The two replisomes move toward midcell, either in a joined fashion from the old pole or bidirectionally from opposite poles. The origin (ori) and terminus (ter) of replication as well as the left (L) and right (R) arms of the chromosome are indicated.
Relative locations of dim and bright DnaN‐mCherry foci in cells exhibiting two foci. See Code EV1 information for details of focus detection algorithm.
Kymographs of single‐cell time‐lapse microscopy experiment. After synchronization, swarmer cells (CJW5836) were spotted into a 1% agarose M2G pad at ~25° and imaged every 2 min. The bottom panel shows the kymograph of GapR‐Venus overlaid with the position of the dim (light green) and bright (dark green) DnaN‐CFP foci.
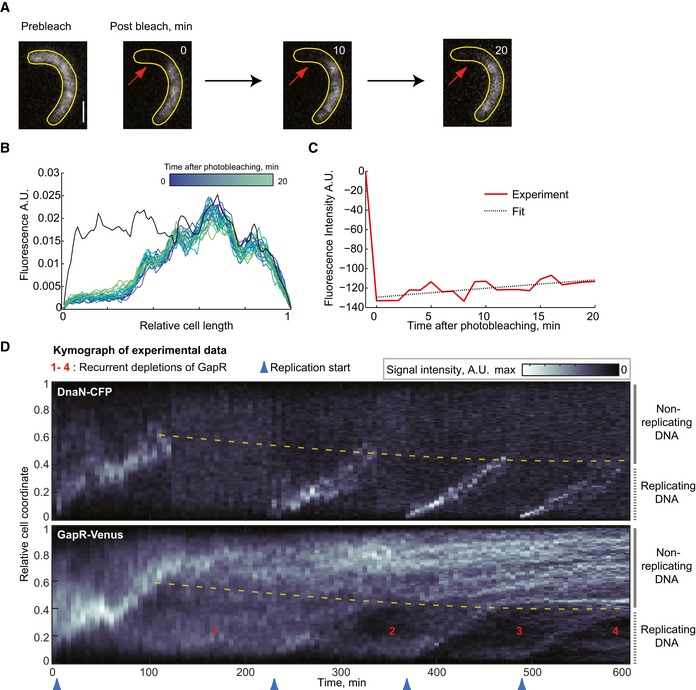
Selected images of a FRAP experiment of GapR‐Venus in a cell (CJW5808) following synchrony and FtsZ depletion (through removal of the xylose inducer of ftsZ expression). The red arrows indicate photobleached area (left). Scale bar = 1 μm. See Appendix Supplementary Methods for FRAP experimental conditions and analysis.
Evolution of GapR‐Venus fluorescence profile for the cell represented in (A). For each time point, the signal was normalized to the total fluorescence per cell, except for the signal before photobleaching (black line), which was rescaled according to the total fluorescence during bleaching.
Plot showing the change in fluorescence signal in the photobleached region (red line) before and following photobleaching for the cell represented in (A). The black dotted line is the best fit of exponential recovery, which gives τ = 135 min.
Kymographs of an FtsZ‐depleted cell expressing GapR‐Venus and DnaN‐CFP (CJW5808). FtsZ depletion was initiated after synchronization by allowing cells to resume cell cycle progression without xylose (ftsZ expression inducer).
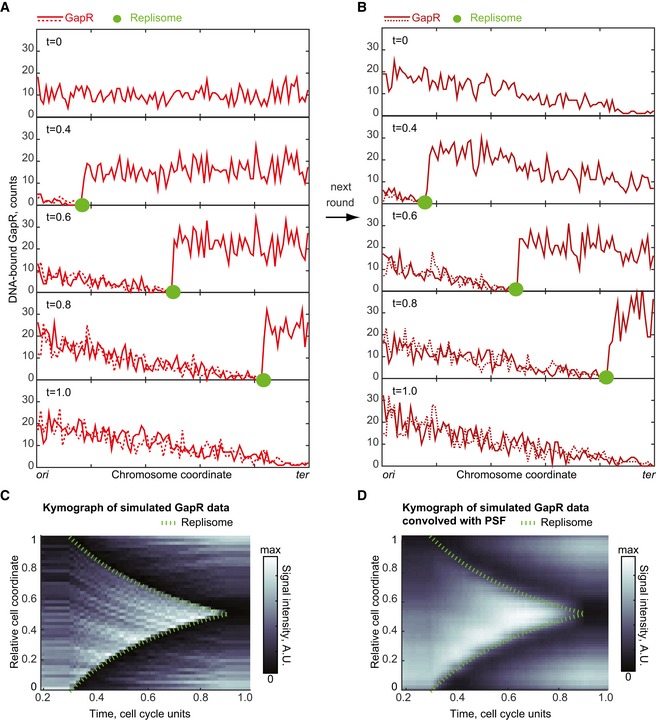
One‐dimensional simulation of the replication‐eviction model showing the evolution of GapR distribution on replicated and unreplicated DNA during replisome progression. GapR is synthesized throughout the cell cycle such that its amount (1,000 molecules) has doubled by the end of the cell cycle. At t = 0 (in cell cycle unit), GapR binding along the chromosome is uniform. We assume that replication starts at t = 0.3 and ends at t = 0.9. The replisome moves at a constant speed from ori to ter and leaves behind two copies of the replicated DNA region (sister chromatids). When the replisome encounters GapR, the replisome displaces GapR from the DNA. The displaced GapR is then randomly re‐distributed, with uniform probability over the two replicated regions and the unreplicated region. See text and Appendix Supplementary Methods for Model simulations.
Same as in (A), but starting with the GapR distribution at t = 1 in panel (A) to show the effect of a second round of replisome progression on GapR distribution on replicated and unreplicated DNA.
Kymograph of simulated GapR distribution over cell cycle time in wild‐type cells. The green dashed line indicates replisome progression. GapR distribution between t = 0 and t = 0.2 is the same as between t = 0.2 and t = 0.3.
Same as (C) but after convolution of the GapR signal with a PSF approximated by a Gaussian with a standard deviation of our optical setup (0.065 in relative cell‐length units).
References
-
- Bremer H, Churchward G (1977) An examination of the Cooper‐Helmstetter theory of DNA replication in bacteria and its underlying assumptions. J Theor Biol 69: 645–654 - PubMed
Publication types
MeSH terms
Substances
Grants and funding
LinkOut - more resources
Full Text Sources
Other Literature Sources
Molecular Biology Databases
Research Materials
