

Sunitinib Treatment Enhances Metastasis of Innately Drug-Resistant Breast Tumors
- PMID: 28011623
- PMCID: PMC5321582
- DOI: 10.1158/0008-5472.CAN-16-1982
Sunitinib Treatment Enhances Metastasis of Innately Drug-Resistant Breast Tumors
Abstract
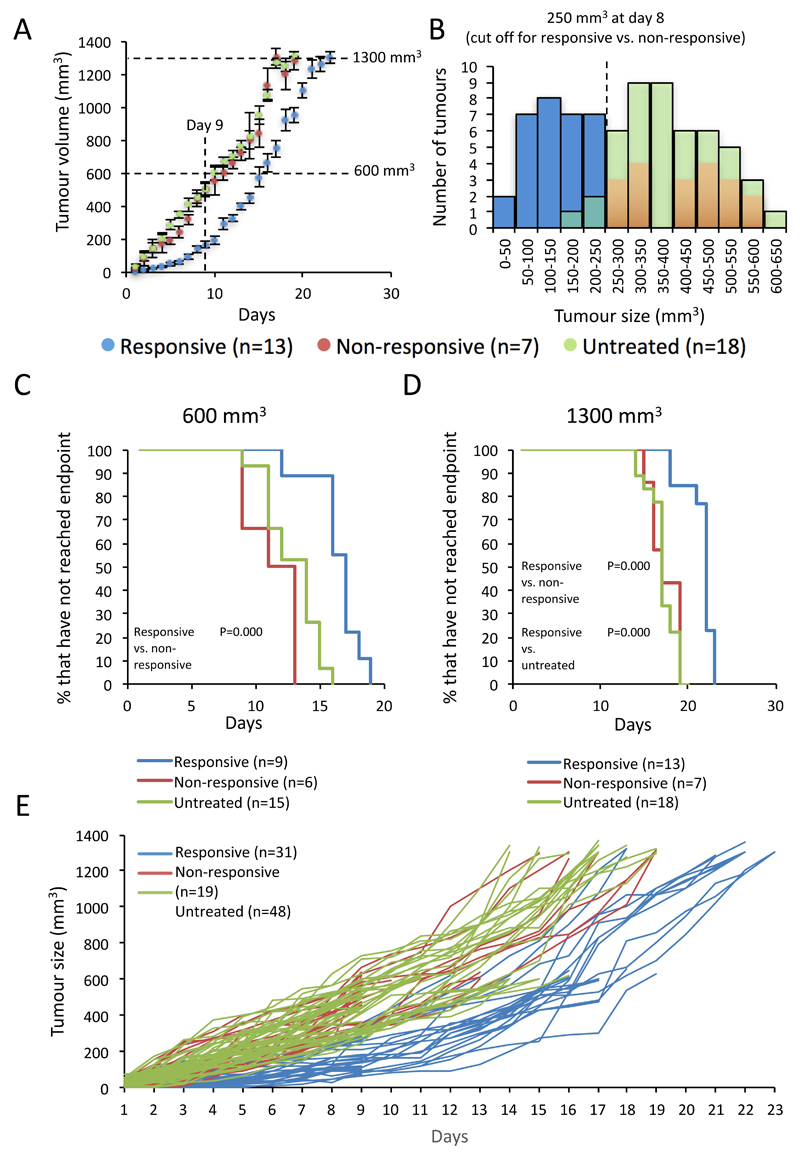
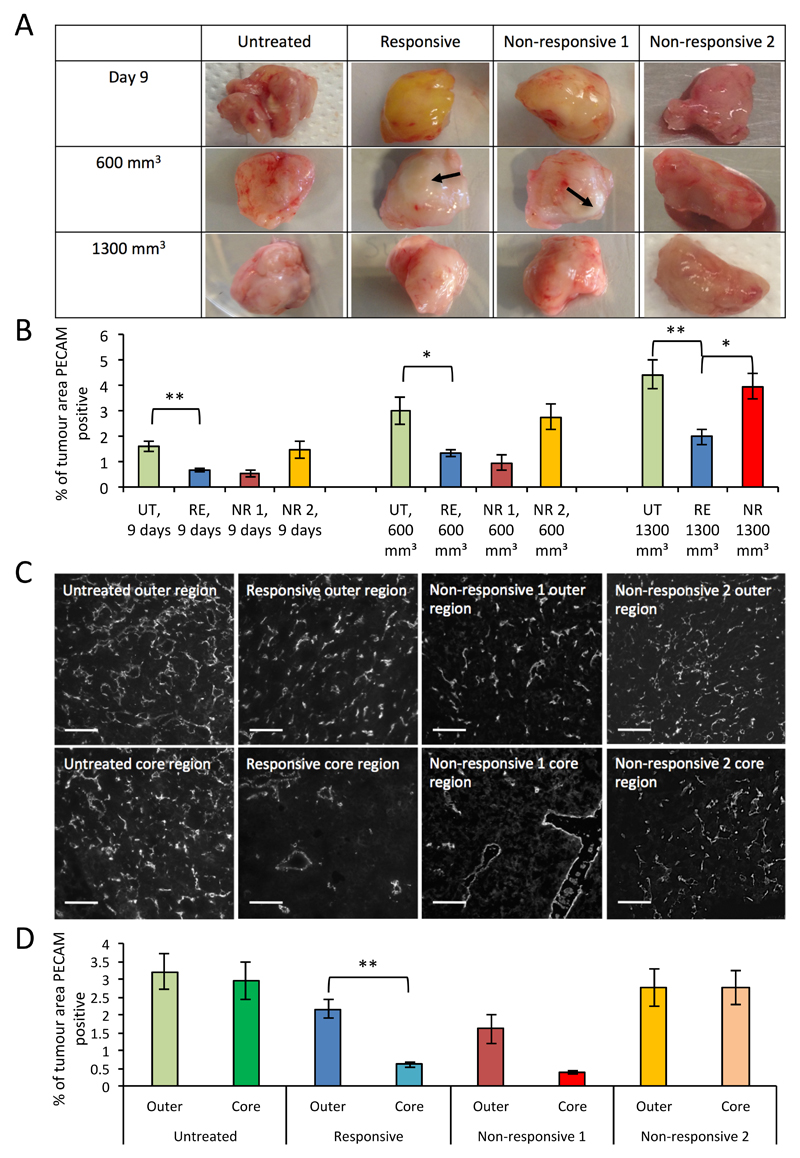
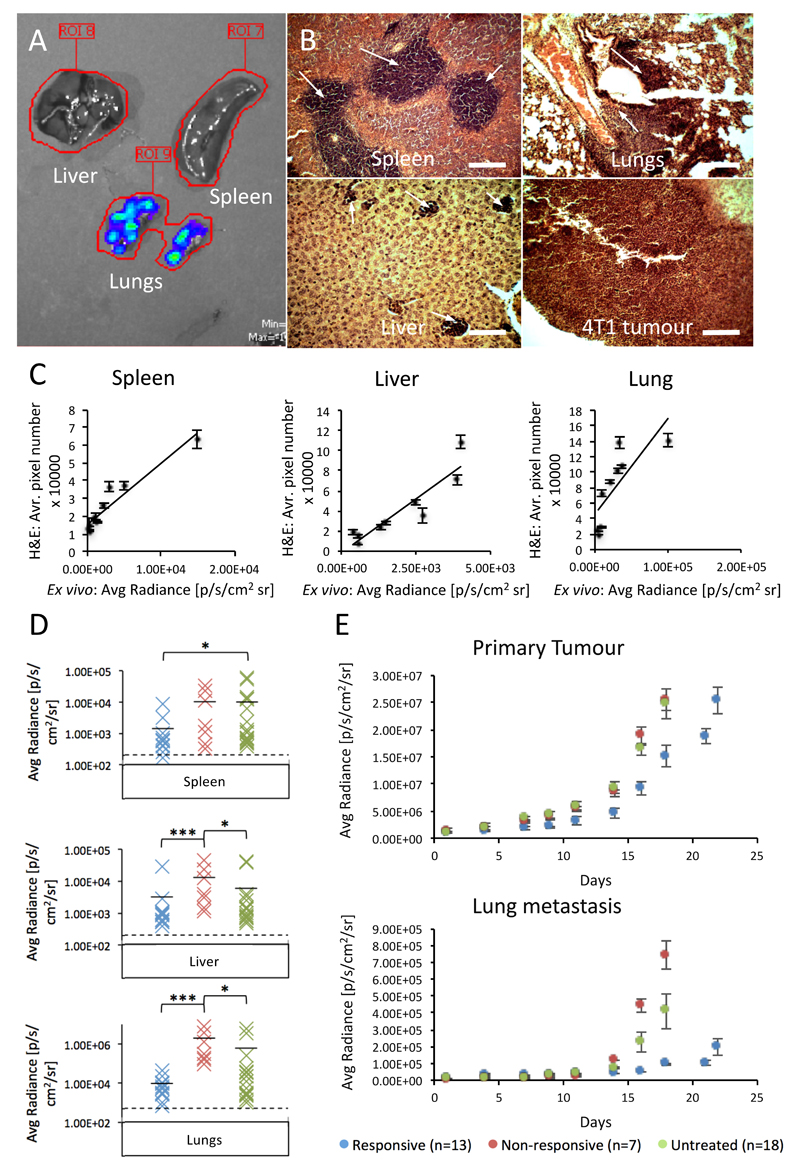
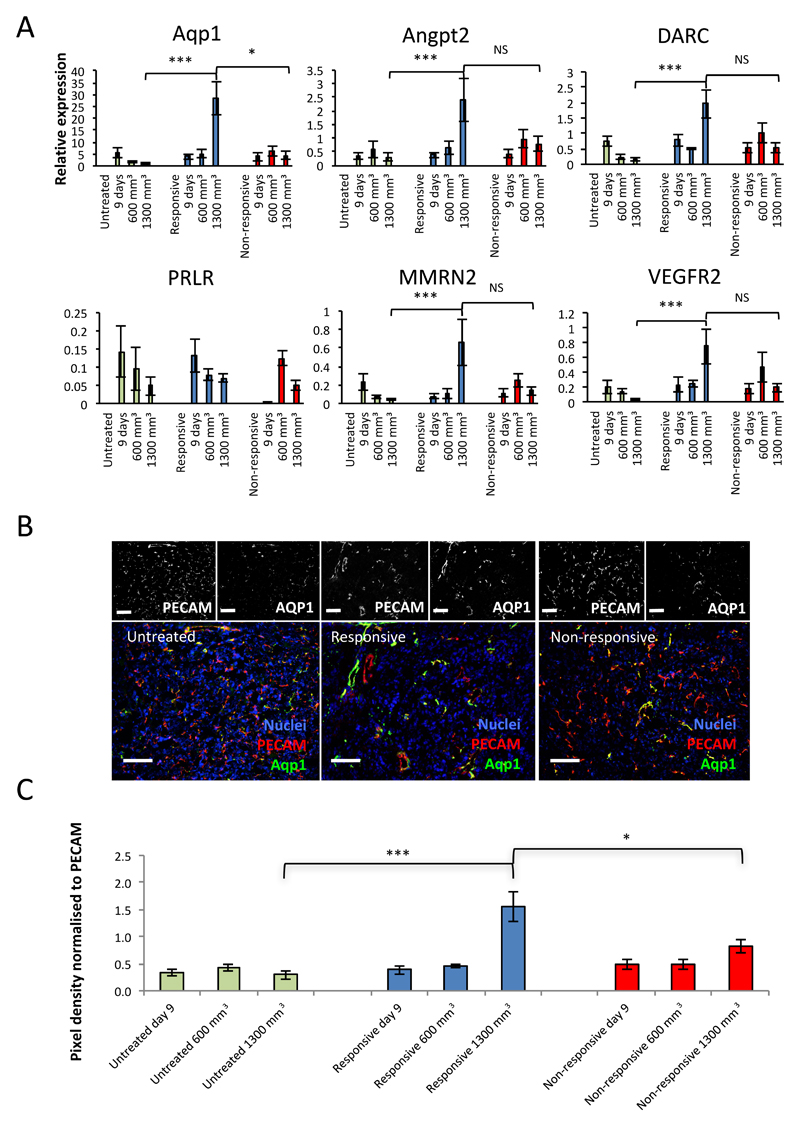
Antiangiogenic therapies have failed to confer survival benefits in patients with metastatic breast cancer (mBC). However, to date, there has not been an inquiry into the roles for acquired versus innate drug resistance in this setting. In this study, we report roles for these distinct phenotypes in determining therapeutic response in a murine model of mBC resistance to the antiangiogenic tyrosine kinase inhibitor sunitinib. Using tumor measurement and vascular patterning approaches, we differentiated tumors displaying innate versus acquired resistance. Bioluminescent imaging of tumor metastases to the liver, lungs, and spleen revealed that sunitinib administration enhances metastasis, but only in tumors displaying innate resistance to therapy. Transcriptomic analysis of tumors displaying acquired versus innate resistance allowed the identification of specific biomarkers, many of which have a role in angiogenesis. In particular, aquaporin-1 upregulation occurred in acquired resistance, mTOR in innate resistance, and pleiotrophin in both settings, suggesting their utility as candidate diagnostics to predict drug response or to design tactics to circumvent resistance. Our results unravel specific features of antiangiogenic resistance, with potential therapeutic implications. Cancer Res; 77(4); 1008-20. ©2016 AACR.
©2016 American Association for Cancer Research.
Conflict of interest statement
The authors disclose no potential conflicts of interest.
Figures
Similar articles
-
Monitoring the Vascular Response and Resistance to Sunitinib in Renal Cell Carcinoma In Vivo with Susceptibility Contrast MRI.Cancer Res. 2017 Aug 1;77(15):4127-4134. doi: 10.1158/0008-5472.CAN-17-0248. Epub 2017 May 31. Cancer Res. 2017. PMID: 28566330 Free PMC article.
-
Reappraising antiangiogenic therapy for breast cancer.Breast. 2011 Oct;20 Suppl 3(0 3):S56-60. doi: 10.1016/S0960-9776(11)70295-8. Breast. 2011. PMID: 22015294 Free PMC article. Review.
-
Antitumor effect of vascular endothelial growth factor inhibitor sunitinib in preclinical models of hepatocellular carcinoma.Eur J Gastroenterol Hepatol. 2012 May;24(5):563-74. doi: 10.1097/MEG.0b013e328350916f. Eur J Gastroenterol Hepatol. 2012. PMID: 22314934
-
Sunitinib inhibits tumor growth and synergizes with cisplatin in orthotopic models of cisplatin-sensitive and cisplatin-resistant human testicular germ cell tumors.Clin Cancer Res. 2009 May 15;15(10):3384-95. doi: 10.1158/1078-0432.CCR-08-2170. Epub 2009 May 5. Clin Cancer Res. 2009. PMID: 19417025
-
Preclinical recapitulation of antiangiogenic drug clinical efficacies using models of early or late stage breast cancer metastatis.Breast. 2013 Aug;22 Suppl 2:S57-65. doi: 10.1016/j.breast.2013.07.011. Breast. 2013. PMID: 24074794 Review.
Cited by
-
Sunitinib facilitates metastatic breast cancer spreading by inducing endothelial cell senescence.Breast Cancer Res. 2020 Sep 29;22(1):103. doi: 10.1186/s13058-020-01346-y. Breast Cancer Res. 2020. PMID: 32993785 Free PMC article.
-
Network-Derived Radioresistant Breast Cancer Target with Candidate Inhibitors from Brown Algae: A Sequential Assessment from Target Selection to Quantum Chemical Calculation.Mar Drugs. 2023 Oct 19;21(10):545. doi: 10.3390/md21100545. Mar Drugs. 2023. PMID: 37888480 Free PMC article.
-
Sunitinib treatment promotes metastasis of drug-resistant renal cell carcinoma via TFE3 signaling pathway.Cell Death Dis. 2021 Feb 26;12(2):220. doi: 10.1038/s41419-021-03511-3. Cell Death Dis. 2021. PMID: 33637706 Free PMC article.
-
Ginsenoside Rg3: Potential Molecular Targets and Therapeutic Indication in Metastatic Breast Cancer.Medicines (Basel). 2019 Jan 23;6(1):17. doi: 10.3390/medicines6010017. Medicines (Basel). 2019. PMID: 30678106 Free PMC article. Review.
-
Dual-Functional Polymeric Micelles Co-Loaded with Antineoplastic Drugs and Tyrosine Kinase Inhibitor for Combination Therapy in Colorectal Cancer.Pharmaceutics. 2022 Mar 31;14(4):768. doi: 10.3390/pharmaceutics14040768. Pharmaceutics. 2022. PMID: 35456602 Free PMC article.
References
-
- Gligorov J, Doval D, Bines J, Alba E, Cortes P, Pierga J-Y, et al. Lancet Oncol. Vol. 15. Elsevier; 2014. Maintenance capecitabine and bevacizumab versus bevacizumab alone after initial first-line bevacizumab and docetaxel for patients with HER2-negative metastatic breast cancer (IMELDA): a randomised, open-label, phase 3 trial; pp. 1351–60. - PubMed
-
- Patel NS, Li J-L, Generali D, Poulsom R, Cranston DW, Harris AL. Up-regulation of delta-like 4 ligand in human tumor vasculature and the role of basal expression in endothelial cell function. Cancer Res. 2005;65:8690–7. - PubMed
-
- Minckwitz von G, Minckwitz von G, Puglisi F, Puglisi F, Cortes J, Cortes J, et al. Lancet Oncol. Vol. 15. Elsevier; 2014. Bevacizumab plus chemotherapy versus chemotherapy alone as second-line treatment for patients with HER2-negative locally recurrent or metastatic breast cancer after first-line treatment with bevacizumab plus chemotherapy (TANIA): an open-label, randomised phase 3 trial; pp. 1269–78. - PubMed
-
- Crown JP, Dieras V, Staroslawska E, Yardley DA, Bachelot T, Davidson N, et al. Phase III Trial of Sunitinib in Combination With Capecitabine Versus Capecitabine Monotherapy for the Treatment of Patients With Pretreated Metastatic Breast Cancer. JCO American Society of Clinical Oncology. 2013;31:2870–8. - PubMed
MeSH terms
Substances
Grants and funding
LinkOut - more resources
Full Text Sources
Other Literature Sources
Medical
Molecular Biology Databases
Miscellaneous
