. 2017 Feb 15;6(2):176-186.
doi: 10.1242/bio.021261.

A feedback mechanism between PLD and deadenylase PARN for the shortening of eukaryotic poly(A) mRNA tails that is deregulated in cancer cells

Affiliations

A feedback mechanism between PLD and deadenylase PARN for the shortening of eukaryotic poly(A) mRNA tails that is deregulated in cancer cells

Taylor E Miller et al. Biol Open. .

Abstract

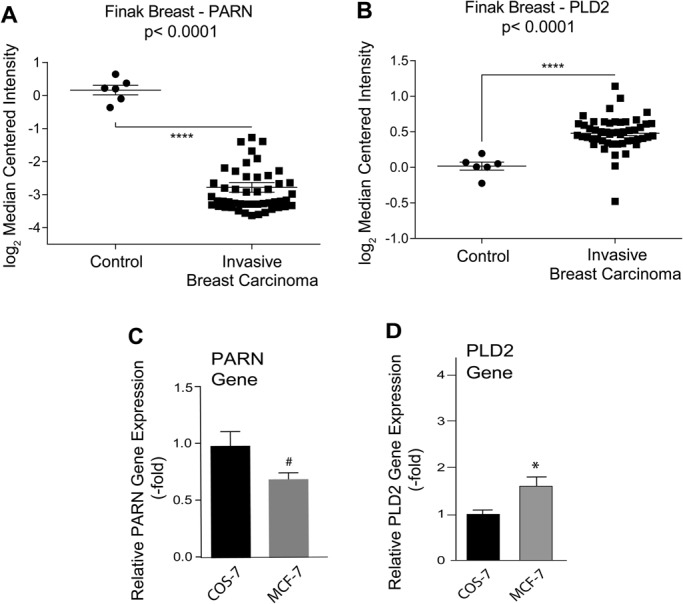
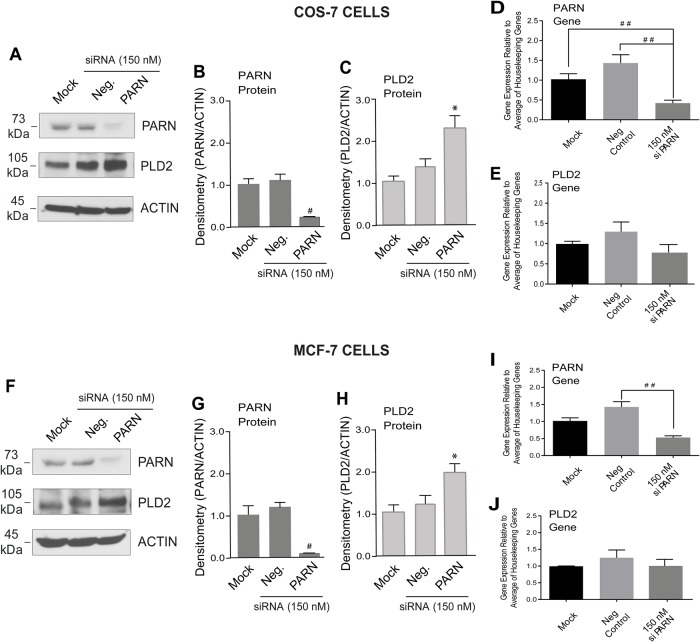
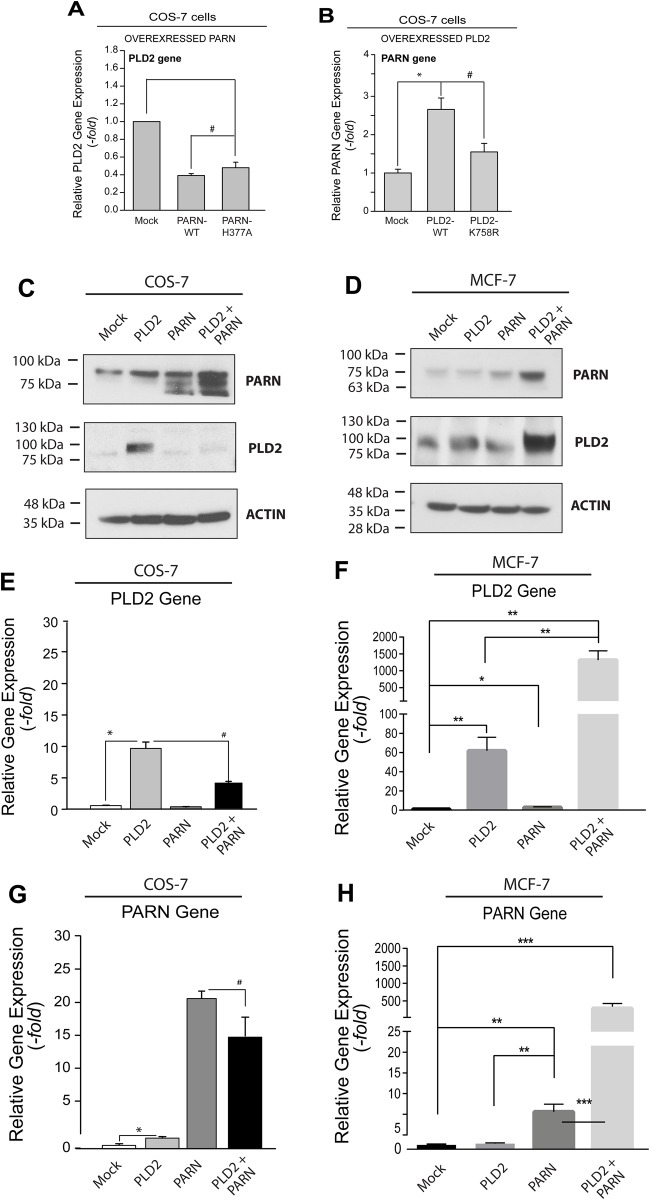
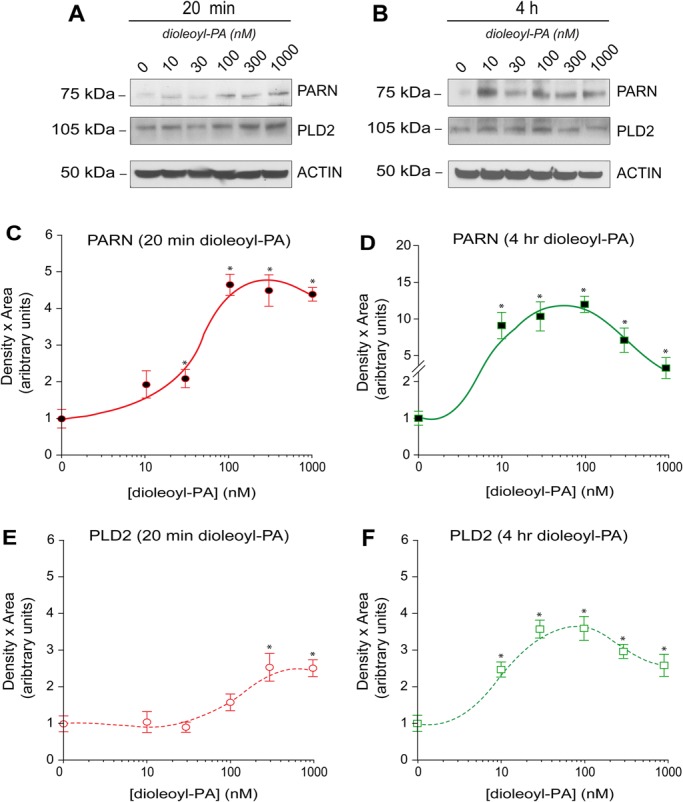
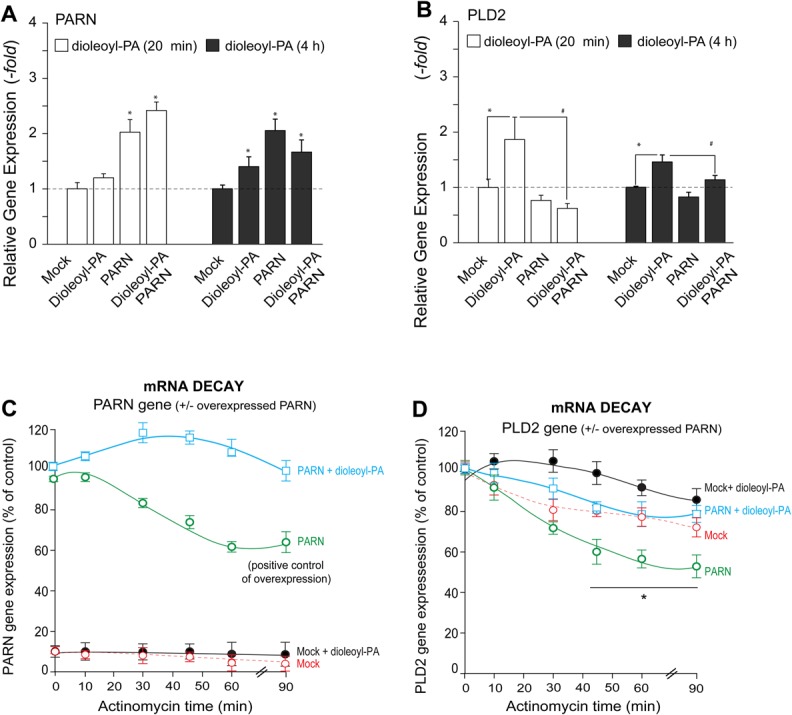
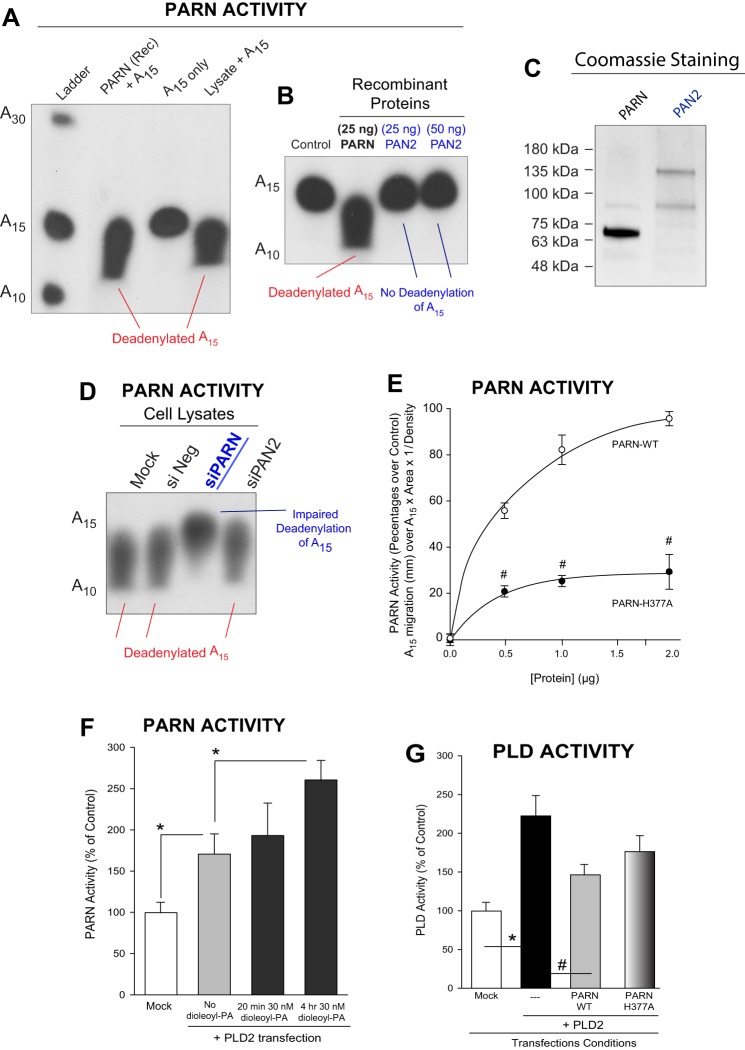
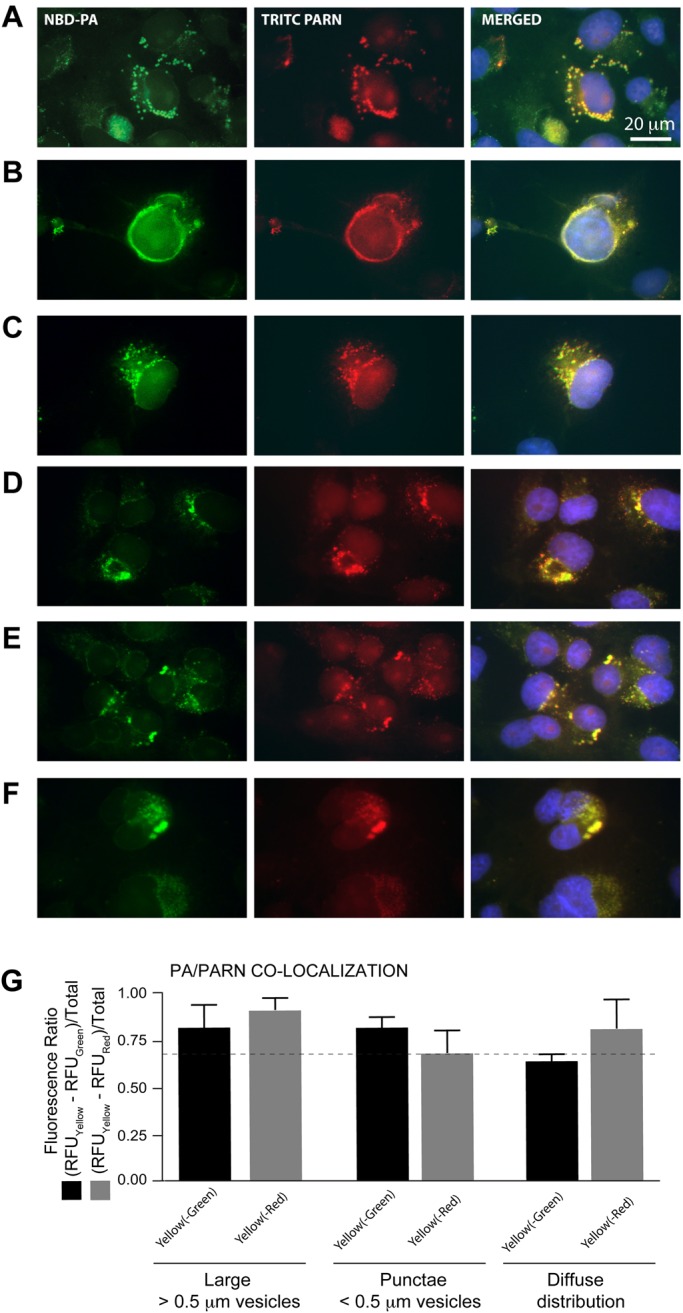
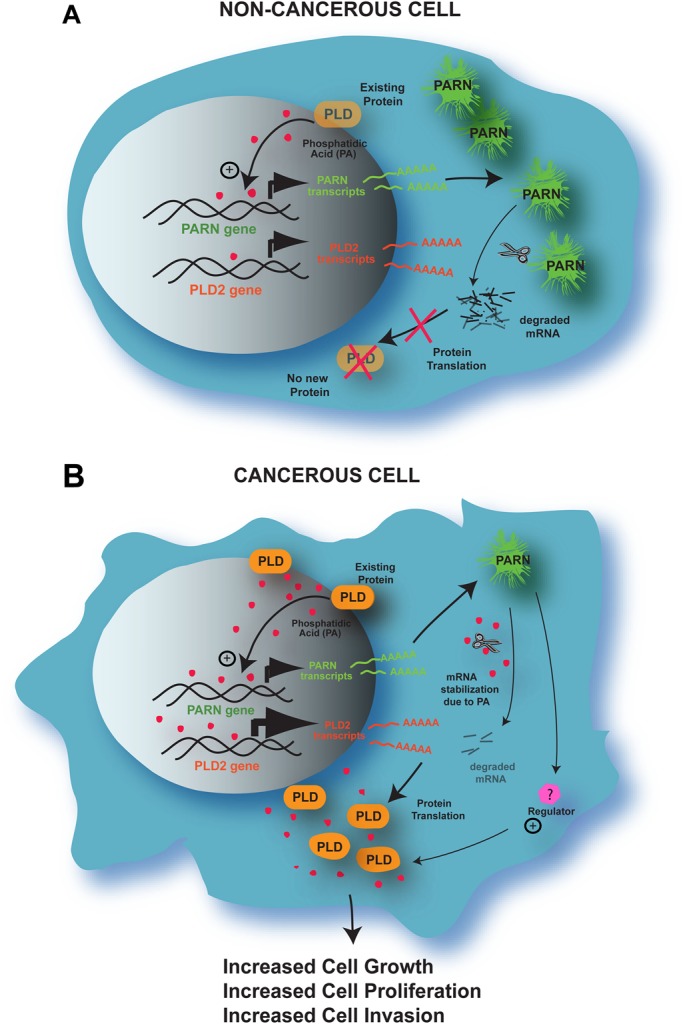
The removal of mRNA transcript poly(A) tails by 3'→5' exonucleases is the rate-limiting step in mRNA decay in eukaryotes. Known cellular deadenylases are the CCR4-NOT and PAN complexes, and poly(A)-specific ribonuclease (PARN). The physiological roles and regulation for PARN is beginning to be elucidated. Since phospholipase D (PLD2 isoform) gene expression is upregulated in breast cancer cells and PARN is downregulated, we examined whether a signaling connection existed between these two enzymes. Silencing PARN with siRNA led to an increase in PLD2 protein, whereas overexpression of PARN had the opposite effect. Overexpression of PLD2, however, led to an increase in PARN expression. Thus, PARN downregulates PLD2 whereas PLD2 upregulates PARN. Co-expression of both PARN and PLD2 mimicked this pattern in non-cancerous cells (COS-7 fibroblasts) but, surprisingly, not in breast cancer MCF-7 cells, where PARN switches from inhibition to activation of PLD2 gene and protein expression. Between 30 and 300 nM phosphatidic acid (PA), the product of PLD enzymatic reaction, added exogenously to culture cells had a stabilizing role of both PARN and PLD2 mRNA decay. Lastly, by immunofluorescence microscopy, we observed an intracellular co-localization of PA-loaded vesicles (0.1-1 nm) and PARN. In summary, we report for the first time the involvement of a phospholipase (PLD2) and PA in mediating PARN-induced eukaryotic mRNA decay and the crosstalk between the two enzymes that is deregulated in breast cancer cells.

Keywords: Breast cancer; Cell signaling; Deadenylase; Gene expression; MRNA decay; Mammalian cells; Ribonuclease.


Conflict of interest statement

Competing interests

The authors declare no competing or financial interests.

Figures

Fig. 1.
Fig. 1.
PARN is differentially expressed in breast cancer versus non-cancerous tissue/cells. (A,B) Analysis of PARN (A) and PLD2 (B) expression in human breast cancer versus normal adjacent tissue using microarray data from the Finak Breast Dataset (Finak et al., 2008). See Materials and Methods for details. (C,D) Gene expression of PARN (C) or PLD2 (D) in COS-7 and MCF-7 cell lines. Quantitative RT-PCR results in C,D are normalized to the averaged results of the three housekeeping genes used: GAPDH, Actin, and TBP (TATA-binding protein). Data presented as bars are means+s.e.m. Experiments were performed in technical triplicates (for qRT-PCR assays) for n=5 independent experiments. The difference between means was assessed by single-factor ANOVA.) *P<0.05, significant increase between samples and controls; #P<0.05, significant decrease between samples and controls.
Fig. 2.
Fig. 2.
Silencing of PARN increased PLD2 protein expression. Cells were treated with transfection reagents only (Mock) or silenced with siRNA-negative control (Neg.) or with siRNA for PARN as indicated. Four days post-transfection, lysates were used for protein and gene expression analyses. (A-C) Protein expression for COS-7 cells and (F-H) for MCF-7 cells. Western blots are presented in A and F and the densitometry of PARN and PLD2 bands are shown in COS-7 cells (B-C) and MCF-7 cells (G-H). Actin was used as the equal protein loading control. (D,E) Gene expression for COS-7 cells and (I,J) for MCF-7 cells measured by RT-qPCR using the three housekeeping genes as indicated in the Fig. 1 legend. Data presented as bars are means+s.e.m. The difference between means was assessed by single-factor ANOVA. *P<0.05, significant increase between samples and controls; ##P<0.01, significant decrease between samples and controls.
Fig. 3.
Fig. 3.
PLD2 and PARN overexpression affects PARN and PLD2 protein and gene expression. (A) PARN overexpression of catalytically active or deadenylase-inactive (PARN-H377A) plasmids and their effect on PLD2 gene expression in COS-7 cells. (B) PLD2 overexpression of catalytically active or lipase-inactive (PLD2-K758R) plasmids and their effect of PARN gene expression in COS-7 cells. (C-H) Co-expression of PARN and PLD2 in two different cell lines: COS-7 (C,E,G) and MCF-7 (D,F,H). (C,D) Protein expression by western blot (actin was used as a gel loading control). Cells were left untransfected (mock) or transfected with PLD2 or PARN plasmids individually or in combination (PLD2+PARN). (E,F) PLD2 gene expression and (G,H) PARN gene expression, in either case detected by RT-qPCR. Data presented as bars are means+s.e.m. The difference between means was assessed by single-factor ANOVA. *P<0.05, **P<0.01, ***P<0.005, significant increase between samples and controls; #P<0.05, significant decrease between samples and controls.
Fig. 4.
Fig. 4.
Exogenous dioleoyl-PA increases PARN protein expression. (A,B) Western blots showing endogenous levels of PARN, PLD2 and actin protein in COS-7 cells in response to 20 min (A) or 4 h (B) incubation with increasing concentrations of dioleoyl-PA as indicated. (C-F) Densitometry analyses of data shown in A,B. (C,D) Results of densitometry of PARN bands from western blots similar to the ones shown in A,B for 20 min (C) and 4 h (D). (E,F) Results of densitometry of PLD2 bands from western blots similar to the ones shown in A,B for 20 min (E) and 4 h (F). Data are presented as means+s.e.m. *P<0.05 by single-factor ANOVA.
Fig. 5.
Fig. 5.
Effect of dioleolyl-PA treatment on ectopic expression of PARN and mRNA decay. (A,B) COS-7 cells were transfected with PARN or left untrasnfected (Mock) for 48 h. On the day of the experiment aliquot samples were treated with 300 nM dioleoyl-PA in culture for 20 min (white bars) or for 4 h (black bars). Cells were processed for the measurement of gene expression by RT-qPCR for either PARN (A) or PLD2 (B). Data in A,B presented as bars are means+s.e.m. The difference between means was assessed by single-factor ANOVA. *P<0.05, significant increase between samples and controls; #P<0.05, significant decrease between samples and controls. (C,D) mRNA decay study. COS-7 cells were overexpressed with PARN or left untransfected (Mock) for 48 h and incubated with 50 nM actinomycin D on the day of the experiment, for the indicated lengths of time, in the absence or presence of 300 nM dioleoyl-PA. RNA was extracted and then used for qRT-PCR analyses. Relative gene expression was used to determine the levels of mRNA decay for PARN (C) and PLD2 (D) and are expressed in the graphs in terms of mean percentage of control (normalized as 100)±s.e.m. *P<0.05 by single-factor ANOVA.
Fig. 6.
Fig. 6.
Effect of PLD or dioleoyl-PA on PARN deadenylation activity. (A,B) Validation study for in vitro PARN deadenylase activity. (A) Radiolabeled A15 RNA substrate was deadenylated by recombinant PARN with respect to the A15-only control. Deadenylation is evidenced by a greater mobility of radiolabeled spots and the appearance of smears versus the negative control of A15 alone. (B) Recombinant PARN, but not recombinant PAN2 is able to deadenylate A15. (C) Coomassie-stained gel indicating the high purity of the recombinant, purified proteins used. (D) PARN deadenylase activity as measured in lysates from COS-7 cells that were silenced with 150 ng of either control RNA (SiNeg), siPARN RNA or siPAN2 RNA. (E) PARN activity in overexpressing cells was concentration dependent from cell lysates in comparison with the deadelynase-inactive mutant PARN-H377A. (F) PARN activity of lysates prepared from COS-7 cells overexpressing PLD2 incubated with or without dioleolyl-PA. (G) PLD activity of COS-7 cells overexpressing PLD2 alone (control) or co-overexpressed with PARN-WT or the PARN mutant. Data are presented as means+s.e.m. The difference between means was assessed by single-factor ANOVA. *P<0.05, significant increase between samples and controls; #P<0.05, significant decrease between samples and controls.
Fig. 7.
Fig. 7.
Co-localization of PARN with NBD-PA. COS-7 s were incubated for 30 min in 30 nM fluorescent PA (NBD-PA) and were then used for immunofluorescence microscopy using TRITC-conjugated α-PARN IgG antibodies. (A-F) Sextuplicate fields. Localization of the NBD-PA is in green (excitation=490 nm; emission=525 nm, using a FITC filter) and localization of PARN is in red (excitation=557 nm; emission=576 nm, using a TRITC filter). Nuclei were stained blue with DAPI and the images merged. (G) PA/PARN co-localization, represented by the presence of yellow (550 nm) immunofluorescence, as indicated in Methods, in large vesicles (>0.5 mm); punctae (<0.5 mm) or diffuse distribution. This classification of vesicles is in accordance with a previous publication from our lab (Henkels et al., 2016). The dashed line marks the threshold for ratios of least 70% of maximum values. Each bar is the average of the six images shown plus other three fields not shown, for a total of n=18. Data are presented as means+s.e.m.
Fig. 8.
Fig. 8.
Proposed model for the interactions of PARN with PLD2 in non-cancerous versus cancerous cells. (A) In non-cancerous cells, where PARN expression surpasses PLD2 expression, a positive and a negative feedback mechanism exists, whereby PLD2 and PA production initially upregulates PARN gene and protein expression. This PARN protein then decreases PLD2 expression by degrading PLD2 mRNA bringing PLD2 levels back to a normal level. (B) Working model for the deregulation between PARN and PLD2 in cancerous cells, where PLD2 expression surpasses PARN expression. As in non-cancerous cells, PLD upregulates PARN. However, PARN can not downregulate PLD. Either degradation of mRNA is compromised by an stabilizing effect of PA or a positive regulator exists between PARN and PLD protein translation (yet to be established), leads to higher PLD2 protein expression, which mediates the indicated functionality of these cells.

Similar articles

Cited by

References

    1. Astrom A., Astrom J. and Virtanen A. (1991). A simple procedure for isolation of eukaryotic mRNA polyadenylation factors. Eur. J. Biochem. 202, 765-773. 10.1111/j.1432-1033.1991.tb16431.x - DOI - PubMed
    1. Basquin J., Roudko V. V., Rode M., Basquin C., Séraphin B. and Conti E. (2012). Architecture of the nuclease module of the yeast Ccr4-not complex: the Not1-Caf1-Ccr4 interaction. Mol. Cell 48, 207-218. 10.1016/j.molcel.2012.08.014 - DOI - PubMed
    1. Boele J., Persson H., Shin J. W., Ishizu Y., Newie I. S., Sokilde R., Hawkins S. M., Coarfa C., Ikeda K., Takayama K.-i. et al. (2014). PAPD5-mediated 3′ adenylation and subsequent degradation of miR-21 is disrupted in proliferative disease. Proc. Natl. Acad. Sci. USA 111, 11467-11472. 10.1073/pnas.1317751111 - DOI - PMC - PubMed
    1. Buiting K., Körner C., Ulrich B., Wahle E. and Horsthemke B. (1999). The human gene for the poly(A)-specific ribonuclease (PARN) maps to 16p13 and has a truncated copy in the Prader-Willi/Angelman syndrome region on 15q11-->q13. Cytogenet. Cell Genet. 87, 125-131. 10.1159/000015378 - DOI - PubMed
    1. Burch R. M., Luini A. and Axelrod J. (1986). Phospholipase A2 and phospholipase C are activated by distinct GTP-binding proteins in response to alpha 1-adrenergic stimulation in FRTL5 thyroid cells. Proc. Natl. Acad. Sci. USA 83, 7201-7205. 10.1073/pnas.83.19.7201 - DOI - PMC - PubMed

LinkOut - more resources