. 2017 Feb 3;292(5):1951-1969.
doi: 10.1074/jbc.M116.751404. Epub 2016 Dec 23.

In Vitro and in Vivo Analyses Reveal Profound Effects of Fibroblast Growth Factor 16 as a Metabolic Regulator

Affiliations

In Vitro and in Vivo Analyses Reveal Profound Effects of Fibroblast Growth Factor 16 as a Metabolic Regulator

Ingrid C Rulifson et al. J Biol Chem. .

Abstract

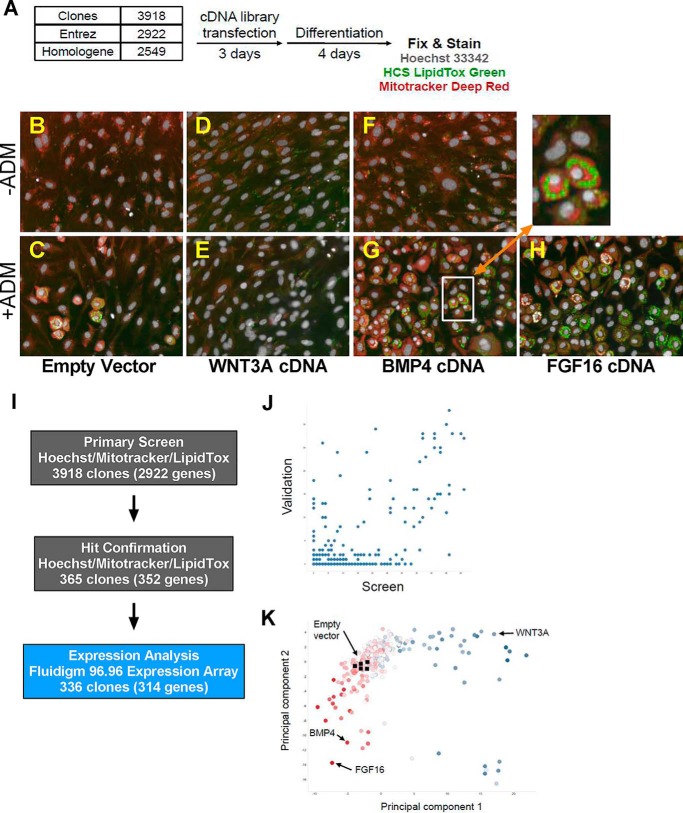
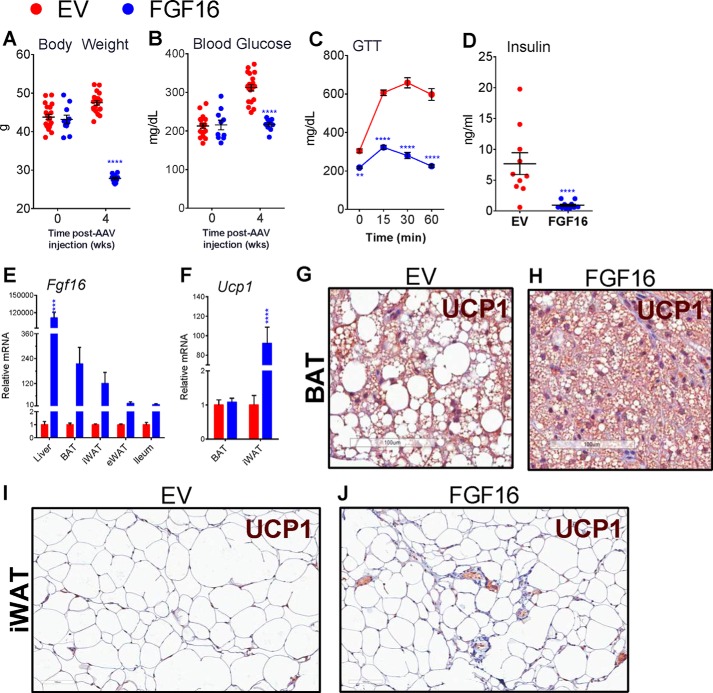
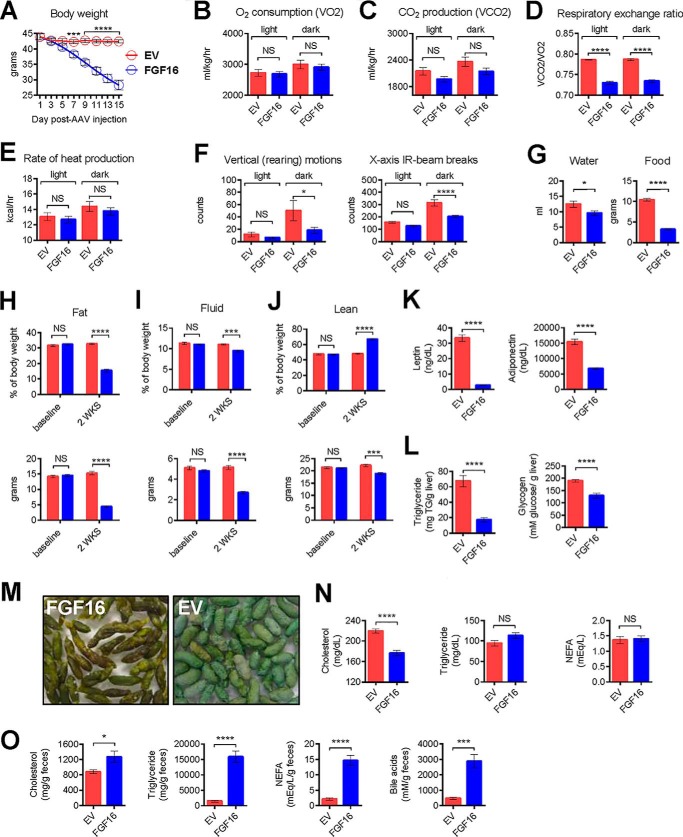
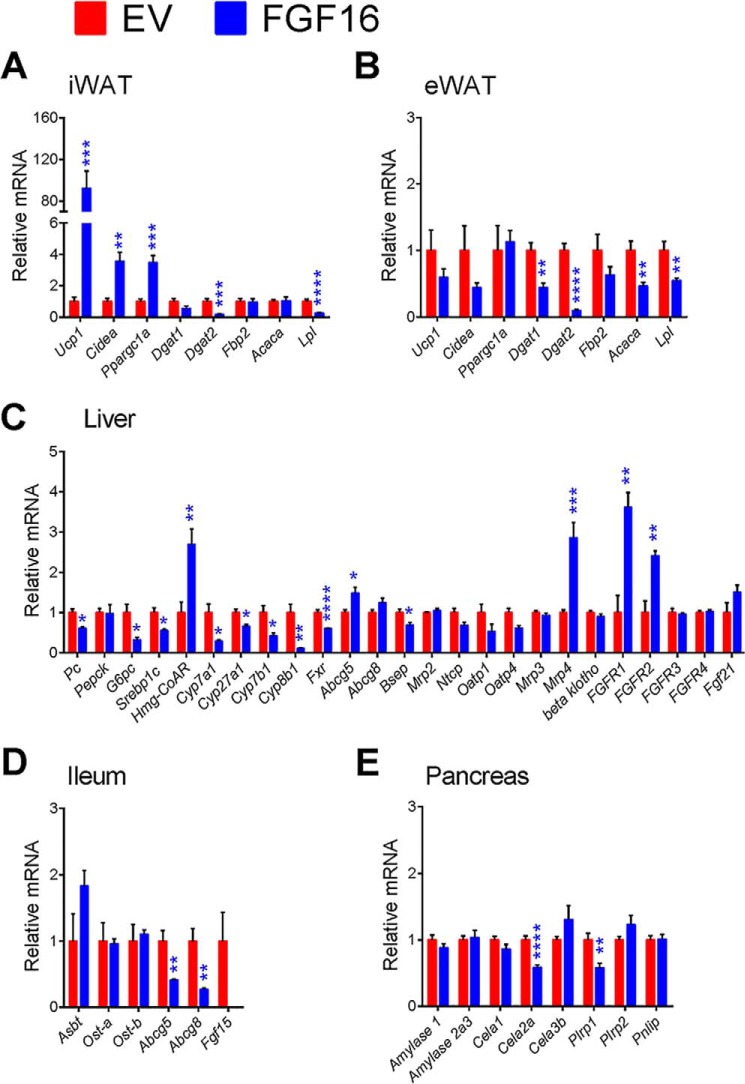
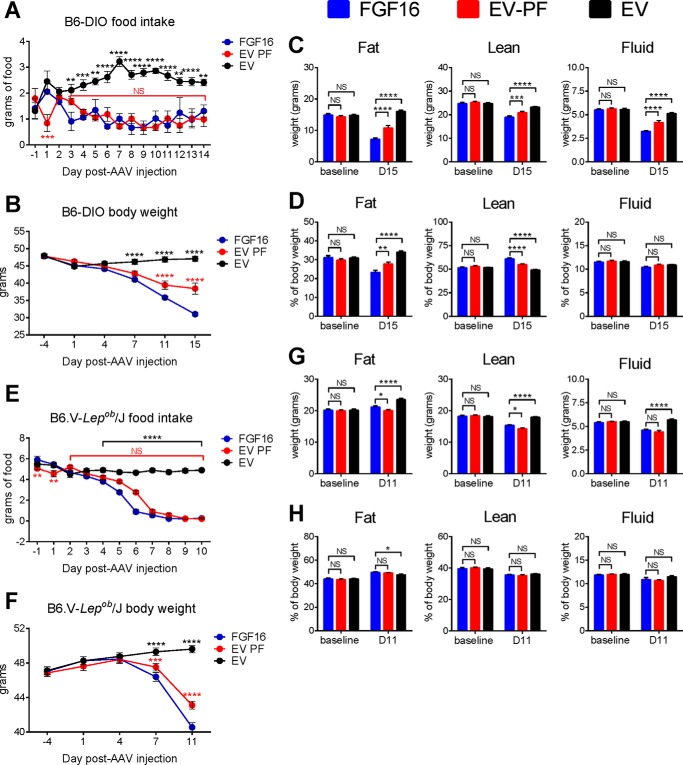
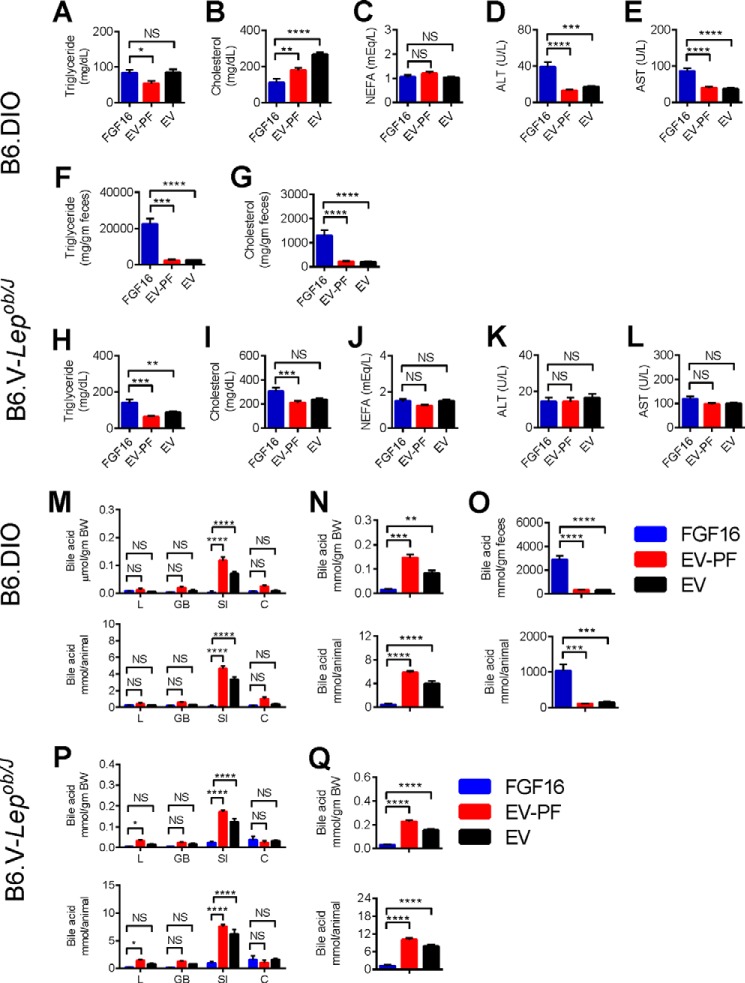
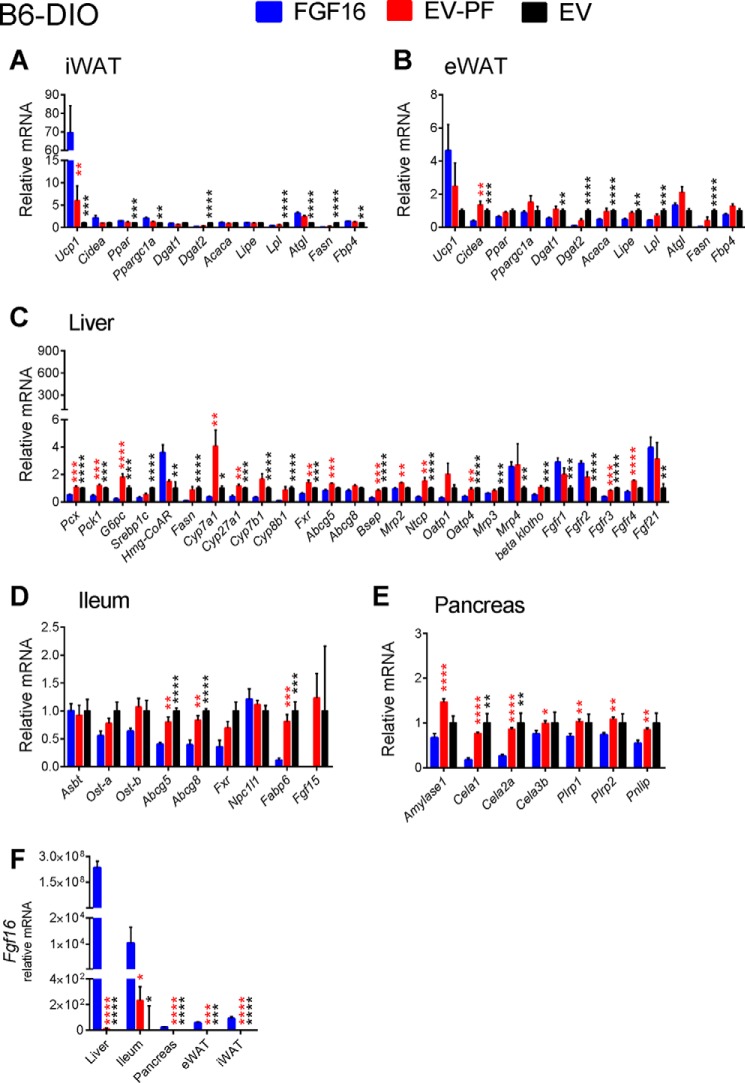
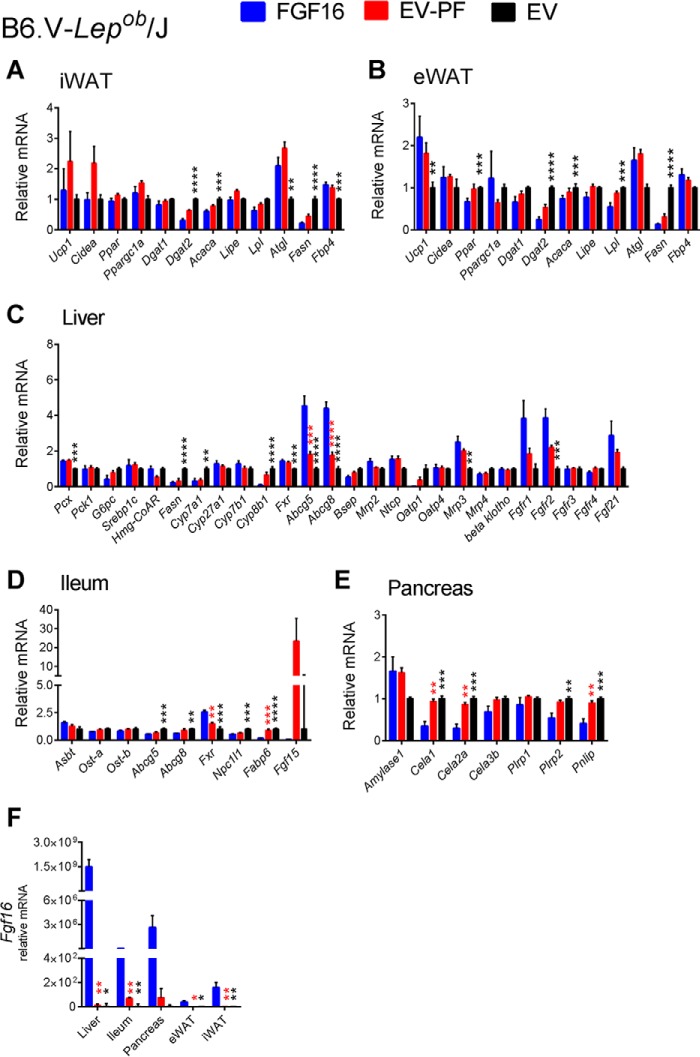
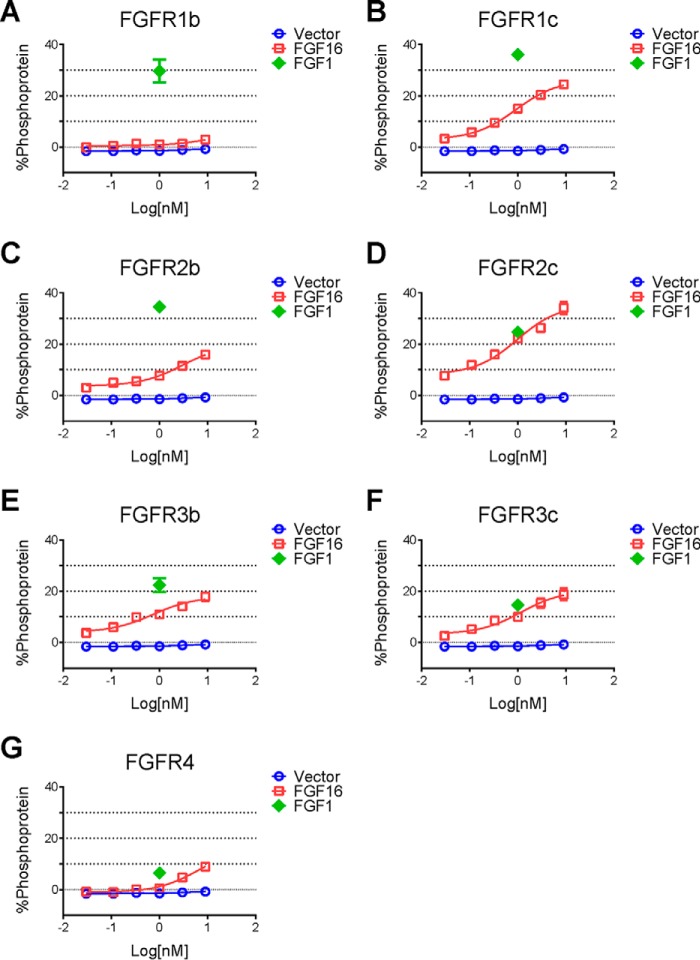
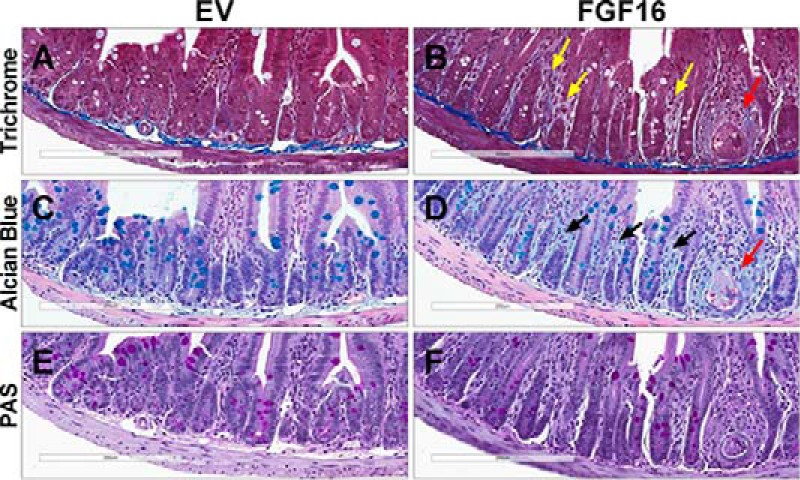
The discovery of brown adipose tissue (BAT) as a key regulator of energy expenditure has sparked interest in identifying novel soluble factors capable of activating inducible BAT (iBAT) to combat obesity. Using a high content cell-based screen, we identified fibroblast growth factor 16 (FGF16) as a potent inducer of several physical and transcriptional characteristics analogous to those of both "classical" BAT and iBAT. Overexpression of Fgf16 in vivo recapitulated several of our in vitro findings, specifically the significant induction of the Ucp1 gene and UCP1 protein expression in inguinal white adipose tissue (iWAT), a common site for emergent active iBAT. Despite significant UCP1 up-regulation in iWAT and dramatic weight loss, the metabolic improvements observed due to Fgf16 overexpression in vivo were not the result of increased energy expenditure, as measured by indirect calorimetric assessment. Instead, a pattern of reduced food and water intake, combined with feces replete with lipid and bile acid, indicated a phenotype more akin to that of starvation and intestinal malabsorption. Gene expression analysis of the liver and ileum indicated alterations in several steps of bile acid metabolism, including hepatic synthesis and reabsorption. Histological analysis of intestinal tissue revealed profound abnormalities in support of this conclusion. The in vivo data, together with FGF receptor binding analysis, indicate that the in vivo outcome observed is the likely result of both direct and indirect mechanisms and probably involves multiple receptors. These results highlight the complexity of FGF signaling in the regulation of various metabolic processes.

Keywords: adipogenesis; bile acid; fibroblast growth factor (FGF); fibroblast growth factor receptor (FGFR); intestinal metabolism; metabolism.


Conflict of interest statement

All authors are or were Amgen employees and thus have an actual or perceived conflict of interest with the contents of this article.

Figures

FIGURE 1.
FIGURE 1.
A high content cell-based screen reveals FGF16 as an adipogenesis activator. A, a schematic describing the cell assay protocol. Cells were transfected with cDNA in 384-well format and treated with ADM after 72 h. After a second medium exchange and a total of 96 h of differentiation, cells were fixed and stained with Hoechst (nucleus), LipidTox Green (neutral lipid), and MitoTracker Deep Red (mitochondria) before imaging at ×20 on a PerkinElmer Opera QEHS. B–G, representative images of cells transfected with plasmid containing an empty vector neutral control, WNT3A, BMP4, or FGF16. B, D, and F, ADM negative media. C, E, G, and H, ADM positive media. I, outliers from the primary screen were technically validated by retesting and expression analysis by Fluidigm 96.96 dynamic arrays. J, linear correlation between screen (x axis) and validation (y axis) hits. K, the scatter plot depicts a principal component feature reduction of image and expression data for the clones and controls. Highlighted clones include fibroblastic mitogens (blue, such as WNT3A), neutral controls (clear, including empty vector controls), and pro-adipogenic factors (red, including BMP4).
FIGURE 2.
FIGURE 2.
Overexpression of Fgf16 in vivo reduces body weight, improves glucose metabolism, and induces Ucp1 expression. C57BL/6 DIO mice were injected with AAV containing either Fgf16 (blue circles) or EV (red circles). Body weight (A) and fasting blood glucose levels (B) were measured at time 0 and 2 and 4 weeks post-AAV injection. n = 10 animals/group; data are presented for each animal with the average and S.D. for each group indicated. Statistical significance was determined by two-way ANOVA. ****, p < 0.0001. C, a glucose tolerance test was performed 4 weeks post-AAV injection. Average values and S.D. for blood glucose levels at 0, 15, 30, and 60 min post-intraperitoneal injection of glucose. n = 10 animals/group; statistical significance was determined by two-way ANOVA. **, p = 0.002; ****, p < 0.0001. D, fasting serum insulin levels were determined at 4 weeks post-AAV injection. n = 10 animals/group; data are presented for each animal with the average and S.D. for each group indicated. Statistical significance was determined by an unpaired 2-tailed t test with Welch's correction; ****, p < 0.0001. E, qPCR analysis for Fgf16 mRNA expression in liver, BAT, iWAT, eWAT, and ileum from FGF16 mice versus EV mice. n = 6 animals/group; data are presented for each animal with the average and S.D. for each cohort indicated. Statistical significance was determined by two-way ANOVA. ****, p < 0.0001. F, qPCR analysis for Ucp1 mRNA expression in BAT and iWAT from FGF16 mice versus EV mice. n = 6 animals/group; data are presented for each animal with the average and S.D. for each cohort indicated. Statistical significance was determined by two-way ANOVA. ****, p < 0.0001. G and H, immunohistochemical analysis of UCP1 expression in BAT from EV mice versus FGF16 mice, respectively. I and J, immunohistochemical analysis of UCP1 expression in iWAT from EV mice versus FGF16 mice, respectively. Images are representative of 6 animals/cohort.
FIGURE 3.
FIGURE 3.
Fgf16 overexpression in vivo reduces body weight independently of increased energy expenditure. A, daily body weight changes for EV mice (red circles) versus FGF16 mice (blue circles). n = 6 animals/group. The average and S.D. for each group is indicated for each day post-AAV injection. Statistical significance was determined by two-way ANOVA. *, p = 0.03; ***, p = 0.003; ****, p < 0.0001. B–F, indirect calorimetry analysis of EV mice (red bars) versus FGF16 mice (blue bars) for VO2, VCO2, respiratory exchange ratio, rate of heat production, vertical (rearing) motion, and x axis IR beam breaks, respectively, collected between days 6 and 13 post-AAV injection. Data from each animal were collected at 12-min intervals and averaged, and then values from each cohort were averaged for light versus dark cycles. Statistical significance was determined by one-way ANOVA and a Sidak's multiple comparison test.*, p = 0.03; ****, p < 0.0001. NS, not significant. G, cumulative water consumption measured from days 6–13 post-AAV injection. n = 6 animals/group; statistical significance was determined by an unpaired 2-tailed t test with Welch's correction. *, p < 0.03. Daily average food consumption was measured from EV mice (red bars) and FGF16 mice (blue bars) under normal housing conditions between days 6 and 10 post-AAV injection. n = 16 animals/cohort; statistical significance was determined by an unpaired two-tailed Student's t test with Welch's correction. ****, p < 0.0001. H–J, 15 days post-AAV injection, EV mice (red bars) and FGF16 mice (blue bars) were weighed, and body mass composition was determined using NMR analysis. Percent body composition for fat mass, fluid mass, and lean mass (upper panels) and total fat, fluid, and lean mass (grams) (lower panels) are shown. For each cohort, n = 6 mice were housed under the CLAMS cage system, and n = 4 mice were housed in standard cages. Values collected from both AAV cohorts were averaged. Statistical significance was determined by two-way ANOVA. ***, p = 0.0004 (I) and 0.0008 (J); ****, p < 0.0001. K, 14 days post-AAV injection, fasting serum leptin and adiponectin levels were determined. L, upon harvest, the amount of triglyceride per gram of liver and glycogen content per gram of liver were determined for EV mice (red bars) and FGF16 mice (blue bars). M, representative images of feces collected from FGF16 mice and EV mice, with similar magnification used for both images. N, fasting serum cholesterol, triglyceride, and NEFA levels. O, fecal cholesterol, triglyceride, NEFA, and bile acids from EV mice (red bars) and FGF16 mice (blue bars). n = 10 animals/group (K–O). Statistical significance was determined by an unpaired 2-tailed t test with Welch's correction. *, p = 0.02 and ***, p = 0.003 (O); ****, p ≤ 0.0001 (K, L, and O).
FIGURE 4.
FIGURE 4.
Expression profiles of relevant genes involved in Fgf16 signaling, iBAT activation, bile acid metabolism, and lipid absorption. Two weeks post-AAV injection, iWAT (A), eWAT (B), liver (C), ileum (D), and pancreas (E) tissue from EV mice (red bars) and FGF16 mice (blue bars) were collected and analyzed for gene expression changes. Data are presented as the average relative mRNA ± S.E. Statistical significance was determined using an unpaired Student's t test, correcting for multiple comparisons using the Holm-Sidak method with α = 5.000%. *, p < 0.05; **, p ≤ 0.01; ***, p ≤ 0.001; ****, p ≤ 0.0001.
FIGURE 5.
FIGURE 5.
Pair-feeding studies reveal Fgf16 overexpression-mediated weight loss is distinct from reduced food intake and is leptin-independent. A–D, single-housed B6-DIO mice were injected with either AAV-Fgf16 or AAV-EV and subjected to pair feeding (PF), where the daily food amount given to the EV group (EV-PF, red circles) was adjusted to the food intake amount of ad libitum fed FGF16 mice (blue circles) from the previous day. A control cohort of EV mice fed ad libitum was included (black circles). A and B, mice were monitored every day for food intake and body weight, respectively. C and D, 15 days post-AAV injection, FGF16 mice (blue bars), EV-PF mice (red bars), and EV mice (black bars) were weighed, and body mass composition was determined using NMR analysis. C, total fat, fluid, and lean mass (grams) are shown, respectively. D, percent body composition for fat mass, fluid mass, and lean mass are shown, respectively. E–H, in parallel to the B6-DIO mice, a PF study was conducted on B6.V-Lepob/J mice. The mice were harvested after only 11 days post-AAV injection because of significant fecal impaction observed in 11 of the 12 FGF16 mice. For each cohort, n = 12 mice. The values collected from cohorts were averaged. A–H, statistical significance was determined by two-way ANOVA.*, p < 0.01; **, p ≤ 0.01; ***, p ≤ 0.001; ****, p ≤ 0.0001. NS, not significant.
FIGURE 6.
FIGURE 6.
Fgf16 overexpression results in significant lipid and bile acid excretion. Upon harvesting, serum from the PF B6-DIO and PF B6.V-Lepob/J cohorts was evaluated for lipid and liver enzyme levels. A–E, triglyceride, cholesterol, NEFA, ALT, and AST levels from the B6-DIO cohorts. F and G, feces collected from the B6-DIO cohorts were evaluated for triglyceride and cholesterol content. H–L, triglyceride, cholesterol, NEFA, ALT, and AST levels from the B6.V-Lepob/J cohorts. A–L, n = 10–12 animals/group. Statistical significance was determined by unpaired 2-tailed t test with Welch's correction. *, p < 0.01; **, p ≤ 0.01; ***, p ≤ 0.001; ****, p ≤ 0.0001. M–Q, upon harvesting, tissues and feces from the PF B6-DIO and PF B6.V-Lepob/J cohorts were processed and evaluated for total bile acid content. M, the total bile acid content from liver (L), gall bladder (GB), small intestine (SI), and colon (C) from the PF B6-DIO cohorts was determined individually and presented as the average amount of each tissue per body weight (top panel) or per animal (bottom panel). N, for each cohort the average amount of bile acid pool (liver, gall bladder, and small intestine combined) was calculated per body weight (top panel) and per animal (bottom panel). O, evaluation of total bile acid content from feces collected from the PF B6-DIO cohorts shows significant bile acid excretion in FGF16 mice compared with EV-PF and EV mice; data indicate total bile acid content per gram of feces (top row) and per animal (bottom row). n = 6 animals/group for tissues and n = 10/group for feces. P, the total bile acid content for each tissue type per gram of body weight (top panel) and per animal (bottom panel) from the PF B6.V-Lepob/J cohorts. Q, bile acid pool (liver, gall bladder, and small intestine combined) per body weight (top panel) and per animal (bottom panel) from the PF B6.V-Lepob/J cohorts. M–Q, n = 6 animals/group for tissues. Statistical significance was determined by unpaired 2-tailed t test with Welch's correction; *, p < 0.01; **, p ≤ 0.01; ***, p ≤ 0.001; ****, p ≤ 0.0001. NS, not significant.
FIGURE 7.
FIGURE 7.
Expression profiles of relevant genes involved in Fgf16 signaling, iBAT activation, and lipid and bile acid metabolism from PF B6-DIO cohorts. Two weeks post-AAV injection, iWAT (A), eWAT (B), liver, (C), ileum (D), and pancreas (E) tissues from FGF16 mice (blue bars), EV-PF mice (red bars), and EV mice (black bars) were collected and analyzed for gene expression changes. All tissues from each cohort were also analyzed for Fgf16 expression (F). Data are presented as the average relative mRNA ± S.E. Statistical significance was determined using an unpaired Student's t test, correcting for multiple comparisons using the Holm-Sidak method, with α = 5.000%. *, p < 0.01; **, p ≤ 0.01; ***, p ≤ 0.001; ****, p ≤ 0.0001.
FIGURE 8.
FIGURE 8.
Expression profiles of relevant genes involved in Fgf16 signaling, iBAT activation, and lipid and bile acid metabolism from PF B6.V-Lepob/J cohorts. Eleven days post-AAV injection, iWAT (A), eWAT (B), liver, (C), ileum (D), and pancreas (E) tissues from FGF16 mice (blue bars), EV-PF mice (red bars), and EV mice (black bars) were collected and analyzed for gene expression changes. All tissues from each cohort were also analyzed for Fgf16 expression (F). Data are presented as the average relative mRNA ± S.E. Statistical significance was determined using an unpaired Student's t test, correcting for multiple comparisons using the Holm-Sidak method, with α = 5.000%. *, p < 0.01; **, p ≤ 0.01; ***, p ≤ 0.001; ****, p ≤ 0.0001.
FIGURE 9.
FIGURE 9.
Receptor specificity for FGF16. A–G, L6 cells were transfected with expression vectors for FGFR1b, FGFR1c, FGFR2b, FGFR2c, FGFR3b, FGFR3c, and FGFR4, respectively. Transfected cells were then treated with increasing doses of recombinant FGF16 protein (0.30, 0.11, 0.33, 1.0, 3.0, and 9.0 nm, open squares) or FGF1 protein as a positive control (1 nm, open diamonds). Cell lysates were prepared for an MSD assay to measure pERK/total ERK, and data are presented as % phosphoprotein. Cells transfected with vector only were used as a negative control (open circles).
FIGURE 10.
FIGURE 10.
Fgf16 overexpression results in intestinal abnormalities. A–F, histopathological analysis of ileum collected from EV mice (A, C, and E) and FGF16 mice (B, D, and F). A and B, Masson's trichrome staining identifies irregular collagen deposits within the lamina propria of FGF16 mice (yellow arrowheads). C and D, Alcian blue identifies increased deposition of acidic mucins within the lamina propria of FGF16 mice (black arrowheads). B and D, ileum from FGF16 mice also exhibit instances of crypt degeneration/abscesses (red arrowheads). E and F, no overt difference in periodic acid-Schiff staining was observed in ileum tissue from EV mice versus FGF16 mice. Images are representative of n = 8 animals/cohort.

Similar articles

Cited by

References

    1. Lowell B. B., and Spiegelman B. M. (2000) Towards a molecular understanding of adaptive thermogenesis. Nature 404, 652–660 - PubMed
    1. Cypess A. M., and Kahn C. R. (2010) The role and importance of brown adipose tissue in energy homeostasis. Curr. Opin. Pediatr. 22, 478–484 - PMC - PubMed
    1. Lowell B. B., S-Susulic V., Hamann A., Lawitts J. A., Himms-Hagen J., Boyer B. B., Kozak L. P., and Flier J. S. (1993) Development of obesity in transgenic mice after genetic ablation of brown adipose tissue. Nature 366, 740–742 - PubMed
    1. Kopecky J., Clarke G., Enerbäck S., Spiegelman B., and Kozak L. P. (1995) Expression of the mitochondrial uncoupling protein gene from the aP2 gene promoter prevents genetic obesity. J. Clin. Invest. 96, 2914–2923 - PMC - PubMed
    1. Feldmann H. M., Golozoubova V., Cannon B., and Nedergaard J. (2009) UCP1 ablation induces obesity and abolishes diet-induced thermogenesis in mice exempt from thermal stress by living at thermoneutrality. Cell Metab. 9, 203–209 - PubMed