. 2017 Jan;29(1):169-191.
doi: 10.1105/tpc.16.00847. Epub 2016 Dec 23.

Protein Phosphatase 2Cs and Microtubule-Associated Stress Protein 1 Control Microtubule Stability, Plant Growth, and Drought Response

Affiliations

Protein Phosphatase 2Cs and Microtubule-Associated Stress Protein 1 Control Microtubule Stability, Plant Growth, and Drought Response

Govinal Badiger Bhaskara et al. Plant Cell. 2017 Jan.

Abstract

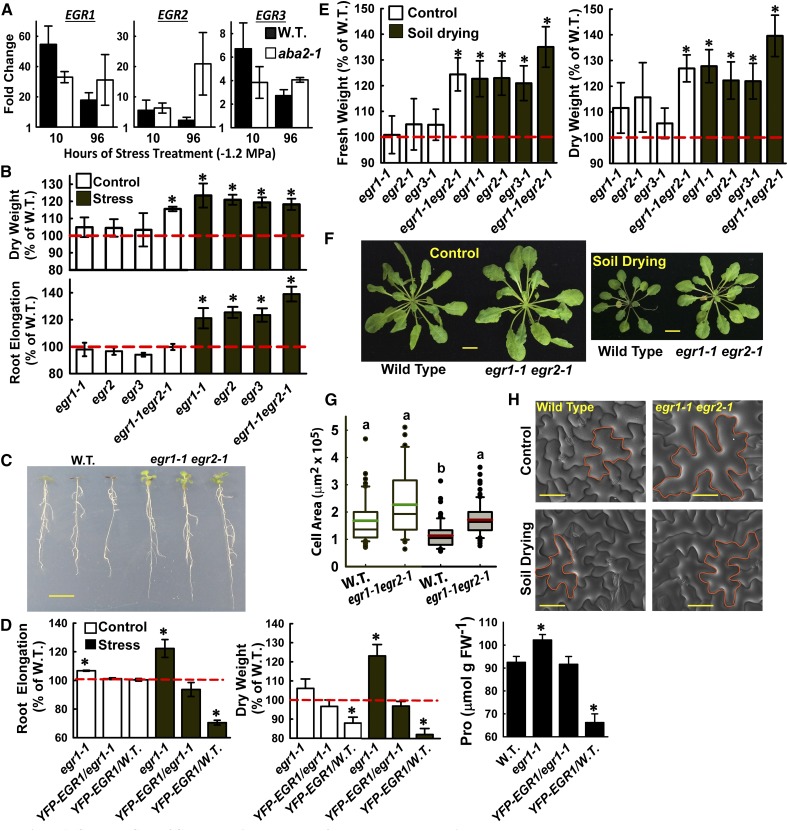
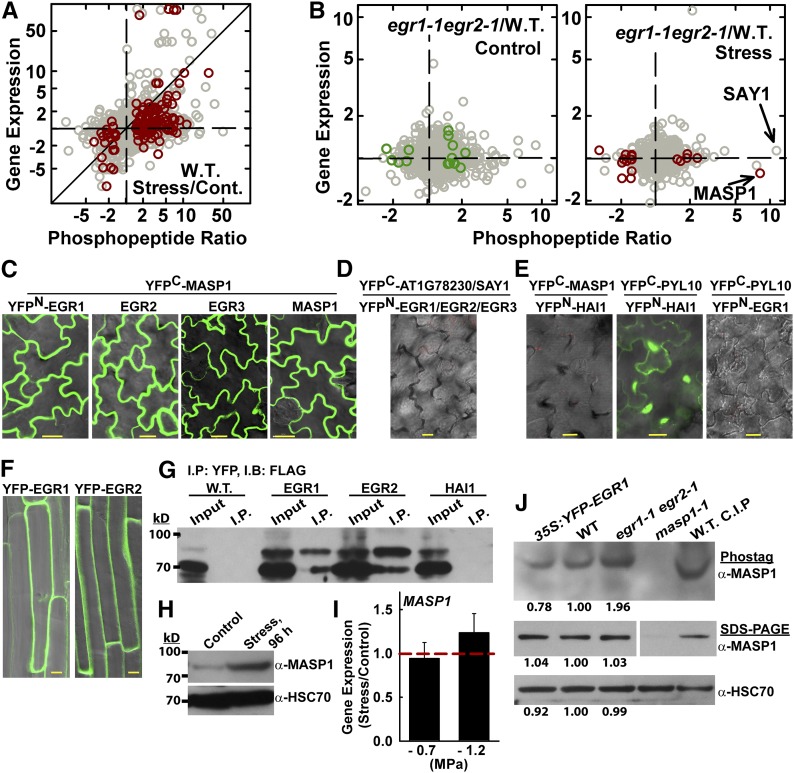
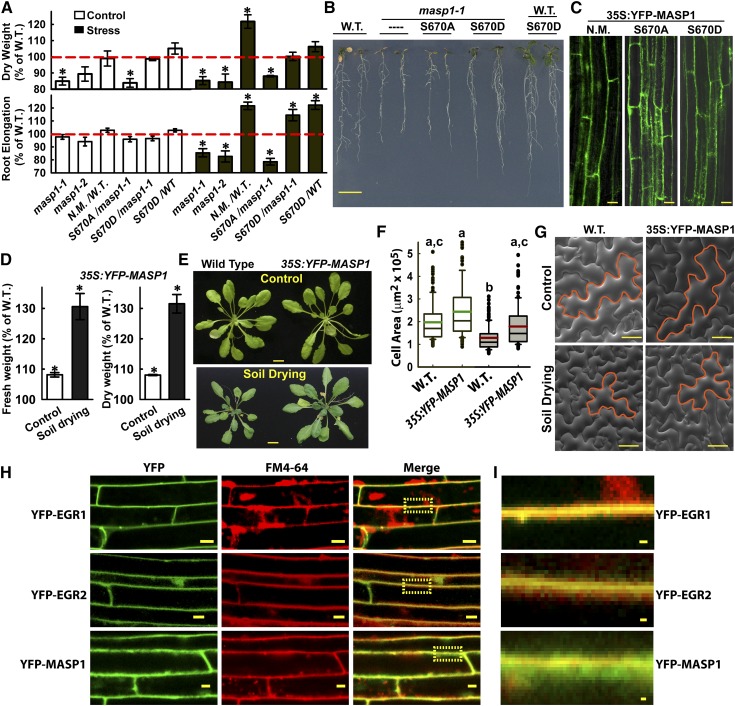
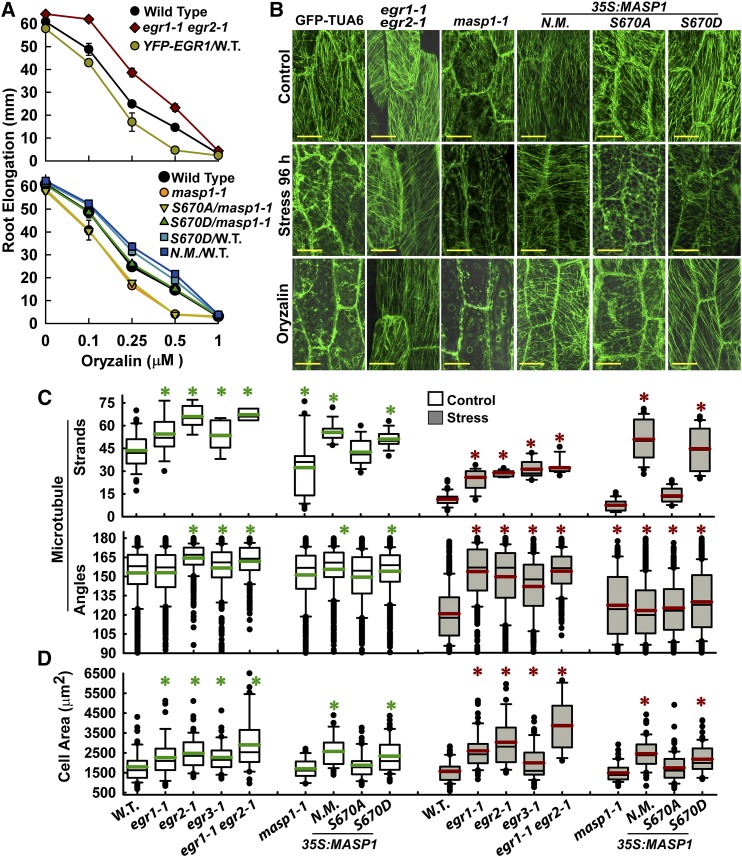
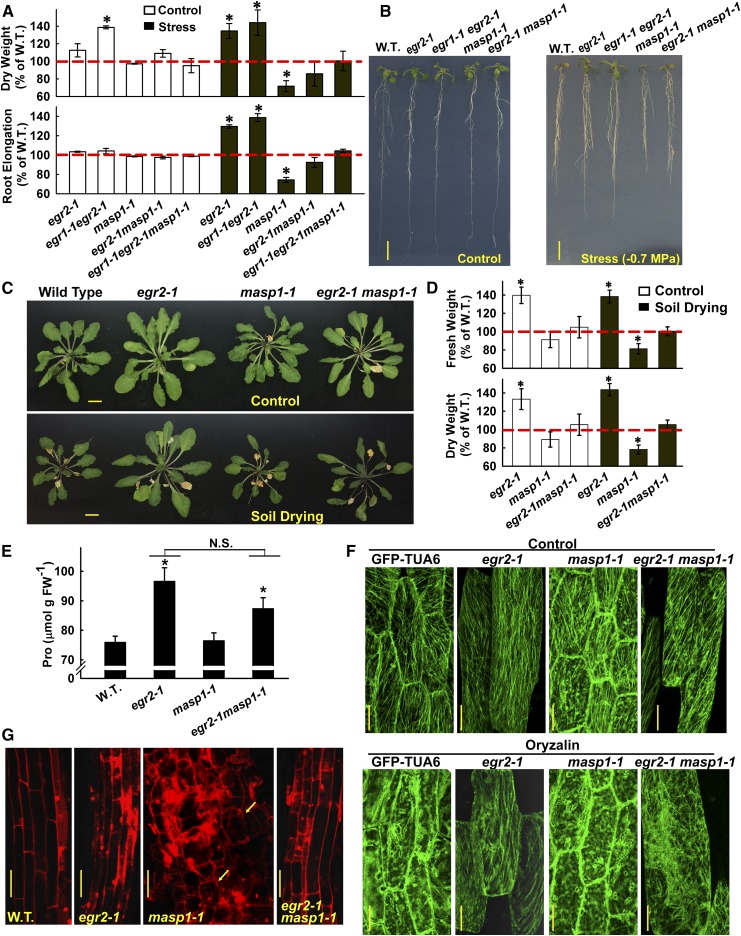
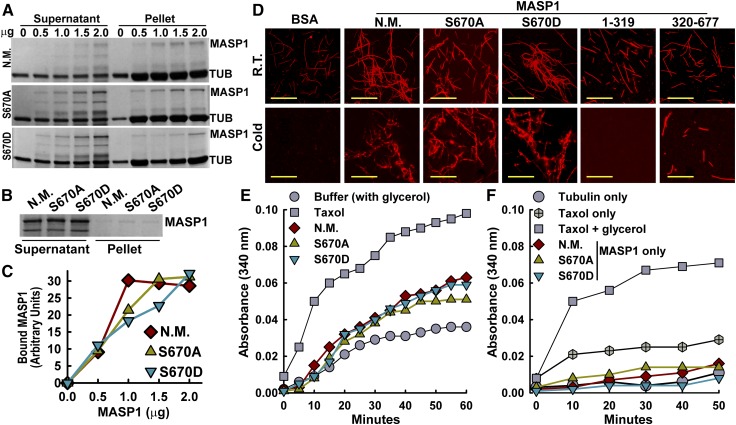
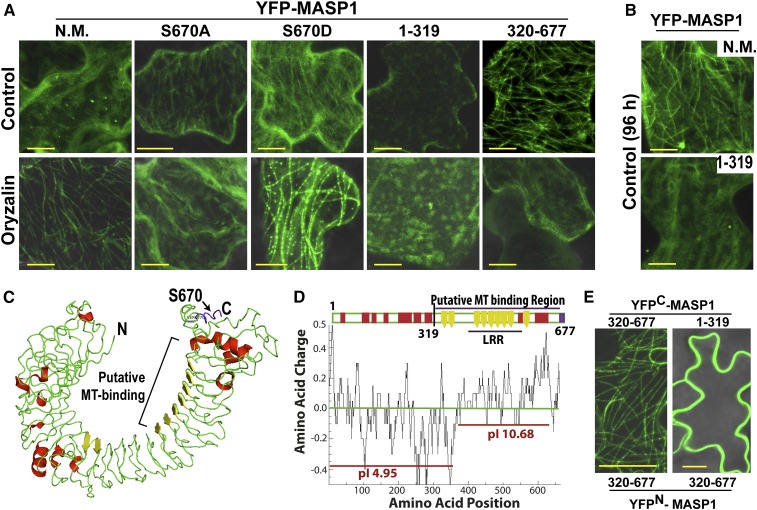
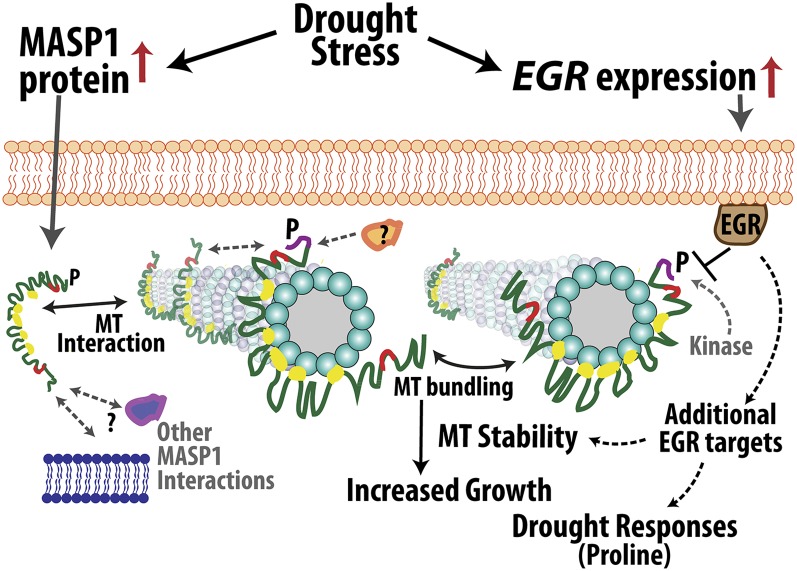
Plant growth is coordinated with environmental factors, including water availability during times of drought. Microtubules influence cell expansion; however, the mechanisms by which environmental signals impinge upon microtubule organization and whether microtubule-related factors limit growth during drought remains unclear. We found that three Clade E Growth-Regulating (EGR) Type 2C protein phosphatases act as negative growth regulators to restrain growth during drought. Quantitative phosphoproteomics indicated that EGRs target cytoskeleton and plasma membrane-associated proteins. Of these, Microtubule-Associated Stress Protein 1 (MASP1), an uncharacterized protein, increased in abundance during stress treatment and could bind, bundle, and stabilize microtubules in vitro. MASP1 overexpression enhanced growth, in vivo microtubule stability, and recovery of microtubule organization during drought acclimation. These MASP1 functions in vivo were dependent on phosphorylation of a single serine. For all EGR and MASP1 mutants and transgenic lines examined, enhanced microtubule recovery and stability were associated with increased growth during drought stress. The EGR-MASP1 system selectively regulates microtubule recovery and stability to adjust plant growth and cell expansion in response to changing environmental conditions. Modification of EGR-MASP1 signaling may be useful to circumvent negative growth regulation limiting plant productivity. EGRs are likely to regulate additional proteins involved in microtubule stability and stress signaling.


Figures

Figure 1.
Figure 1.
Clade E EGR PP2Cs Are Negative Regulators of Growth and Cell Expansion. (A) EGR expression at low ψw (−1.2 MPa) relative to the unstressed control for Col-0 (W.T.) and ABA-deficient mutant aba2-1. Data are means ± se, n = 6 from two independent experiments. (B) Seedling dry weight (D.W.) and root elongation of the EGR mutant and overexpression lines in unstressed control conditions or 10 d after transfer to low ψw (−1.2 MPa). Data are relative to the wild type (mean ± se, n = 6 to 8 for seedling dry weight and n = 18 to 24 for root elongation, asterisk indicates significant difference compared with the wild type by one-sided t test [P ≤ 0.05]). Dashed red line indicates the wild-type level of growth (100%). Three or four seedlings were combined for each dry weigh measurement. egr2 and egr3 are combined data of two T-DNA alleles for each gene (Supplemental Figures 1A and 1D). Growth values of Col-0 wild type used for normalization are shown in Supplemental Figure 2. (C) Representative seedlings of Col-0 wild type and egr1-1 egr2-1 after low ψw (−1.2 MPa) treatment. Five-day-old seedlings were transferred to low ψw and photographs taken 10 d later. Bar = 1 cm. (D) Pro35S:YFP-EGR1 complements the increased growth and proline accumulation of egr1-1 and suppresses growth and proline in the wild type. Proline was measured 96 h after transfer to −1.2 MPa. Data are combined from two transgenic lines for both the egr1-1 and wild-type backgrounds and are means ± se (n = 4 to 12); asterisk indicates P ≤ 0.05 compared with the wild type. Dashed red line indicates the wild type level of growth (100%). (E) Rosette fresh weight (F.W.) and dry weight for egr mutants in well-watered control plants or in plants subjected to partial soil drying. Data are expressed relative to the Col-0 wild type and are means ± se (n = 6 to 9) combined from two to three independent experiments. Two rosettes from plants grown in the same sector of the same pot were used for each fresh and dry weight measurement. Asterisks indicate significant difference compared with the wild type (P ≤ 0.05 by one-sided t test). Dashed red line indicates the wild-type level of growth (100%). (F) Representative rosettes of the wild type and egr1-1 egr2-1 in control and soil drying treatments. Plants were 40 d old and were grown under short-day conditions. The soil drying treatment started at 18 d after planting and continued for 22 d with partial rewatering to control the extent of soil drying (see Methods for further details). Bars = 1 cm. (G) Areas of epidermal pavement cells of leaf 6 from 38-d-old Col wild type and egr1-1 egr2-1 in control and soil drying treatments. Open boxes with green median lines show data for the unstressed control, and gray boxes with red median lines are stress treatment (black lines in each box indicate the mean, while box and whiskers indicate the 25 to 75 and 5 to 95 percentile ranges, respectively, and black circles show outlying data points). Data are means ± se (n = 40 to 80) combined from four to six plants. Lowercase letters above each box indicate significantly different groups (ANOVA on ranks, P ≤ 0.05; Supplemental Data Set 1). (H) Representative scanning electron microscopy images with example epidermal pavement cells outlined in orange to illustrate the increased cell size in egr1-1 egr2-1, while retaining normal morphology. Bars = 50 μm.
Figure 2.
Figure 2.
Phosphoproteomics Analysis of Wild-Type and egr1-1 egr2-1 Plants Reveals Distinct Drought Effects on the Phosphoproteome and Identifies MASP1, an EGR-Interacting Phosphoprotein. (A) Phosphopeptide abundance ratio versus gene expression for wild type (W.T.) stress versus control. Dark-red symbols indicate significant changes in phosphopeptide abundance (P ≤ 0.05 by one-sided t test and fold change ≥1.5). All other phosphopeptide data are plotted using gray symbols. Diagonal line indicates identical change in phosphopeptide abundance and gene expression. Data are fold change in phosphopeptide abundance (as indicated in the tick labels) plotted on a logarithmic scale. For the tick labels, ratios less than one were inverted and shown as negative fold change for clarity of presentation. (B) Phosphopeptide abundance versus gene expression for egr1-1 egr2-1 versus the wild type in control and stress treatments. Format of data presentation is as described for (A). Dark red or green symbols indicate phosphopeptides with P ≤ 0.05 by one-sided t test and fold change ≥1.5 (with addition of MASP1, which has P = 0.07). (C) BiFC interaction of MASP1 with EGRs and with itself in transient expression assays using intact Arabidopsis seedlings. Images of leaf epidermal pavement cells of unstressed seedlings are shown. Essentially identical results were seen in stress-treated (−1.2 MPa) seedlings. Bars = 20 μm. (D) Representative image showing lack of interaction from BiFC analysis of EGRs with AT1G78320, a close homolog of MASP1, which lacks the MASP1 phosphorylation site (Supplemental Figures 3E and 3F and Supplemental Data Set 11) and SAY1 (Fig. 2B). Bars = 20 μm. (E) Representative images showing the lack of BiFC fluorescence signal from the Clade A PP2C Highly ABA-Induced 1 (HAI1; AT5G59220) and MASP1 as well as EGR1 and PYL10 (identical results were seen for EGR2 and EGR3). The HAI1-PYL10 interaction was used as a positive control. Bars = 20 μm. (F) Localization of YFP-EGR1 and YFP-EGR2 in stable transgenic plants. Cells in the root maturation zone of unstressed 11-d-old seedlings are shown. Similar localization was observed at low ψw. Bars = 10 μm. (G) Coimmunoprecipitation of EGR1, EGR2, and MASP1. HAI1 and the uninfiltrated Avr-PTO line (W.T.) were used as a negative controls. YFP-tagged EGR1, EGR2, or HAI1 was transiently expressed along with FLAG-MASP1 and immunoprecipitation (I.P.) was performed with GFP-Trap resin to capture the YFP-tagged phosphatase. Immunoblot (I.B.) of the total protein extract (input) and immunoprecipitated proteins was performed using FLAG antisera. The experiment was repeated with similar results. (H) Immunoblot using MASP1-specific antisera to detect endogenous MASP1 in wild-type seedlings under control or stress (−1.2 MPa, 96 h) conditions shows induction of MASP1 protein level at low ψw (100 μg of total protein was loaded per lane). Replicate blots were probed with HSC70 as a loading control. (I) Quantitative RT-PCR analysis shows no increase of MASP1 expression in seedlings transferred to either −0.7 or −1.2 MPa low ψw stress for 96 h compared with unstressed plants. Data are means ± se (n = 6). Dashed red line indicates the level of expression in unstressed seedlings. (J) Phos-tag gel analysis of MASP1 in stress-treated (−1.2 MPa, 96 h) seedlings. The identity of the phosphorylated MASP1 band was confirmed by analysis of masp1-1 and by treating the wild-type sample with calf intestinal phosphatase (C.I.P.). The same samples were also run on SDS-PAGE gels to assess MASP1 total protein level as well as HSC70 as a loading control (100 μg of protein was loaded per lane for both Phos-tag and regular SDS-PAGE). Band intensities relative to the wild type are shown for egr1-1 egr2-1 and Pro35S:YFP-EGR1 lines. For the MASP1 SDS-PAGE, all lanes are from the same blot, but intervening space was removed and part of the blot rotated to show the lanes in the same order as the other blots.
Figure 3.
Figure 3.
MASP1 Promotes Growth in a Phosphorylation-Dependent Manner and Is Localized in the Cell Cortex. (A) Dry weight and root elongation of seedlings under control and stress (−1.2 MPa) conditions. Genotypes used were masp1-1 and masp1-2 as well as Pro35S:YFP-MASP1 expressed in the wild type (W.T.) or masp1-1. MASP1 alleles used in transgenic plants: N.M., no mutation wild-type MASP1; S670A, phosphonull MASP1; S670D, phosphomimic MASP1. Data are relative to the Col-0 wild type (mean ± se, n = 6 to 8, asterisk indicates significant difference compared with the wild type by one-sided t test [P ≤ 0.05]). Growth values of Col-0 wild type used for normalization are shown in Supplemental Figure 2. Dashed red line indicates the wild type level of growth (100%). (B) Representative seedlings of Col-0 wild type (W.T.), masp1-1, masp1-1 transformed with MASP1S670A (phosphonull) or MASP1S670D (phosphomimic), and wild type transformed with MASP1S670D. Seedlings shown were subjected to −0.7 MPa low ψw treatment where MASP1-mediated effects on growth were similar or greater than the −1.2 MPa experiments shown in (A). Bar = 1 cm. (C) Images of root cells showing that YFP-MASP1 unmutated (N.M.), phosphonull MASP1 (S670A), and phosphomimic MASP1 (S670D) all localized along the cell periphery and were expressed at a similar level. Bars = 20 μm. (D) Relative rosette fresh weight and dry weight of Pro35S:YFP-MASP1 (unmutated, expressed in the Col-0 wild-type background) transgenic plants compared with the Col-0 wild type in control or soil drying treatments (mean ± se, n = 6 to 8, *P ≤ 0.05 by one-sided t test). For the Col-0 wild type, rosette fresh weight and dry weight were nearly 70% lower in the soil drying treatment relative to the well-watered control. The soil drying experiments and presentation of data are the same as described in Figures 1E and 1F. (E) Representative rosettes of the wild type and Pro35S:YFP-MASP1 (unmutated, expressed in the Col-0 wild-type background) in the unstressed control and soil drying treatments. Bars = 1 cm. (F) Areas of epidermal pavement cells of leaf 6 in Col wild type and Pro35S:YFP-MASP1 in control and soil drying treatments. Open boxes with green median lines show data for the unstressed control and gray boxes with red median lines are stress treatment (black lines in each box indicate the mean, while box and whiskers indicate the 25 to 75 and 5 to 95 percentile ranges, respectively, and black circles show outlying data points). Data are means ± se (n = 40 to 80) combined from four to six plants. Lowercase letters above each box indicate significantly different groups (ANOVA on ranks, P ≤ 0.05; Supplemental Data Set 12). (G) Representative scanning electron microscopy images with example epidermal pavement cells outlined in orange to illustrate the increased size, but normal morphology, of Pro35S:YFP-MASP1 cells. Bars = 50 μm. (H) Transgenic plants with stable expression of Pro35S:YFP-EGR1, EGR2, or MASP1 were incubated with FM4-64 to test for colocalization with the plasma membrane. Cells in the root elongation zone are shown. Yellow boxes in the merged images show the area that is enlarged in (I). Bars = 10 μm (I) Enlargement of the yellow boxed areas in (H). Bars = 1 μm.
Figure 4.
Figure 4.
egr Mutants and Plants Expressing MASP1 or Phosphomimic MASP1 Exhibit Enhanced Recovery of MT Organization at Low ψw and Also Have Increased Cell Size. (A) Sensitivity of root elongation to various concentrations of oryzalin in egr1-1 egr2-1 and masp1 mutants as well as unmutated MASP1 (N.M.), MASP1 S670D (phosphomimic), and MASP1S670A (phosphonull) transformed into Col-0 wild type (W.T.) or masp1-1 (transgenic lines are the same as those shown in Figures 1 and 3). Four-day-old seedlings were transferred to plates containing the indicated oryzalin concentrations, and root elongation was measured over the subsequent 7 d. Data are means ± se, n = 6 to 25. All mutants or transgenic lines except for MASP1S670D/masp1-1 were significantly different from the wild type (P ≤ 0.05 by t test) in the 0.25 and 0.5 μM oryzalin treatments. (B) Representative images of MT organization in hypocotyl cells at the base of the elongation zone visualized using GFP fused to Arabidopsis α-Tubulin6 (GFP-TUA6). Eleven-day-old seedlings were used for imaging. Stress = −1.2 MPa, 96 h. Oryzalin = 10 μM for 45 min. Bars = 20 μm. (C) Quantification of microtubule strands per cell and microtubule angle distribution. Data are mean ± se, n = 10 to 50 for microtubule strands, n = 100 to 300 for angles, and asterisk indicates P ≤ 0.05 (by t test) compared with GFP-TUA6. Black lines in the boxes are the mean, and green or red lines are the median. Box and whiskers indicate the 25 to 75 and 5 to 95 percentile ranges, respectively, while black circles are outliers. (D) Cell area of hypocotyl cells analyzed in (C). Data are means ± se, n = 20 to 60, asterisk indicates P ≤ 0.05 (by t test) compared with GFP-TUA6 (W.T.). The graph is formatted the same as in (C).
Figure 5.
Figure 5.
MASP1 Is Epistatic to EGRs in Growth but Not Proline Accumulation. (A) Analysis of dry weight (D.W.) and root elongation for seedlings under control and stress (−0.7 MPa) conditions for egr2-1, egr1-1 egr2-1, masp1-1, and egr2-1 masp1-1. Data are relative to the Col-0 wild type (W.T.; mean ± se, n = 6 to 8, asterisk indicates significant difference compared with the wild type by one-sided t test [P ≤ 0.05]) and are combined from two independent experiments. Typical growth values of Col-0 wild type used for normalization are shown in Supplemental Figure 2. (B) Representative seedlings in the unstressed control (7 d after transfer) and at low ψw (−0.7 MPa, 10 d after transfer). Bars = 1 cm. (C) Representative rosettes of Col-0 wild type, egr2-1, masp1-1, and egr2-1 masp1-1 in the unstressed control and soil drying treatments. The soil drying experiments and presentation of data are the same as described in Figures 1E and 1F. Bars = 1 cm. (D) Relative rosette fresh weight and dry weight of egr2-1, masp1-1, and egr2-1 masp1-1 in control or soil drying treatments. Data are means ± se, n = 4 to 8, and asterisk indicates significant difference compared with the wild type by one-sided t test (P ≤ 0.05) combined from two independent experiments. (E) Proline accumulation after 96 h at −1.2 MPa. Data are means ± se (n = 9 to 15) combined from two independent experiments. Asterisks indicate a significant difference compared with the wild type (P ≤ 0.05). N.S., not significant. (F) Microtubule images for hypocotyl cells of untreated seedlings and seedlings treated with 10 μM oryzalin for 45 min. Bars = 20 μm. (G) PI staining of cells in the root elongation zone for seedlings transferred to low ψw (−0.7 MPa) for 10 d. Arrows show examples where cell swelling can be most clearly seen in masp1-1. Bars = 50 μm.
Figure 6.
Figure 6.
MASP1 MT Interaction and MT Bundling. (A) Cosedimentation MT binding assays using 0 to 2.0 mg of unmutated MASP1 (N.M.), MASP1S670A (phosphonull), or MASP1S670D (phosphomimic). TUB, tubulin. Note that the addition of even a small amount of MASP1 increased the amount of tubulin in the pellet fraction (to preserve MASP1 solubility, the final sedimentation was done at 10°C, which partially destabilized microtubules). Images shown are Coomassie-stained gels and are representative of two to three experiments. (B) Minus MT control for the MASP1 MT binding experiments is shown in (A). Negligible MASP1 precipitation was seen in the absence of MTs. Gel shown is typical of several repeated experiments. (C) Quantification of MASP1 sedimentation with microtubules. Data are means from two experiments. (D) MASP1 MT bundling and stabilization in vitro visualized using rhodamine-labeled MTs. R.T., room temperature incubation of MTs with the indicated MASP1 alleles or truncations or BSA. Cold = 10°C, 45 min. Bars = 10 μm. (E) Turbidity assay measuring MT polymerization in the presence of taxol, unmutated MASP1 (N.M.), MASP1S670A (phosphonull), or MASP1S670D (phosphomimic). Each type of MASP1 protein was present at 10 μM. All assays included glycerol to promote MT polymerization. Data shown are representative of three independent experiments. (F) Turbidity assay performed in the same manner as in (E) except that glycerol was omitted for all reactions (except taxol + glycerol) to test whether MASP1 could promote MT polymerization.
Figure 7.
Figure 7.
MASP1 Structure and Localization Experiments Indicate That It Contains a Basic C-Terminal MT Binding Domain That Is Required and Sufficient to Decorate MTs in Planta. (A) Localization and effect of oryzalin (10 μM) on transiently expressed YFP-MASP1 alleles and MASP1 truncations. Transient expression was done for 24 h and oryzalin treatment for 2.5 h for full-length unmutated MASP1 (N.M.), MASP1S670A (phosphonull), or MASP1S670D (phosphomimic) and 45 min for the MASP1 truncations (1 to 319 and 320 to 677). Bars = 10 μm. (B) Transient expression of full-length MASP1 with no mutation (N.M.) and the N-terminal MASP1 fragment (amino acids 1 to 319) for 96 h. Bars = 10 μm. (C) MASP1 structure predicted by I-Tasser (diagram generated by Pymol, nearly identical structure was predicted by Phyre2; Supplemental Figure 10A). Green = loop regions; red = helix, yellow = β-sheet. In addition, LRRsearch identified six LRR domains (Supplemental Figure 10B), which correspond to the β-sheet regions. The phosphopeptide containing Ser-670 identified in our phosphoproteomic analysis is shown in purple here and in Supplemental Figure 10B. MASP1 structure resembles typical LRR proteins, which form an α/β horseshoe fold; however, MASP1 does not have exterior helices after every turn of an interior β-sheet and thus has a less rigid secondary structure. The C-terminal β-sheet regions form a basic surface (D), which may directly contact MTs. The β-sheet LRR domains (yellow) may form multiple contact sites for lateral binding across the MTs. The internal diameter of the horseshoe structure (25 to 30 nm) is similar to the MT outer diameter (25 nm) and thus is compatible with lateral MT binding. (D) Charge plot and pI analysis showing that the C-terminal half of MASP1, including the LRR rich region, which has basic pI consistent with direct MT binding, may be the site of direct MT binding. The charge distribution and less rigid structural fold of MASP1 (C) suggests that it binds the microtubule surface in a flexible manner leaving the two ends of the protein free for additional interactions. Charge plot was drawn using Emboss explorer (http://www.bioinformatics.nl/cgi-bin/emboss/charge) with a window size of 10 amino acids and pI of different sections of MASP1 calculated using the Compute pI/Mw tool (http://web.expasy.org/cgi-bin/compute_pi/pi_tool). (E) BiFC assays of MASP1 C-terminal (320 to 677) and N-terminal (1 to 319) fragments. Bars = 20 μm.
Figure 8.
Figure 8.
Model of EGR-MASP1 Function. EGRs and MASP1 physically associate but have opposing effects on plant growth, including effects on cell expansion. EGRs are negative growth regulators and increased EGR expression at low ψw restrains growth. MASP1 is a positive regulator of growth and unknown posttranscriptional mechanism(s) lead to increased MASP1 protein accumulation at low ψw. This increased MASP1 stabilizes MTs (as indicated by the arrows between MASP1 and MTs) and preserves the competence to grow under mild to moderate low ψw stress. The effects of MASP1 on growth are epistatic to those of EGRs, and MASP1 Ser-670 phosphorylation is required for its growth-promoting activity but not for MT binding [EGR attenuation of MASP1 phosphorylation is indicated by the T-bar between EGR and MASP1; MASP1 phosphorylation by unknown kinase(s) is indicated by gray dashed arrow]. MASP1 phosphorylation may affect other aspects of its function such as binding to additional MT-associated proteins or clustering at specific sites along MTs (indicated by gray dashed arrows and question mark). Functional analysis of MASP1 indicates that the C-terminal portion binds MTs, while the N-terminal portion is required for MT bundling and stabilization and may also act to sequester MASP1 away from MTs, possibly by binding to other structures in the cell cortex (binding events shown in this study are indicated by black double-sided arrows; possible association of MASP1 with other proteins or cellular structures is indicated by gray dashed double-sided arrows). By these or related mechanisms, MASP1 stabilizes and protects MT organization in a way that promotes cell expansion and continued growth. Additional EGR target proteins are likely to be involved in drought-related signaling, for example, in the regulation of proline accumulation or MASP1-independent effects on MTs.

Comment in

Similar articles

Cited by

References

    1. Ahmadzadeh H., Smith D.H., Shenoy V.B. (2015). Mechanical effects of dynamic binding between Tau proteins on microtubules during axonal injury. Biophys. J. 109: 2328–2337. - PMC - PubMed
    1. Ambrose J.C., Wasteneys G.O. (2008). CLASP modulates microtubule-cortex interaction during self-organization of acentrosomal microtubules. Mol. Biol. Cell 19: 4730–4737. - PMC - PubMed
    1. Ambrose J.C., Shoji T., Kotzer A.M., Pighin J.A., Wasteneys G.O. (2007). The Arabidopsis CLASP gene encodes a microtubule-associated protein involved in cell expansion and division. Plant Cell 19: 2763–2775. - PMC - PubMed
    1. Ban Y., Kobayashi Y., Hara T., Hamada T., Hashimoto T., Takeda S., Hattori T. (2013). α-tubulin is rapidly phosphorylated in response to hyperosmotic stress in rice and Arabidopsis. Plant Cell Physiol. 54: 848–858. - PubMed
    1. Bannigan A., Wiedemeier A.M.D., Williamson R.E., Overall R.L., Baskin T.I. (2006). Cortical microtubule arrays lose uniform alignment between cells and are oryzalin resistant in the Arabidopsis mutant, radially swollen 6. Plant Cell Physiol. 47: 949–958. - PubMed

Publication types

MeSH terms