

cerebroViz: an R package for anatomical visualization of spatiotemporal brain data
- PMID: 28011779
- PMCID: PMC5870797
- DOI: 10.1093/bioinformatics/btw726
cerebroViz: an R package for anatomical visualization of spatiotemporal brain data
Abstract
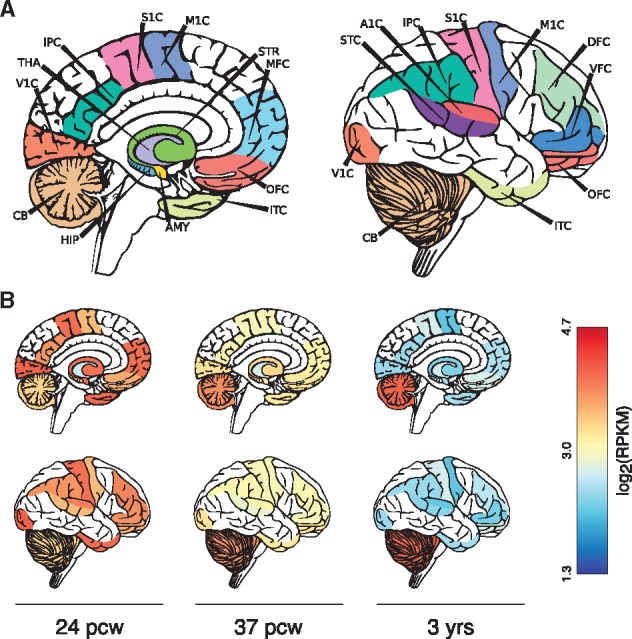
Summary: Spatiotemporal transcriptomic profiling has provided valuable insight into the patterning of gene expression throughout the human brain from early fetal development to adulthood. When combined with prior knowledge of a disease's age at onset and region-specificity, these expression profiles have provided the necessary context to both strengthen putative gene-disease associations and infer new associations. While a wealth of spatiotemporal expression data exists, there are currently no tools available to visualize this data within the anatomical context of the brain, thus limiting the intuitive interpretation of many such findings. We present cerebroViz, an R package to map spatiotemporal brain data to vector graphic diagrams of the human brain. Our tool allows rapid generation of publication-quality figures that highlight spatiotemporal trends in the input data, while striking a balance between usability and customization. cerebroViz is generalizable to any data quantifiable at a brain-regional resolution and currently supports visualization of up to thirty regions of the brain found in databases such as BrainSpan, GTEx and Roadmap Epigenomics.
Availability and implementation: cerebroViz is freely available through GitHub ( https://github.com/ethanbahl/cerebroViz ). The tutorial is available at http://ethanbahl.github.io/cerebroViz/.
Contacts: ethan-bahl@uiowa.edu or jacob-michaelson@uiowa.edu.
Supplementary information: Supplementary data are available at Bioinformatics online.
© The Author 2016. Published by Oxford University Press.
Figures
References
-
- BrainSpan (2014) BrainSpan: Atlas of the Developing Human Brain [Internet]. Funded by ARRA Awards 1RC2MH089921-01, 1RC2MH090047-01, and 1RC2MH089929-01. © 2011. http://developinghumanbrain.org.
-
- Kessler R.C. et al. (2005) Lifetime prevalence and age-of-onset distributions of DSM-IV disorders in the National Comorbidity Survey Replication. Arch. Gen. Psychiatry, 62, 593–602. - PubMed
MeSH terms
Grants and funding
LinkOut - more resources
Full Text Sources
Other Literature Sources
Molecular Biology Databases
