

Patient-specific modeling of left ventricular electromechanics as a driver for haemodynamic analysis
- PMID: 28011839
- PMCID: PMC5386137
- DOI: 10.1093/europace/euw369
Patient-specific modeling of left ventricular electromechanics as a driver for haemodynamic analysis
Abstract
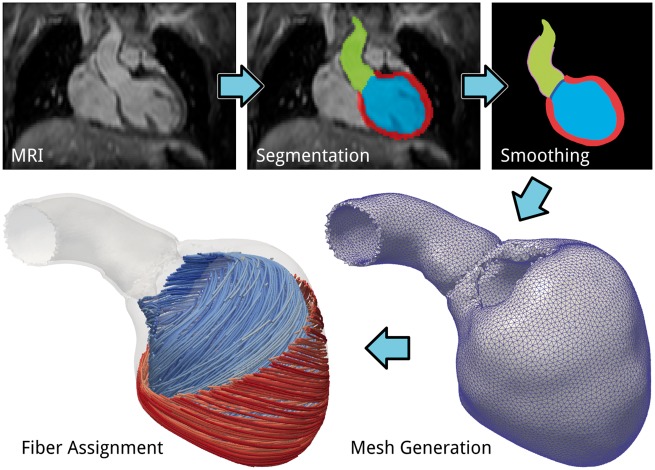
Aims: Models of blood flow in the left ventricle (LV) and aorta are an important tool for analysing the interplay between LV deformation and flow patterns. Typically, image-based kinematic models describing endocardial motion are used as an input to blood flow simulations. While such models are suitable for analysing the hemodynamic status quo, they are limited in predicting the response to interventions that alter afterload conditions. Mechano-fluidic models using biophysically detailed electromechanical (EM) models have the potential to overcome this limitation, but are more costly to build and compute. We report our recent advancements in developing an automated workflow for the creation of such CFD ready kinematic models to serve as drivers of blood flow simulations.
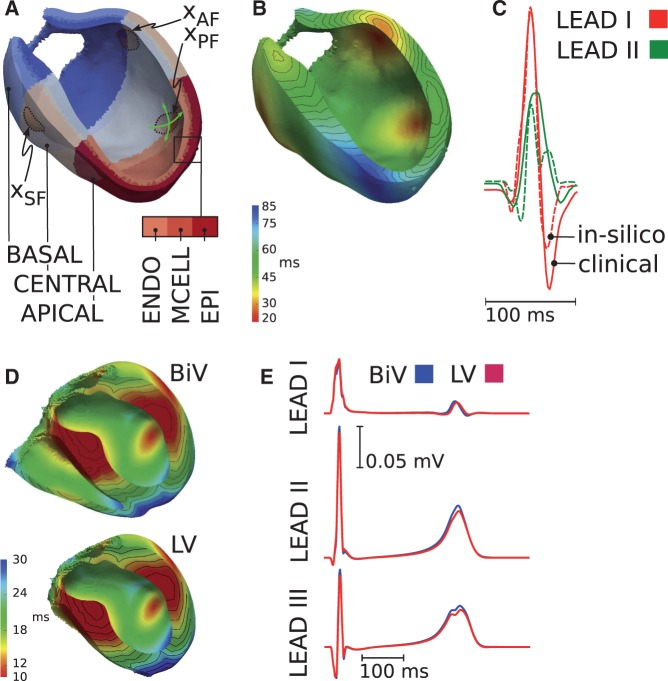
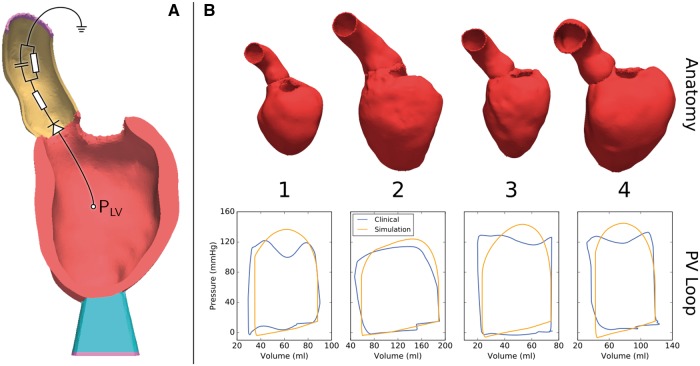
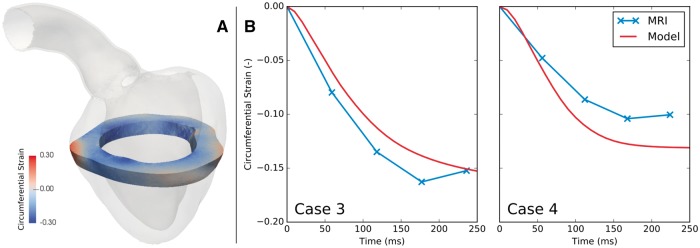
Methods and results: EM models of the LV and aortic root were created for four pediatric patients treated for either aortic coarctation or aortic valve disease. Using MRI, ECG and invasive pressure recordings, anatomy as well as electrophysiological, mechanical and circulatory model components were personalized.
Results: The implemented modeling pipeline was highly automated and allowed model construction and execution of simulations of a patient's heartbeat within 1 day. All models reproduced clinical data with acceptable accuracy.
Conclusion: Using the developed modeling workflow, the use of EM LV models as driver of fluid flow simulations is becoming feasible. While EM models are costly to construct, they constitute an important and nontrivial step towards fully coupled electro-mechano-fluidic (EMF) models and show promise as a tool for predicting the response to interventions which affect afterload conditions.
Keywords: Computer model; Left ventricular electromechanics; Personalization.
© The Author 2016. Published by Oxford University Press on behalf of the European Society of Cardiology.
Figures
References
-
- Bers DM. Cardiac excitation-contraction coupling. Nature 2002;415:198–205. - PubMed
-
- Quinn TA, Kohl P, Ravens U. Cardiac mechano-electric coupling research: fifty years of progress and scientific innovation. Prog Biophys Mol Biol 2014;115:71–5. - PubMed
-
- Fritz T, Wieners C, Seemann G, Steen H, Dössel O. Simulation of the contraction of the ventricles in a human heart model including atria and pericardium. Finite element analysis of a frictionless contact problem . Biomech Model Mechanobiol 2014;13:627–41. - PubMed
MeSH terms
Grants and funding
LinkOut - more resources
Full Text Sources
Other Literature Sources
Medical
Miscellaneous
