Review
. 2016 Dec;18(suppl 4):iv136-iv145.
doi: 10.1093/europace/euw358.

Towards personalized computational modelling of the fibrotic substrate for atrial arrhythmia

Affiliations
Review

Towards personalized computational modelling of the fibrotic substrate for atrial arrhythmia

Patrick M Boyle et al. Europace. 2016 Dec.

Abstract

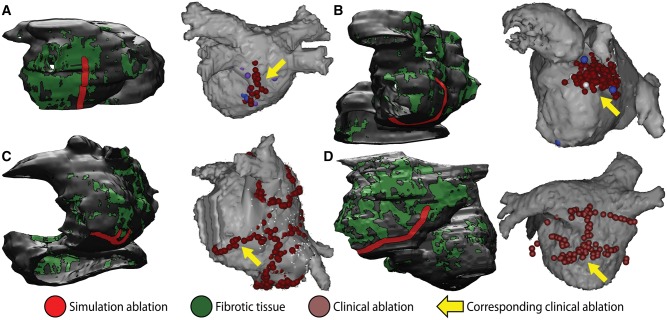
: Atrial arrhythmias involving a fibrotic substrate are an important cause of morbidity and mortality. In many cases, effective treatment of such rhythm disorders is severely hindered by a lack of mechanistic understanding relating features of fibrotic remodelling to dynamics of re-entrant arrhythmia. With the advent of clinical imaging modalities capable of resolving the unique fibrosis spatial pattern present in the atria of each individual patient, a promising new research trajectory has emerged in which personalized computational models are used to analyse mechanistic underpinnings of arrhythmia dynamics based on the distribution of fibrotic tissue. In this review, we first present findings that have yielded a robust and detailed biophysical representation of fibrotic substrate electrophysiological properties. Then, we summarize the results of several recent investigations seeking to use organ-scale models of the fibrotic human atria to derive new insights on mechanisms of arrhythmia perpetuation and to develop novel strategies for model-assisted individualized planning of catheter ablation procedures for atrial arrhythmias.

Keywords: Atrial fibrillation; Atrial flutter; Computational modelling; Fibrotic remodelling.


Figures

Figure 1
Figure 1
Wavefront propagation in 2D atrial tissue models with fibrosis patterns derived from AF patient LGE-MRI. (A–E) For models derived from scans of Utah III (top) and Utah IV (bottom) patients: fibrosis patterns, with brighter voxel intensity indicating higher LGE (A); activation times in response to pacing at left edge of model (B); bipolar electrogram signals recorded from a location 1 mm above the centre of each model (C), along with accompanied by maps of electrogram amplitude (D) and extrema count (E). (F) Panels 1–7 show activation times in a model based on scans from a Utah III patient in response to seven consecutive stimuli (same pacing electrode and colour scale as (B)). Panels 8–9 illustrate initiation of reentry due to propagation near the percolation threshold within the fibrotic tissue region. With permission from Vigmond et al.
Figure 2
Figure 2
Effect of ablating tissue enclosing organizing centres of reentry in patient-specific left atrial models. (A) For a Utah III patient, sequential maps of transmembrane voltage (Vm) illustrate the response to ectopic pacing from the left pulmonary veins, before (top) and after (bottom) the simulation of ablation lesions, as described in the text. (B) Same as (A) but for a Utah IV patient. With permission from McDowell et al.
Figure 3
Figure 3
Relationship between reentrant driver localization and fibrosis spatial pattern in patient-specific models of persistent AF. (A) Map showing activation times with respect to reference time (tref) for a reentrant driver near the inferior vena cava. Inset panels: maps of transmembrane voltage (Vm). Reentrant driver-associated phase singularities are marked by magenta spheres. (B) Phase singularity trajectory over time superimposed on activation map with fibrosis spatial pattern (green). (C) Distribution of fibrotic tissue (green) for a different patient-specific atrial model than in panels (A) and (B). Inset panels: maps of FD and FE metrics (see text) used to quantitatively characterize fibrosis spatial pattern, with fibrotic tissue boundaries and phase singularity trajectories shown as in (A). Asterisk: region with high FD, low FE. (D) Time series plots of FD and FE at phase singularity locations for the case shown in (C); values range from 0.45–0.8. With permission from Zahid et al.
Figure 4
Figure 4
Quantitative characteristics of fibrosis spatial pattern in atrial regions that harbour reentrant drivers of persistent AF. (A) 2D histogram showing the values of fibrosis density and entropy (FD and FE) metrics at locations of phase singularities associated with reentrant drivers induced by rapid pacing in 13 patient-specific models. 1D histograms of FD (above) and FE (right) values are also shown. Boxed region: values within one standard deviation of mean FD and FE values (0.37 ≤ FE ≤ 0.65; 0.46 ≤ FD ≤ 0.80). (B) Same as (A) but for locations where phase singularities were never observed. Boxed region: 0 ≤ FE ≤ 0.40; 0 ≤ FD ≤ 0.32. (C) Locations of all reentrant driver-associated phase singularities for a particular patient-derived atrial model overlaid on map showing distribution of tissue regions with the fibrosis spatial pattern identified by machine learning (see text) as favourable to the initiation and perpetuation of reentrant arrhythmia (green). (D) Maps of reentrant driver-associated phase singularity frequency obtained via ECGI during persistent AF episodes in two patients. Regions classified as favourable to reentrant driver localization by machine learning (i.e., same as green regions in (C)) are overlaid with a black crosshatched pattern. With permission from Zahid et al.
Figure 5
Figure 5
Simulations in patient-specific atrial models reconstructed from LGE-MRI can be used to predict optimal ablation targets for LAFL. (A–D) For four patients in the LAFL cohort, “minimum cut” ablations in the atrial model (left) are compared to lesions that were applied during successful clinical ablation procedures (right). Matching lesions are indicated with yellow arrows. With permission from Zahid et al.

References

    1. Andrade J, Khairy P, Dobrev D, Nattel S. The clinical profile and pathophysiology of atrial fibrillation: relationships among clinical features, epidemiology, and mechanisms. Circ Res 2014;114:1453–68. - PubMed
    1. Go AS, Hylek EM, Phillips KA, Chang Y, Henault LE, Selby JV. et al. Prevalence of diagnosed atrial fibrillation in adults: national implications for rhythm management and stroke prevention: the AnTicoagulation and Risk Factors in Atrial Fibrillation (ATRIA) study. JAMA 2001;285:2370–5. - PubMed
    1. Oakes RS, Badger TJ, Kholmovski EG, Akoum N, Burgon NS, Fish EN. et al. Detection and quantification of left atrial structural remodeling with delayed-enhancement magnetic resonance imaging in patients with atrial fibrillation. Circulation 2009;119:1758–67. - PMC - PubMed
    1. Marrouche NF, Wilber D, Hindricks G, Jais P, Akoum N, Marchlinski F. et al. Association of atrial tissue fibrosis identified by delayed enhancement MRI and atrial fibrillation catheter ablation: the DECAAF study. JAMA 2014;311:498–506. - PubMed
    1. Cochet H, Mouries A, Nivet H, Sacher F, Derval N, Denis A. et al. Age, atrial fibrillation, and structural heart disease are the main determinants of left atrial fibrosis detected by delayed-enhanced magnetic resonance imaging in a general cardiology population. J Cardiovasc Electrophysiol 2015;26:484–92. - PubMed

MeSH terms