. 2017 Jan;214(1):73-89.
doi: 10.1084/jem.20160784. Epub 2016 Dec 23.

Inherited CD70 deficiency in humans reveals a critical role for the CD70-CD27 pathway in immunity to Epstein-Barr virus infection

Affiliations

Inherited CD70 deficiency in humans reveals a critical role for the CD70-CD27 pathway in immunity to Epstein-Barr virus infection

Kazushi Izawa et al. J Exp Med. 2017 Jan.

Abstract

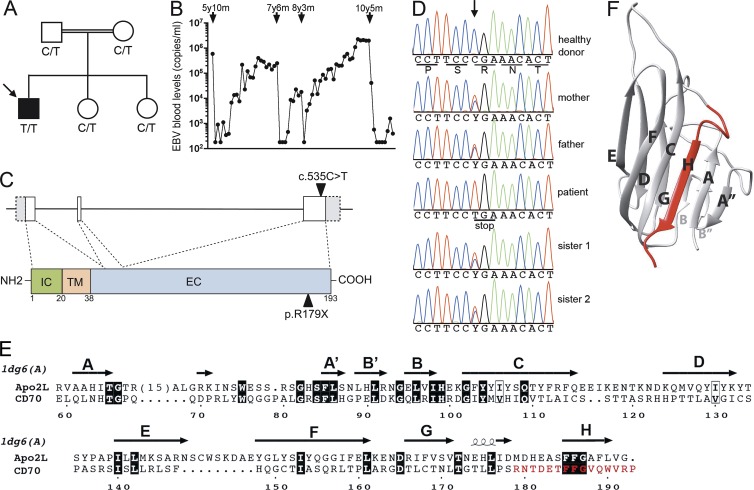
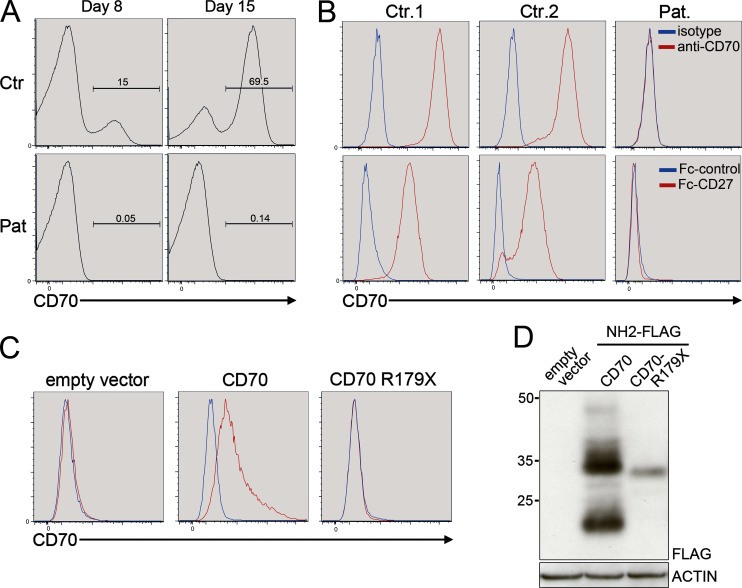
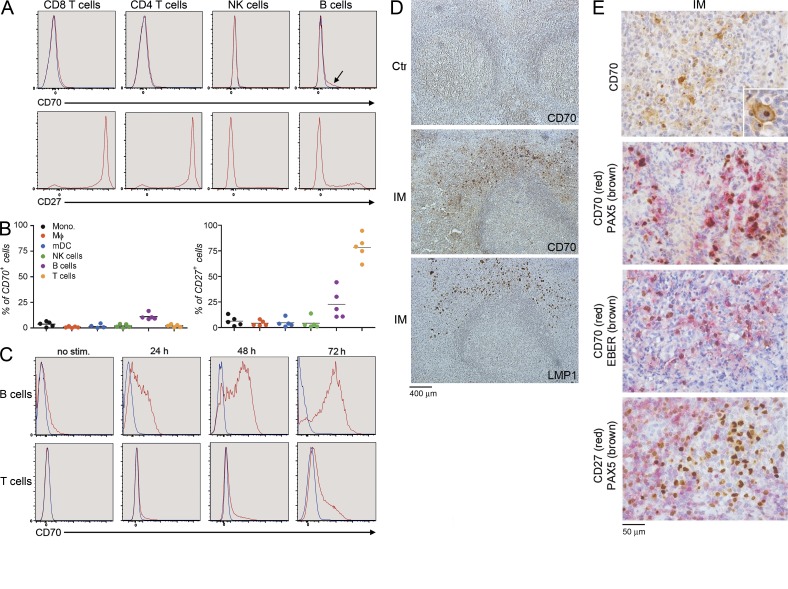
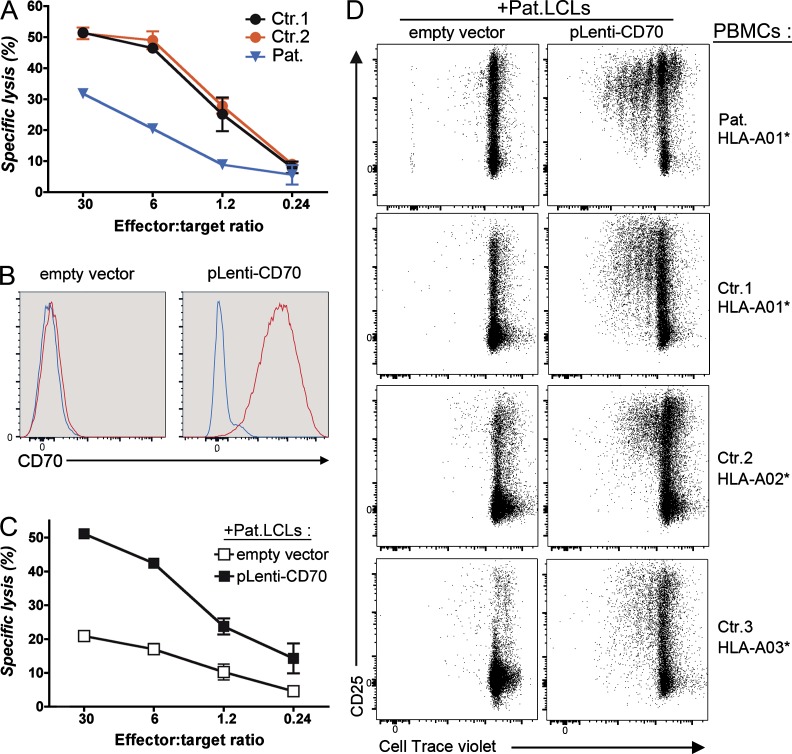
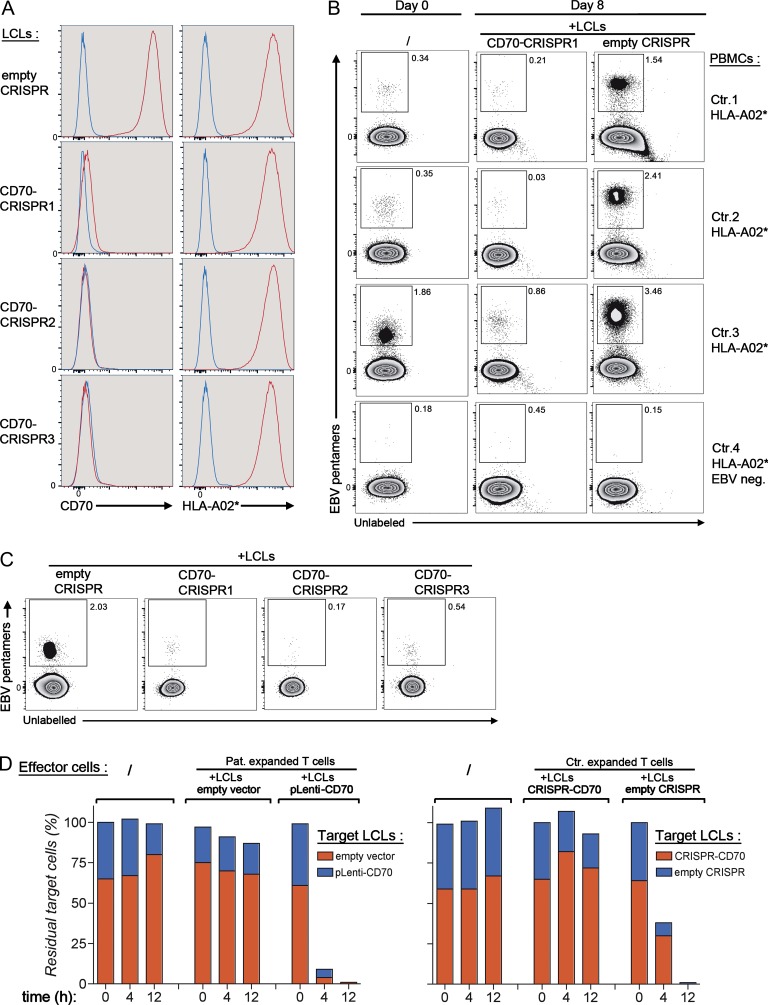
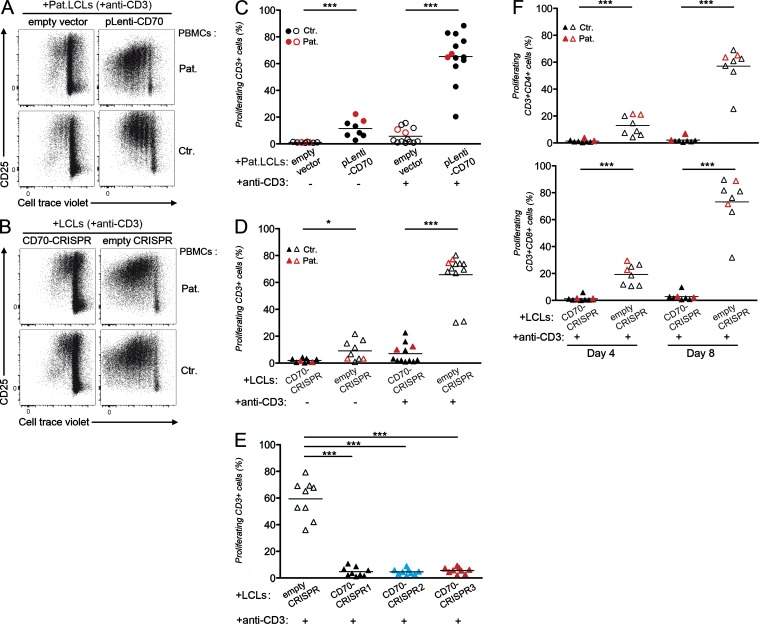
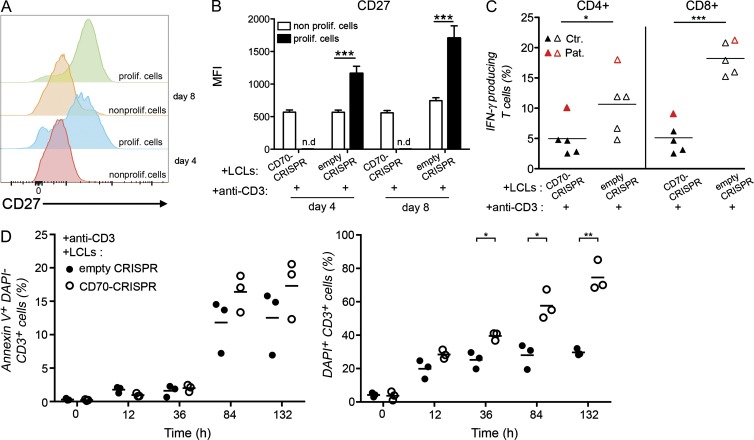
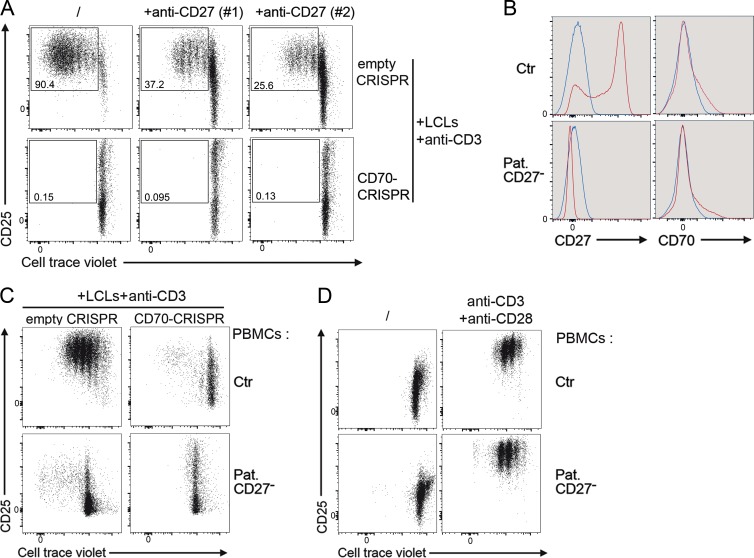
Epstein-Barr virus (EBV) infection in humans is a major trigger of malignant and nonmalignant B cell proliferations. CD27 is a co-stimulatory molecule of T cells, and inherited CD27 deficiency is characterized by high susceptibility to EBV infection, though the underlying pathological mechanisms have not yet been identified. In this study, we report a patient suffering from recurrent EBV-induced B cell proliferations including Hodgkin's lymphoma because of a deficiency in CD70, the ligand of CD27. We show that EBV-specific T lymphocytes did not expand properly when stimulated with CD70-deficient EBV-infected B cells, whereas expression of CD70 in B cells restored expansion, indicating that CD70 on B cells but not on T cells is required for efficient proliferation of T cells. CD70 was found to be up-regulated on B cells when activated and during EBV infection. The proliferation of T cells triggered by CD70-expressing B cells was dependent on CD27 and CD3 on T cells. Importantly, CD27-deficient T cells failed to proliferate when stimulated with CD70-expressing B cells. Thus, the CD70-CD27 pathway appears to be a crucial component of EBV-specific T cell immunity and more generally for the immune surveillance of B cells and may be a target for immunotherapy of B cell malignancies.


Figures

Figure 1.
Figure 1.
Identification of a mutation in CD70 in a patient suffering from defective immunity to EBV. (A) Pedigree of the family in which the c.535 C>T mutation in CD70 was identified. The arrow indicates the proband who was analyzed by whole-exome sequencing. The genotype of each individual is indicated. (B) EBV load in the blood of the patient is shown as the number of EBV copies detected by PCR at different time points (black circles). Arrows correspond to the anti-CD20 treatments received by the patient with the age (y, year; m, month) of patient at the time of the treatment. (C) Schematic representation of intron–exon organization of the CD70 gene with the coding exons in white, and their correspondence at protein level with the different domains of CD70 are shown, including the intracytoplasmic (IC), transmembrane (TM), and extracellular (EC) domains. The mutation is indicated by black triangles at the gene and protein levels. (D) DNA electropherograms of the family showing the region containing the C>T mutation in CD70 and the corresponding amino acid translation. The position of the mutation is indicated by an arrow, and the stop codon caused by the C>T mutation is indicated. (E) Alignment of the human CD70 sequence with that of Apo2L, whose 3D structure is known. Observed secondary structures are shown above the sequences. The position of the missing amino acids in the truncated protein is shown in red. (F) Ribbon representation of the 3D structure model of human CD70. The model was built using the experimental 3D structure of Apo2L (Protein Data Bank accession no. 1DG6) based on the alignment shown in E. The position of the missing strand in the truncated protein is shown in red.
Figure 2.
Figure 2.
The R179X mutation in CD70 prevents binding to CD27. (A) FACS histograms showing CD70 expression detected with anti-CD70 antibody on PHA-stimulated T cells from the patient (Pat.) or a healthy control (Ctr) at days 8 and 15 of culture. Numbers inside the histograms correspond to the percentage of positive cells. One representative of three independent experiments is shown. (B) FACS histograms showing CD70 expression on LCLs from the patient or two healthy control individuals (Ctr.1 and Ctr.2) detected with anti-CD70 antibody (top) or revealed by the ability of CD70 to bind CD27-Fc fusion protein (bottom). One representative of three independent experiments is shown. (C) Histograms showing the binding of a CD27-Fc fusion protein on HEK 293 T cells transfected with an empty expression vector (empty vector) or a vector containing cDNAs coding of either NH2-FLAG–tagged CD70 (CD70) or NH2-FLAG–tagged R179X CD70 (CD70 R179X). One representative of two independent experiments is shown. (D) Same as C, expect that CD70 expression was analyzed by Western blotting in cell lysates using anti-FLAG antibody. Molecular weights in kilodaltons are shown on the left. One representative of two independent experiments is shown.
Figure 3.
Figure 3.
CD70 expression is up-regulated in activated B lymphocytes and EBV-infected B cells. (A) FACS histograms showing the expression of CD70 (top) or CD27 (bottom) on the different lymphoid subpopulations from PBMCs of one healthy donor. (Top) The control isotype is shown by the blue line, whereas the red line corresponds to anti-CD70 or -CD27 staining. The arrow indicates the population of B cells expressing CD70. One representative of three independent experiments is shown. (B) Percentage of CD70- or CD27-expressing cell populations among PBMCs of five healthy donors from FACS analysis stained with markers for macrophages (Mφ), monocytes (Mono), dendritic cells (mDC), T cells, B cells, and NK cells. Data from two independent experiments are shown. n = 5. (C) FACS histograms showing the expression of CD70 on B cells and T cells from PBMCs of a healthy individual that have been activated for different periods of time with PMA + ionomycin. The blue line corresponds to the isotype, whereas the red line corresponds to the anti-CD70 antibody. One representative of three independent experiments is shown. stim., simulation. (D) Analysis of CD70 expression on tonsils of one healthy control (Ctr) and one individual with infectious mononucleosis (IM). Immunostaining for CD70 and LMP-1 expression is shown. (E) Immunostaining of tonsils from one individual with infectious mononucleosis for CD70, PAX5 (B cell marker), EBER probe, and CD27 expression. Large cells are CD70 positive (inset) with a membrane and an intracytoplasmic (dot) staining (top). CD70-positive cells are PAX5+ and EBV+ (EBER; middle), and CD27 is not expressed on the PAX5+ cells (bottom). One representative of two experiments with two different individuals with IM tested.
Figure 4.
Figure 4.
Decreased cytolytic and proliferative responses to autologous CD70-deficient LCLs of the patient are restored by expression of CD70 in LCLs. (A) Cytotoxic response of T cells from two control individuals (Ctr.1 and Ctr.2) and the CD70-deficient patient (Pat.) against autologous LCLs as measured by Cr51 release at the indicated effector-to-target ratios. T cells have been co-cultured with the autologous LCLs for 4 wk before the test. One representative of two independent experiments and triplicates with SD are shown. (B) FACS histograms of CD70 expression on LCLs of the patient that have been infected with an empty lentiviral vector (empty vector) or a vector containing a cDNA coding wild-type CD70 (pLenti vector). One representative of five independent experiments is shown. (C) Same as A except that T cells from the patient were co-cultured with autologous CD70-deficient LCLs of the patient (Pat.LCLs) in which CD70 expression was restored (pLenti-CD70) or not (empty vector). Duplicates with SD are shown. (D) Proliferation of T cells from PBMCs of the patient and HLA-A matched (Ctrl.1 HLA-A01*) or nonmatched (Ctr.2 HLA-A02* and Ctr.3 HLA-A03*) healthy controls that were co-cultured for 8 d in the presence of irradiated CD70-deficient LCLs of the patient in which CD70 expression was restored or not. Representative dot plots of violet dye dilution and CD25 expression gated on CD3+ cells are shown. Numbers inside the gates correspond to the percentage of dividing cells. One representative of five independent experiments is shown.
Figure 5.
Figure 5.
CD70 on LCLs is required for patient and control T cell expansion of EBV-specific T cells. (A) FACS histograms showing the expression of CD70 and HLA-A02* on LCLs from an HLA-A02* healthy donor, in which the CD70 gene was knocked out by CRISPR-Cas9–targeting exon 3 with three different RNA guides (CD70-CRISPR1, CD70-CRISPR2, and CD70-CRISPR3). One representative of four independent experiments is shown. (B) Dot plots from FACS analysis showing EBV-specific T cells gated on CD8+CD3+ T cells stained with EBV-specific HLA-A02* pentamers among PBMCs that have been co-cultured for 8 d or not in the presence of irradiated HLA-A02* CD70-expressing LCLs or HLA-A02* CD70-deficient CD70-CRISPR1 LCLs. PBMCs from the patient and four healthy donors (Ctr.1, Crt.2, Ctr.3, and Ctr.4). Control 4 has not been infected by EBV and had a negative EBV serology (EBV neg.). Numbers in the plots indicate the percentage of EBV pentamer–positive cells in the gates. One representative of four independent experiments is shown. (C) Same as B, except that the presence of EBV-specific T cells of healthy donor control 1 was tested in the presence of two other irradiated HLA-A02* CD70-deficient LCLs, CD70-CRISPR2 and CD70-CRISPR3, obtained by CRISPR-Cas9. Numbers in the plots indicate the percentage of EBV-pentamer–positive cells in the gates. One representative of two independent experiments is shown. (D) Analysis of cytolytic activity of T cells expanded from PBMCs of the CD70-deficient patient (Pat. expanded T cells) and one healthy control (Ctr. expanded T cells) for 8–15 d with irradiated autologous CD70-expressing (pLenti-CD70 or empty CRISPR) or CD70-deficient (empty vector or CD70-CRISPR) LCL cells. Cytolytic activity of T cells was then tested against a mixture of autologous CD70-expressing (blue) or CD70-deficient (red) LCL cells as target cells (Target LCLs) at an effector-to-target ratio of 1:1 of 1 for 0, 4, and 12 h. Residual target cells were evaluated by FACS analysis. Data are represented in percentages of cells normalized to the percentages at time 0. One representative of two independent experiments is shown.
Figure 6.
Figure 6.
CD3-mediated T cell proliferation by LCLs is dependent on their expression of CD70. (A) Proliferation of T cells from PBMCs from the CD70-deficient patient (Pat.) or an HLA-A02* healthy donor (Ctr.) cultured during 8 d with irradiated LCLs (+LCLs) from the patient expressing (pLenti-CD70) or not expressing (empty vector) CD70. Irradiated LCLs were preincubated with anti-CD3 antibody (+anti-CD3) before to be added to the PBMCs. Representative dot plots of violet dye dilution and CD25 expression gated on CD3+ cells from one of four independent experiments are shown. (B) Same as A, except that PBMCs were cultured with irradiated LCLs from one healthy donor expressing (empty CRISPR) or not expressing (CD70-CRISPR) CD70 preincubated with anti-CD3 antibody. One representative of four independent experiments is shown. (C and D) Same as in A and B, except that several donors and the patient were tested, and proliferation was also examined in the absence of anti-CD3 (n = 8 in C; n = 9 in D) or in presence of anti-CD3 antibody (n = 13 in C; n = 12 in D) during the preincubation with LCLs. Percentage of proliferating CD3+ T cells corresponds to cells having at least achieved one division based on the dilution of the violet dye. Percentages from FACS analysis histograms of violet dye staining are shown. PBMCs from seven (C) or six (D) different healthy donors are shown. Patient PBMC results are shown in red. Data are from five independent experiments. (E) Same as B, except that six different donors were tested, and PBMCs were co-cultured with two other irradiated CD70-deficient LCLs (CD70-CRISPR2 or CD70-CRISPR3) preincubated with anti-CD3 antibody. Percentage of proliferating CD3+ T cells corresponds to cells having at least achieved one division based on the dilution of the violet dye. Data from two independent experiments are shown. n = 9. (F) Same as B, except that PBMCs of six different donors and the patient were tested for the proliferation of CD3+CD4+ and CD3+CD8+ T cells at day 4 and day 8 after being incubated with irradiated LCLs from one healthy donor expressing (empty CRISPR) or not expressing (CD70-CRISPR) CD70 preincubated with anti-CD3 antibody. One representative of three independent experiments is shown. (C–F) Unpaired Student’s t tests were used. *, P < 0.05; ***, P < 0.0001.
Figure 7.
Figure 7.
Proliferating T cells that expand in response to CD70 expressed CD27 and are effector cells. (A) Example of FACS histograms of CD27 expression at days 4 and 8 on T cells from PBMCs of one healthy donor that have been cultured in the presence of irradiated CD70-expressing LCLs (empty CRISPR) preincubated with anti-CD3 antibody. Proliferation is analyzed the same as in Fig. 6 B. Proliferating (prolif.) T cells gated on CD3+ cells correspond to cells having at least achieved one division measured by CellTrace violet dye dilution. One representative experiment of five independent experiments is shown. (B) Mean fluorescence intensity (MFI) of CD27 expression calculated from FACS histograms corresponding to A. Means with SEM are presented. Data are from five independent experiments. (C) Intracellular IFN-γ expression from FACS analysis in CD4+ or CD8+ T cells from PBMCs of four different control (Ctr.) individuals and the patient (Pat.; red; n = 5) that have been cultured in the presence of irradiated LCLs (+LCLs) expressing (empty CRISPR) or not expressing (CD70-CRISPR) CD70 preincubated with anti-CD3 antibody (+anti-CD3). Before being tested for cytokine expression by FACS, T cells were restimulated with anti-CD3 antibody for 12 h. (D) Apoptosis and cell death of CD3+ T cells from FACS analysis with staining with annexin V and DAPI of PBMCs from three different healthy controls that have been cultured in the presence of irradiated LCLs expressing or not expressing CD70 preincubated with anti-CD3 antibody for different periods of time. Left and right panels correspond to apoptotic cells (annexinV+DAPICD3+ cells) and dead cells (DAPI+CD3+ cells), respectively. Each point corresponds to a mean of duplicates. (B–D) Unpaired Student’s t tests were used. *, P < 0.05; **, P <0.001; ***, P < 0.0001.
Figure 8.
Figure 8.
CD27 on T cells is required for CD70-mediated T cell proliferation by LCLs. (A) Proliferation of T cells from PBMCs of one healthy donor were cultured for 8 d in the presence of irradiated LCLs (+LCLs) expressing (empty CRISPR) or not expressing (CD70-CRISPR) CD70 preincubated with anti-CD3 antibody in the presence or not (/) of 10 µg/ml anti-CD27 antibody (clones LG.3A10 [#1] or O323 [#2]). Numbers in the gates indicate the percentage of dividing cells. Representative dot plots of violet dye dilution and CD25 expression gated on CD3+ cells from one of three independent experiments are shown. (B) FACS histograms of CD27 expression on T cell blasts from healthy control (Ctr.) and a CD27-deficient patient (Pat. CD27). One representative of three independent experiments is shown. (C) Proliferation of T cells from PBMCs of a control and a CD27-deficient patient cultured for 8 d in the presence of irradiated LCLs expressing or not expressing CD70 preincubated with anti-CD3 antibody (+anti-CD3). Representative dot plots of violet dye dilution and CD25 expression gated on CD3+ cells from one of two independent experiments are shown. (D) Proliferation of T cells from PBMCs of a control and a CD27-deficient patient stimulated for 8 d by the coated beads with anti-CD3 and anti-CD28 antibodies. Dot plots of violet dye dilution and CD25 expression gated on CD3+ cells from one of two independent experiments are shown.

References

    1. Akiba H., Nakano H., Nishinaka S., Shindo M., Kobata T., Atsuta M., Morimoto C., Ware C.F., Malinin N.L., Wallach D., et al. . 1998. CD27, a member of the tumor necrosis factor receptor superfamily, activates NF-κB and stress-activated protein kinase/c-Jun N-terminal kinase via TRAF2, TRAF5, and NF-κB-inducing kinase. J. Biol. Chem. 273:13353–13358. 10.1074/jbc.273.21.13353 - DOI - PubMed
    1. Alkhairy O.K., Perez-Becker R., Driessen G.J., Abolhassani H., van Montfrans J., Borte S., Choo S., Wang N., Tesselaar K., Fang M., et al. . 2015. Novel mutations in TNFRSF7/CD27: Clinical, immunologic, and genetic characterization of human CD27 deficiency. J. Allergy Clin. Immunol. 136:703–712.e10. 10.1016/j.jaci.2015.02.022 - DOI - PubMed
    1. Andreotti A.H., Schwartzberg P.L., Joseph R.E., and Berg L.J.. 2010. T-cell signaling regulated by the Tec family kinase, Itk. Cold Spring Harb. Perspect. Biol. 2:a002287 10.1101/cshperspect.a002287 - DOI - PMC - PubMed
    1. Arens R., Tesselaar K., Baars P.A., van Schijndel G.M., Hendriks J., Pals S.T., Krimpenfort P., Borst J., van Oers M.H., and van Lier R.A.. 2001. Constitutive CD27/CD70 interaction induces expansion of effector-type T cells and results in IFNγ-mediated B cell depletion. Immunity. 15:801–812. 10.1016/S1074-7613(01)00236-9 - DOI - PubMed
    1. Atherly L.O., Brehm M.A., Welsh R.M., and Berg L.J.. 2006. Tec kinases Itk and Rlk are required for CD8+ T cell responses to virus infection independent of their role in CD4+ T cell help. J. Immunol. 176:1571–1581. 10.4049/jimmunol.176.3.1571 - DOI - PubMed

Publication types

Substances